Copyright
©2014 Baishideng Publishing Group Inc.
World J Cardiol. Jul 26, 2014; 6(7): 585-601
Published online Jul 26, 2014. doi: 10.4330/wjc.v6.i7.585
Published online Jul 26, 2014. doi: 10.4330/wjc.v6.i7.585
Figure 1 Representative cine-cardiac magnetic resonance images in a 62-year-old male patient with dilated cardiomyopathy.
The images show mid-ventricular short axis (A), horizontal axis (4-chambers) (B) and vertical long axis views (C). The images reveal dilatation of left ventricular (LV) cavity and diffuse wall thinning (relatively homogenous). The LV end-diastolic volume, LV end-systolic volume, LV ejection fraction (EF) and LV mass are 329.1 mL, 252.5 mL, and 23.3%, 153.2 g, respectively. LV and RV: Left and right ventricles; LA and RA: Left and right atria; LV: Left ventricular.
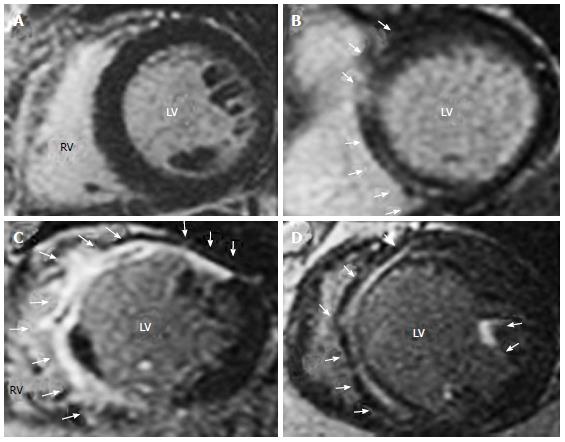
Figure 2 Representative short axis late gadolinium enhancement-cardiac magnetic resonance images in patients with dilated cardiomyopathy.
A: No LGE; B: localized LGE. Mid-wall LGE distributed only into anterior and inferior septum; C: Extensive LGE. LGE distributed at anterior and inferior septum, anterior, antero-lateral and inferior LV segments; D: Extensive LGE. Mid wall LGE distributed at anterior and inferior septum, and at anterior papillary muscle. Arrows indicate LGE in LV wall segments. All the images are taken from Machii et al[13] with permission. LGE: Late gadolinium enhancement; LV: Left ventricular.
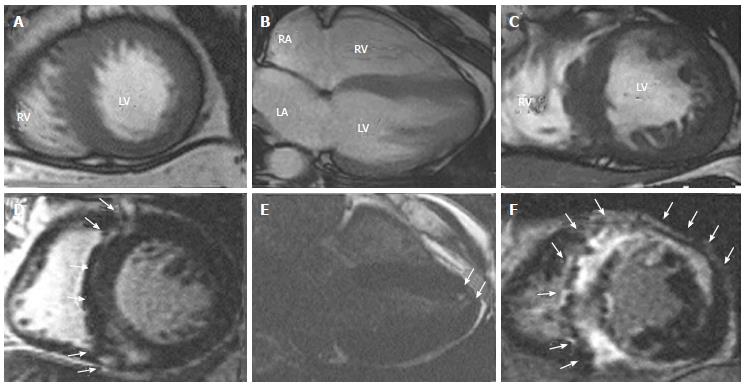
Figure 3 Representative cine-cardiac magnetic resonance (A-C) and late gadolinium enhancement-cardiac magnetic resonance (D-F) images in patients with various phenotypes of hypertrophic cardiomyopathy.
A, D: ASH (short axis views); B, E: APH (horizontal views); C, F: End-stage HCM (short axis views). LGE was mainly localized in the ventricular septum and right ventricular insertion points in ASH and in the apex in APH (arrows). Note the inhomogeneous LV wall thickness and diffusely spread LGE in end-stage HCM. All the images are taken from Satoh et al[11]. ASH: Asymmetrical septal hypertrophy; APH: Apical hypertrophy; LGE: Late gadolinium enhancement; LV: Left ventricular; HCM: Hypertrophic cardiomyopathy.
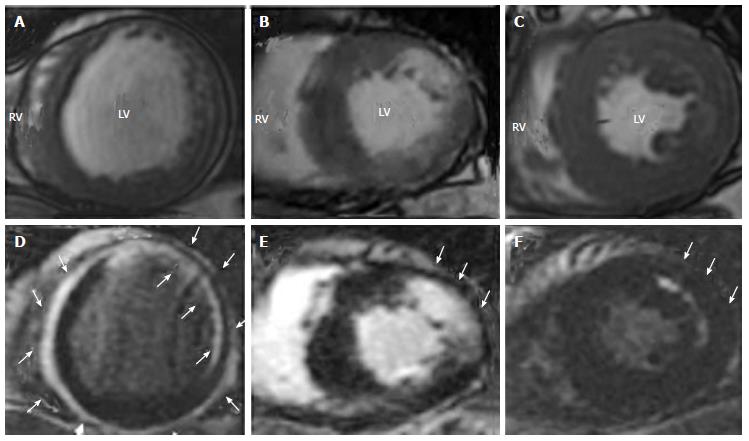
Figure 4 Representative cine-cardiac magnetic resonance (A-C) and late gadolinium enhancement-cardiac magnetic resonance (D-F) images in patients with cardiac sarcoidosis.
A, D: A patient with LV dilatation, reduced LVEF (22%) and circumferential subepicardial and subendocardial LGE with spared mid-myocardium; B, E: A patient with reduced LVEF (38%) and nodular LGE in antero-lateral wall; C, F: A patient with preserved LVEF (58%) with mid-wall striated LGE in antero-lateral wall. White arrows indicate LGE areas. A part of the images is taken from Matoh et al[10] with permission. LGE: Late gadolinium enhancement; LV: Left ventricular; LVEF: Left ventricular ejection fraction
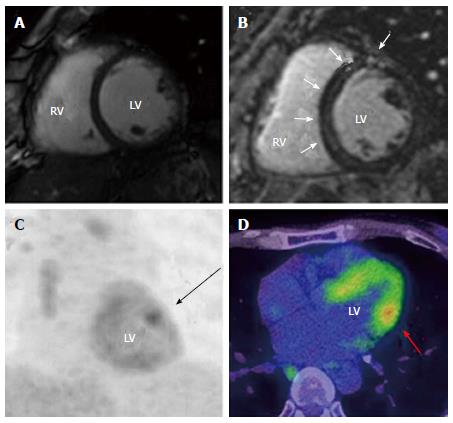
Figure 5 Representative short axis cine- cardiac magnetic resonance (A), late gadolinium enhancement-cardiac magnetic resonance (B), 18F-fluorodeoxyglucose-positron emission computed tomography (C), and positron emission computed tomography (D) images in a 57-year-old male patient with systemic sarcoidosis.
The diagnosis of sarcoidosis was made with liver biopsy. Cine-CMR images shows normal LV size and contraction (LVEDV: 119 mL, LVEF: 73%), but LGE-CMR reveals patchy and striated LGE in anterior wall and inter-ventricular septum (white arrows). The patient was negative for cardiac involvement of sarcoidosis according to the guideline of Japanese Ministry of Health and Welfare. However, FDG-PET and PET-CT images demonstrate hot spot in postero-lateral wall of LV, indicative of active inflammatory change (black and red arrows). FDG-PET: 18F-fluorodeoxyglucose-positron emission computed tomography; LGE: Late gadolinium enhancement; LV: Left ventricular; LGE-CMR: Late gadolinium enhancement-cardiac magnetic resonance.
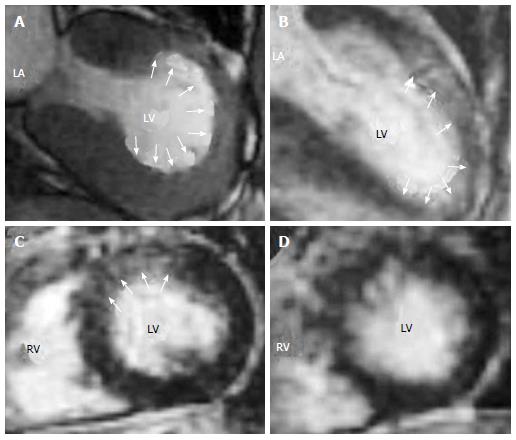
Figure 6 Representative cine-cardiac magnetic resonance (A) and late gadolinium enhancement-cardiac magnetic resonance (B-D) images in a case of stress (Takotsubo) cardiomyopathy.
The images show vertical long axis (A, B) and mid-ventricular short axis (C, D) views. The cine-CMR image during systole (A) shows mid-anterior dyskinesis (white arrows). LGE-CMR images on the sub-acute phase (B, C) show that the area of LGE was well matched with the area of wall motion abnormality (white arrows). On the follow-up phase, LV systolic function recovered, and the LGE-CMR image (D) could not detect significant LGE in the LGE area observed on the sub-acute phase. All the images are taken from Naruse et al[69] with permission. LGE: Late gadolinium enhancement; LV: Left ventricular; LGE-CMR: Late gadolinium enhancement-cardiac magnetic resonance.
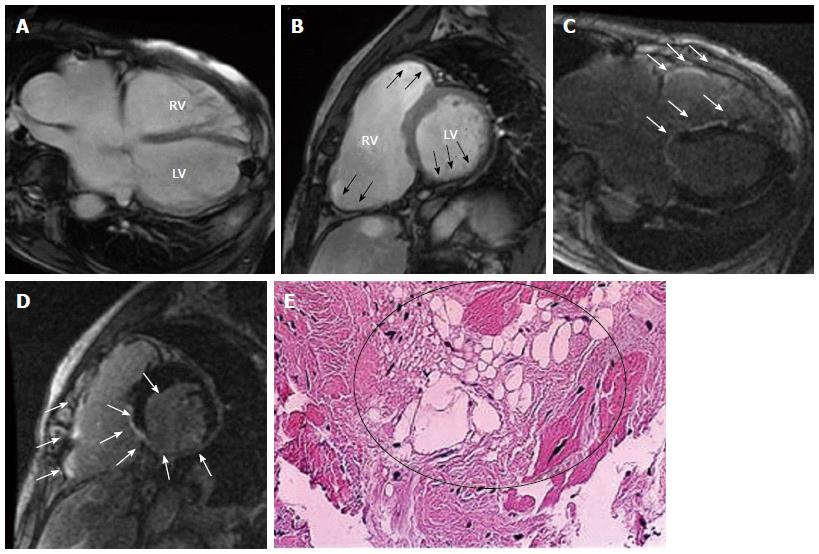
Figure 7 Representative cine- cardiac magnetic resonance (A, B) and late gadolinium enhancement-cardiac magnetic resonance (C, D) images in a 55- year-old male patient with arrhythmogenic right ventricular cardiomyopathy/dysplasia.
The images show horizontal axis (4-chambers) (A, C) and mid-ventricular short axis (B, D) views. Cine-CMR images reveal dilatation of both RV and LV chamber. Focal dilatation of RV and wall thinning in inferior LV wall are also apparent (black arrows). LGE-CMR images show diffuse LGE in RV wall and in inferior LV wall (white arrows). A sub-endocardial biopsy demonstrates fatty infiltration in RV myocardium (Circle, H-E stain, 100×). LGE: Late gadolinium enhancement; LV: Left ventricular; LGE-CMR: Late gadolinium enhancement-cardiac magnetic resonance; RV: Right ventricular.
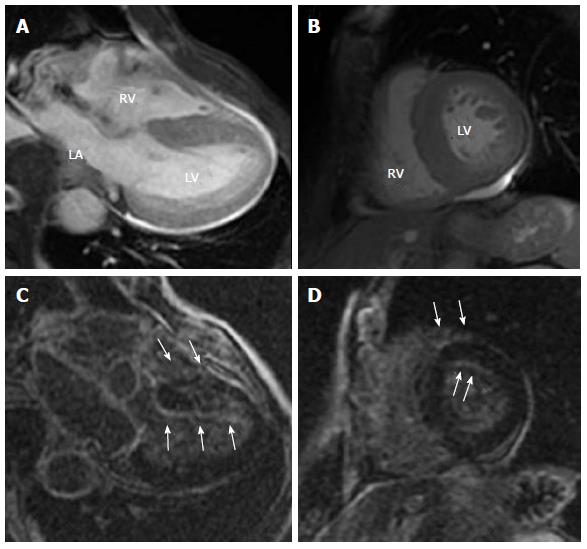
Figure 8 Representative cine-cardiac magnetic resonance (A, B) and Late gadolinium enhancement-cardiac magnetic resonance (C, D) images in a 76-year-old male patient with AL amyloidosis (IgAλ type multiple myeloma, Bence-Jones protein positive).
The images show horizontal axis (4-chmbers) (A, C) and mid-ventricular short axis (B, D) views. Cine-CMR images reveal diffuse hypertrophy in LV and RV wall. LGE-CMR images show a characteristic subendocardial enhancement of the LV and RV with an atypically dark appearance of the blood pool (white arrows). LGE: Late gadolinium enhancement; LV: Left ventricular; LGE-CMR: Late gadolinium enhancement-cardiac magnetic resonance; RV: Right ventricular.
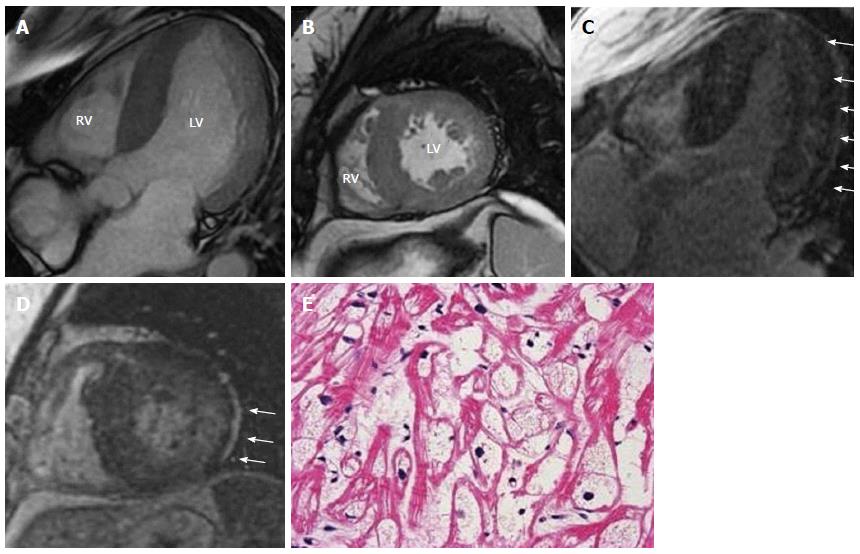
Figure 9 Representative cine- cardiac magnetic resonance (A, B) and late gadolinium enhancement-cardiac magnetic resonance (C, D) images in a 46-year-old female patient with Anderson-fabry disease.
The images show horizontal axis (4-chambers) (A, C) and mid-ventricular short axis (B, D) views. Cine-CMR images reveal diffuse hypertrophy of LV wall. LGE-CMR images show a particular LGE distribution pattern to the infero-lateral mid to basal segments and to mid-myocardial layer (white arrows). E: A sub-endocardial biopsy from RV wall demonstrates interstitial fibrosis and cardiomyocyte hypertrophy with cytoplasmic vacuolization (H-E stain, 40×). LGE: Late gadolinium enhancement; LV: Left ventricular; LGE-CMR: Late gadolinium enhancement-cardiac magnetic resonance; RV: Right ventricular.
- Citation: Satoh H, Sano M, Suwa K, Saitoh T, Nobuhara M, Saotome M, Urushida T, Katoh H, Hayashi H. Distribution of late gadolinium enhancement in various types of cardiomyopathies: Significance in differential diagnosis, clinical features and prognosis. World J Cardiol 2014; 6(7): 585-601
- URL: https://www.wjgnet.com/1949-8462/full/v6/i7/585.htm
- DOI: https://dx.doi.org/10.4330/wjc.v6.i7.585


