Copyright
©2014 Baishideng Publishing Group Inc.
World J Cardiol. Jul 26, 2014; 6(7): 577-584
Published online Jul 26, 2014. doi: 10.4330/wjc.v6.i7.577
Published online Jul 26, 2014. doi: 10.4330/wjc.v6.i7.577
Figure 1 Average intracellular Ca2+ transients and isometric stress.
Data were recorded from left ventricular trabeculae of diabetic (red lines) and control (black lines) hearts at 5 Hz, 37 °C, and 1.5 mmol [Ca2+]o, 7 trabeculae per group. A: Ca2+ transient (340/380 fluorescence ratio); B: Stress; C: Phase plots of the relationship between fluorescence and stress. The arrows indicate the direction of time, and the dashed grey lines accentuate the slope of the relaxation component. (Modified from Zhang et al[23]).
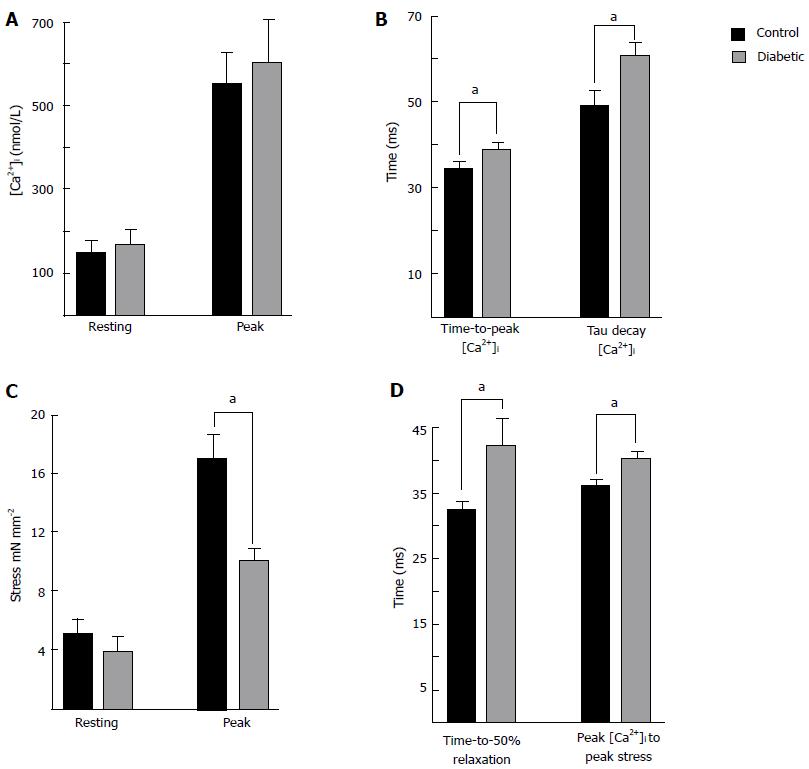
Figure 2 Summary of intracellular Ca2+ and isometric stress parameters.
Data were recorded from left ventricular trabeculae at 37 °C, 5 Hz stimulation frequency, and 1.5 mmoL [Ca2+]o. Data are mean ± SE 8 wk post injection for control (n = 7) and diabetic (n = 8). A: Shows resting and peak [Ca2+]i. The Ca2+ transients were prolonged in diabetic trabecuae; B: Shows the time to reach peak [Ca2+]i, and the time constant of the Ca2+ transient decay; C: Shows no difference in resting stress, but peak stress was reduced in diabetic trabeculae; D: Shows the time to 50% relaxation of stress was prolonged in diabetic, as was the time from the peak of the Ca2+ transient to the peak of the twitch. aP < 0.05, diabetic vs control.
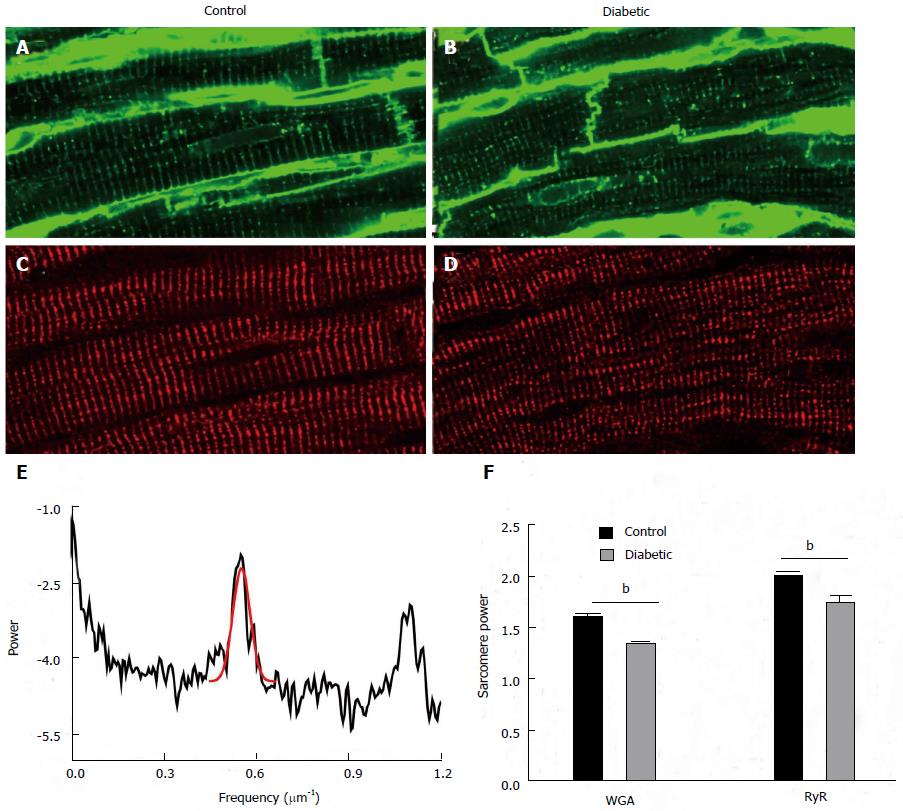
Figure 3 Structural changes in proteins associated with excitation-contraction coupling.
Transverse tubules were visualised by labelling with wheat germ agglutinin in (A) control and (B) diabetic tissue. The same tissue sections were dual labelled with antibodies against ryanodine receptors (RyR) in (C) control and (D) diabetic tissue. The periodicity or regularity of labelling was assessed using a fast Fourier transform. An example of this analysis is shown in (E) which is the plot of the FFT in control myocyte labelled with RyR. The peak associated with sarcomeric periodicity (approximately 0.55 μm-1) is fitted with a Gaussian in red. The height of this peak is used as a metric to assess the regularity of sarcomere labelling termed “sarcomere” power. (F) This shows the mean sarcomere power for both wheat germ agglutinin and ryanodine receptor labelling from 18 cells from 3 control animals and 18 cells from 3 diabetic animals. Both wheat germ agglutinin and ryanodine receptor sarcomere power were modestly but highly significantly reduced in cells from diabetic hearts (Bonferroni corrected t test, bP < 0.01, diabetic vs control.).
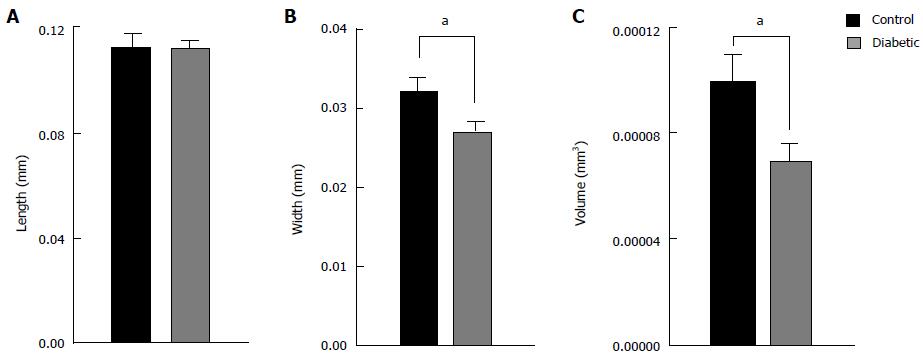
Figure 4 Average dimensions of isolated ventricular myocytes from diabetic and control rat hearts.
Cell length (A) was not different between diabetic (n = 35) and control (n = 19) hearts, whereas cell width (B) and cell volume (C) was reduced. aP < 0.05, diabetic vs control.
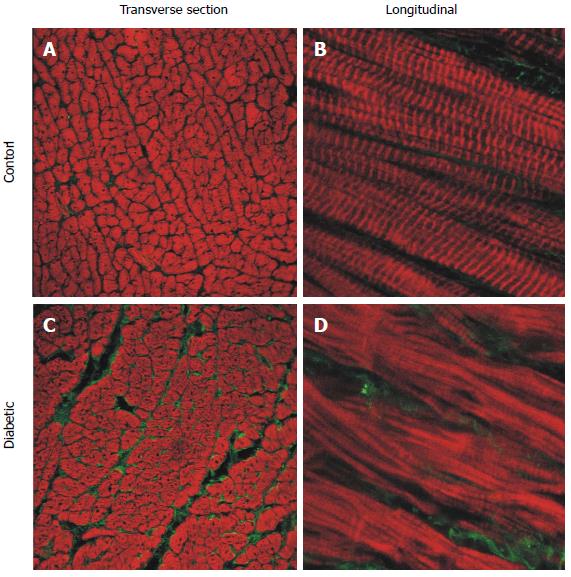
Figure 5 Representative confocal images of longitudinal section free wall immuno-labelled for type I collagen (green) and f-actin (red).
Sections from the endocardium of control (A and B) and diabetic (C and D) rat hearts. Left hand side panels: Transverse sections from endocardium (25 × objective). Right hand side panels: Longitudinal sections (63 × objective, zoom × 3). (Modified from Zhang et al[23]).
- Citation: Ward ML, Crossman DJ. Mechanisms underlying the impaired contractility of diabetic cardiomyopathy. World J Cardiol 2014; 6(7): 577-584
- URL: https://www.wjgnet.com/1949-8462/full/v6/i7/577.htm
- DOI: https://dx.doi.org/10.4330/wjc.v6.i7.577


