Copyright
©2014 Baishideng Publishing Group Inc.
World J Cardiol. Jun 26, 2014; 6(6): 405-414
Published online Jun 26, 2014. doi: 10.4330/wjc.v6.i6.405
Published online Jun 26, 2014. doi: 10.4330/wjc.v6.i6.405
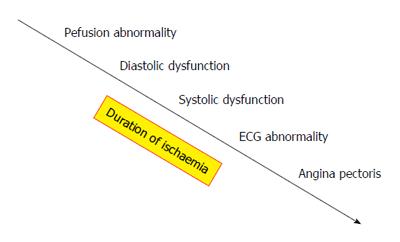
Figure 1 Cascade of events following coronary artery occlusion.
(Adapted from Gani et al[14]). ECG: Electrocardiography.
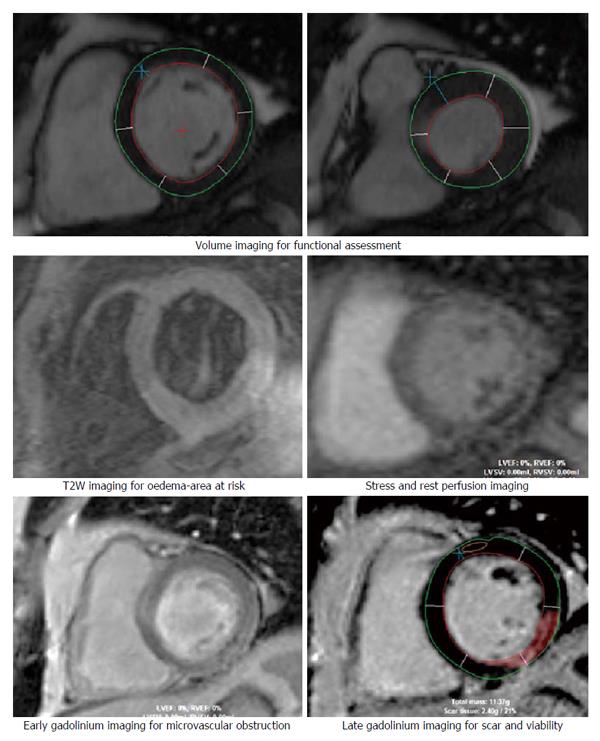
Figure 2 Cardiovascular magnetic resonance imaging sequence employed for the diagnosis of acute coronary syndrome.
T2W: T2-weighted.
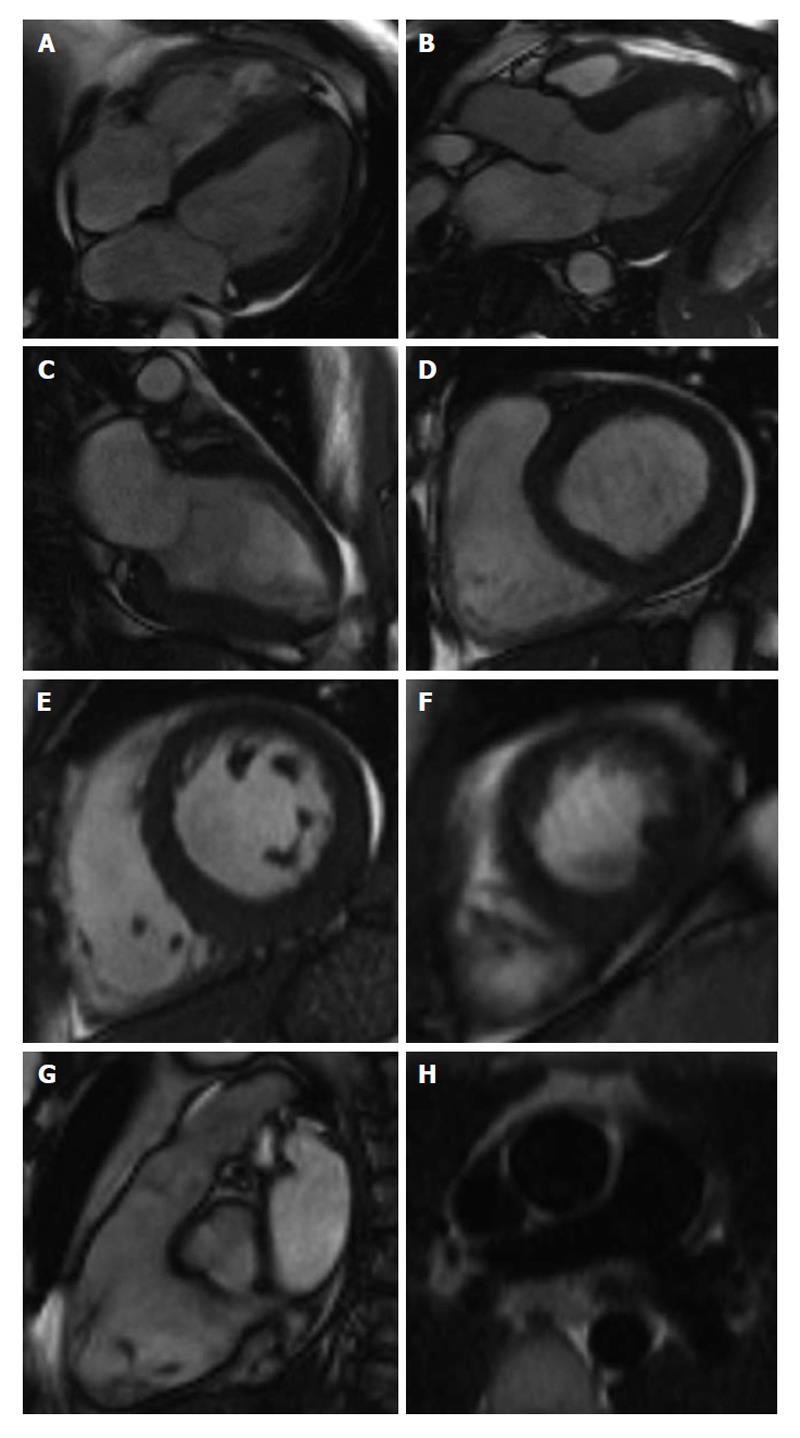
Figure 3 Standard imaging technique showing cine magnetic resonance imaging long axis views (A-C) and followed by short axis (D-F) and RVOT (G).
Half-Fourier acquisition single-shot turbo spin-echo image shows the main, left and right pulmonary arteries (H).
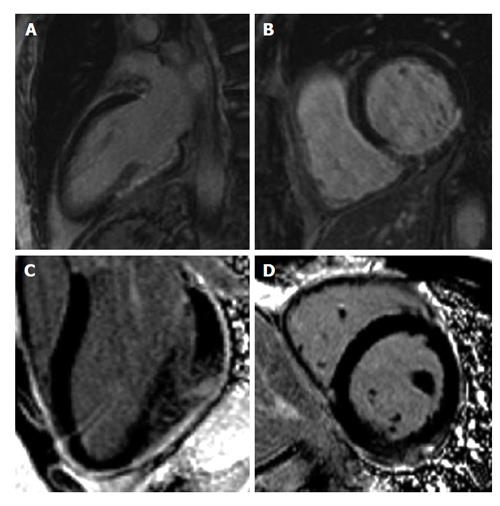
Figure 4 Late gadolinium enhancement showing two distinct hyperenhancement patterns.
Subendo cardial for myocardial infarction (A and B) and epicardial for myocarditis (C and D).
- Citation: Azarisman SM, Teo KS, Worthley MI, Worthley SG. Role of cardiovascular magnetic resonance in assessment of acute coronary syndrome. World J Cardiol 2014; 6(6): 405-414
- URL: https://www.wjgnet.com/1949-8462/full/v6/i6/405.htm
- DOI: https://dx.doi.org/10.4330/wjc.v6.i6.405


