Copyright
©2014 Baishideng Publishing Group Inc.
World J Cardiol. Nov 26, 2014; 6(11): 1192-1208
Published online Nov 26, 2014. doi: 10.4330/wjc.v6.i11.1192
Published online Nov 26, 2014. doi: 10.4330/wjc.v6.i11.1192
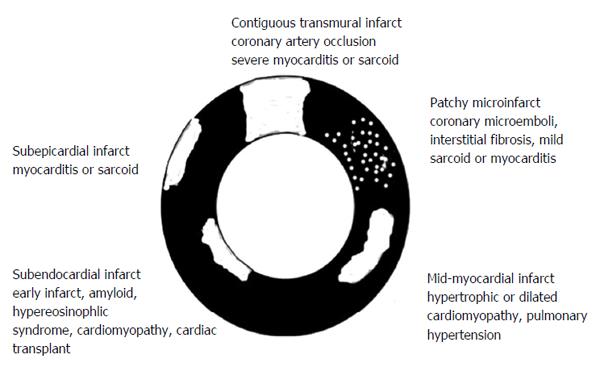
Figure 1 Schematic presentation of various types (patchy and contiguous) and locations (epicardium, midmyocardium and endocardiu) of myocardial infarct in different cardiac diseases.
In acute myocardial infarct > 30% of the patients have a hypoenhanced microvascular zone in the core of contiguous infarct. Reactive interstitial fibrosis is seen in hypertension, valvular, diabetic and genetic diseases as well as aging, while infiltrative interstitial fibrosis is evident in amyloidosis and Anderson-Fabry disease. The replacement of myocardium with scar tissue is seen in inflammatory disease, chronic ischemia/coronary occlusion (contiguous), chronic renal insufficiency (patchy) and genetic and toxic diseases.
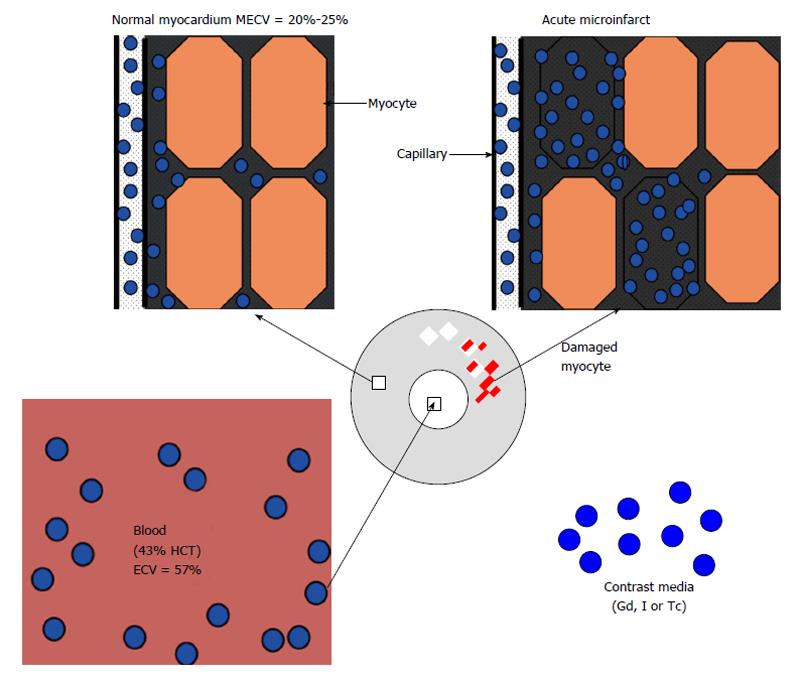
Figure 2 The three fluid compartments in healthy myocardium, namely intravascular (approximately 10% of tissue volume), interstitial (approximately 15%) and intracellular (approximately 75%) compartments.
ECV: Extracellular volume; HCT: Hematocrit; Gd: Gadolinium; I: Iodine; Tc: Technetium; MECV: Myocardial extracellular volume.
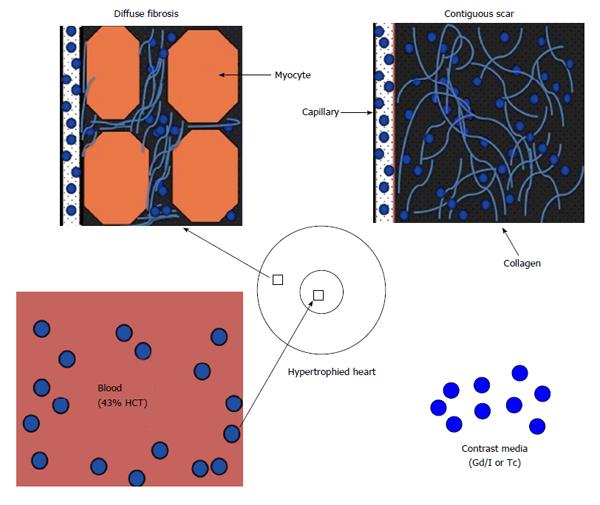
Figure 3 Schematic presentation of diffuse myocardial fibrosis in non-ischemic heart diseases (left) and contiguous chronic infarct (right) in ischemic heart disease.
HCT: Hematocrit; Gd: Gadolinium; I: Iodine; Tc: Technetium.
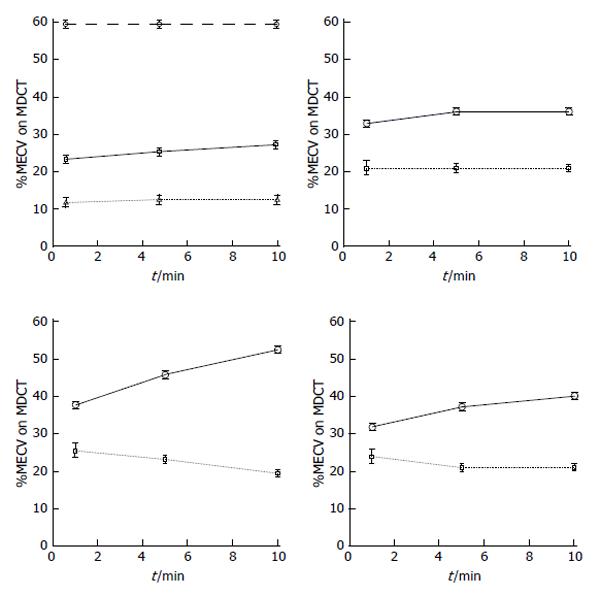
Figure 4 The top left plot shows the time course of equilibrium state of iodinated contrast media distribution in the extracellular volume of the blood (dashed line), healthy myocardium (solid line) and skeletal muscle (dotted line) over the course of 10 min using multi-detector computed tomography.
The plots also demonstrate the remarkable difference in myocardial extracellular volume (MECV) in regions subjected to different insults. Differential increase in ECV was observed in ischemic myocardium after microembolization using 16 mm3 (top right), 32 mm3 (bottom left) or 90 min left anterior descending coronary artery occlusion/reperfusion (bottom right) compared with undamaged remote myocardium in all groups (dotted lines). MDCT: Multi-detector computed tomography.
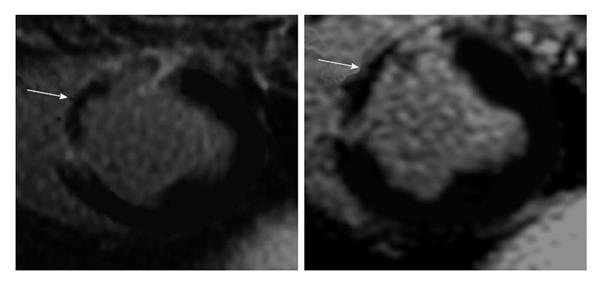
Figure 5 Delayed contrast enhanced magnetic resonance imaging of acute reperfused myocardial infarction (3 d) showing the hyperenhanced infarct and microvascular obstruction (arrows).
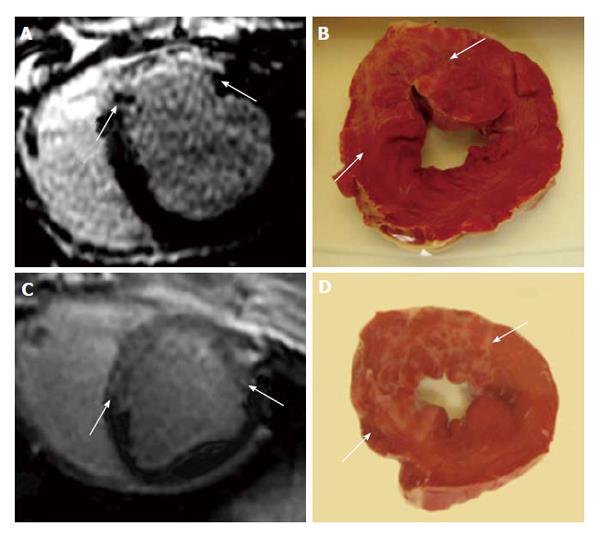
Figure 6 Delayed contrast enhanced magnetic resonance imaging (A and C) and histochemical triphenyltetrazplium chloride stain (B and D) show patchy microinfarct (arrows) 3 d after delivering 16 mm3 (A and C) and 32 mm3 (B and D) microemboli in the LAD coronary artery in a swine model.
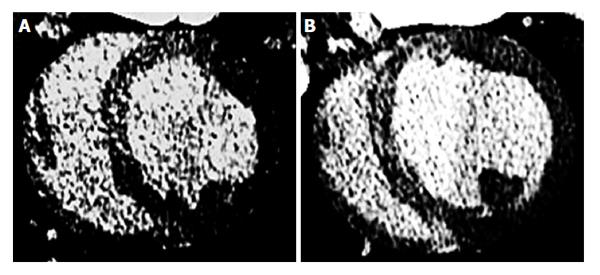
Figure 7 Delayed contrast enhanced multi-detector computed tomography 3 d after microembolization using 16 mm3 (A) and 32 mm3 (B) microemboli.
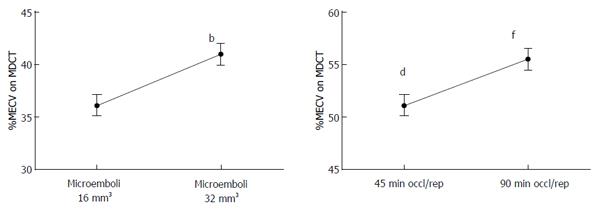
Figure 8 Gradient increase in myocardial extracellular volume as a function of microemboli volume (16 mm3vs 32 mm3) and left anterior descending coronary artery occlusion time (45 min vs 90 min).
bP < 0.01 vs 16 mm3, dP < 0.01 vs 32 mm3 and fP < 0.01 vs 45 min left anterior descending coronary artery occlusion/reperfusion. MECV: Myocardial extracellular volume; MDCT: Multi-detector computed tomography.
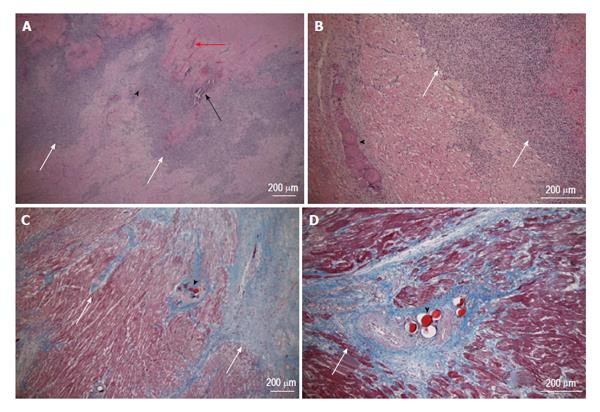
Figure 9 Acute (top row, hematoxylin and eosin stain) and chronic (bottom row, Masson trichrome stain) patchy microinfarct (white arrows) and microemboli (black arrowhead) distribution between viable myocardium at 3 d and 5 wk after embolization, respectively.
Intramyocardial hemorrhage (red arrow) and calcium deposition (black arrow) are evident at 3 d on HE stain, but not at 5 wk. The magnifications are 40 × (A and C) and 100 × (B and D).
- Citation: Saeed M, Hetts SW, Jablonowski R, Wilson MW. Magnetic resonance imaging and multi-detector computed tomography assessment of extracellular compartment in ischemic and non-ischemic myocardial pathologies. World J Cardiol 2014; 6(11): 1192-1208
- URL: https://www.wjgnet.com/1949-8462/full/v6/i11/1192.htm
- DOI: https://dx.doi.org/10.4330/wjc.v6.i11.1192


