Copyright
©2014 Baishideng Publishing Group Inc.
World J Cardiol. Nov 26, 2014; 6(11): 1166-1174
Published online Nov 26, 2014. doi: 10.4330/wjc.v6.i11.1166
Published online Nov 26, 2014. doi: 10.4330/wjc.v6.i11.1166
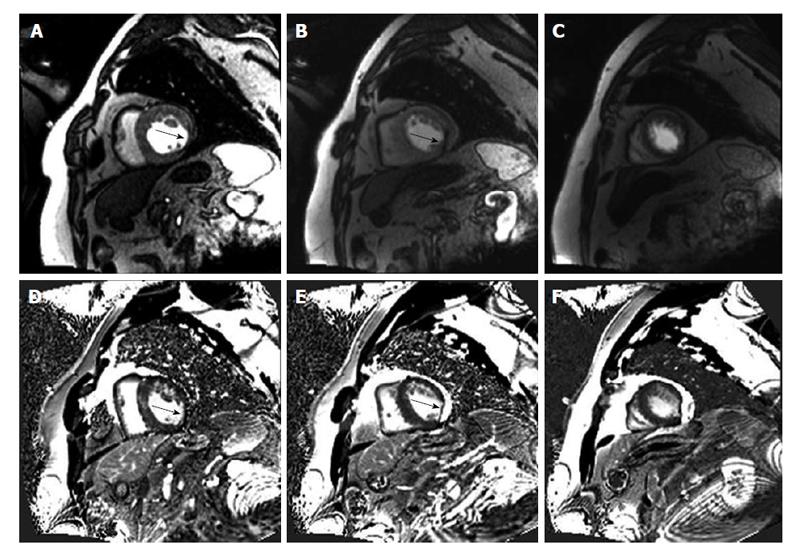
Figure 1 Patient presenting with an subacute non-ST-segment elevation infarction.
Cardiovascular magnetic resonance (CMR) images of a 54-year-old man who presented with typical chest pain. Troponin was elevated to 1.9 μg/L. CMR rest perfusion (A-C) shows a subendocardial perfusion deficit inferolateral and lateral on the basal (A) and midventricular (B) short axis slice. The black arrow highlights the subendocardial perfusion deficit. Late gadolinium enhancement (D-F) of the representative short axis also revealed a hyperenhancement inferolateral and lateral (black arrow) indicative of a subacute myocardial infarction.
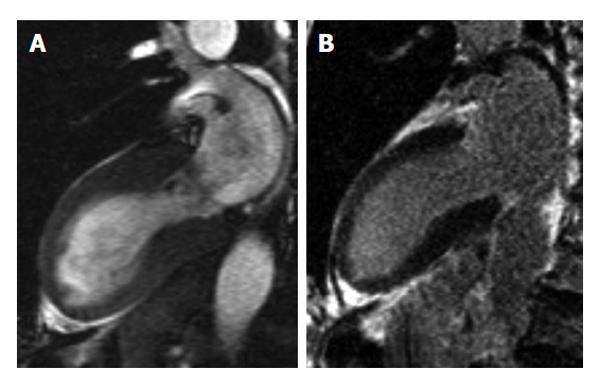
Figure 2 Patient with takotsubo cardiomyopathy.
Example of a 45-year-old woman presenting with acute chest pain, anterior ST-segment elevation on electrocardiogram. Cardiovascular magnetic resonance cine images of showed a typical apical ballonning of the left ventricle (A). Late gadolinium enhancement images (B) could rule out myocardial infarction and did not show any fibrosis.
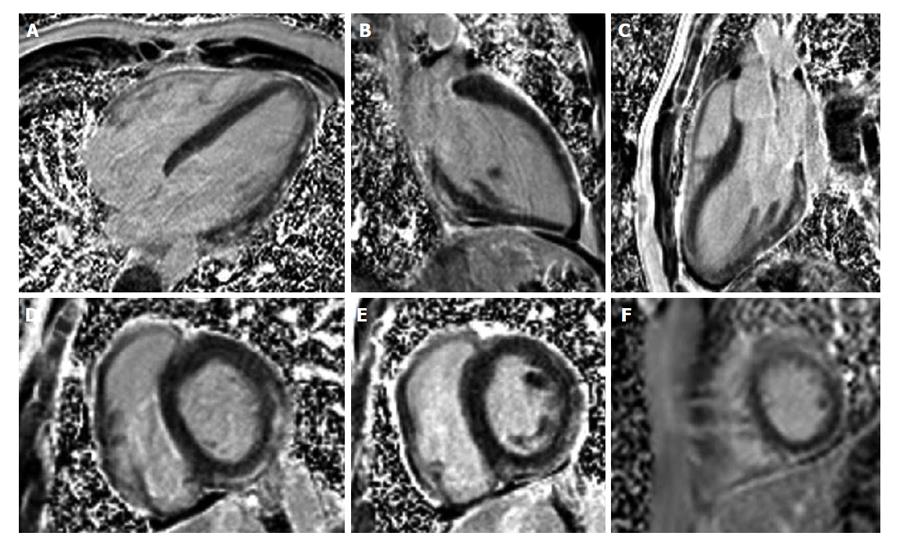
Figure 3 Patient with acute chest pain due to myocarditis.
A 16-year-old boy who presented with acute chest pain and palpitations 1 wk after a gastrointestinal infection. Troponin was 2.4 μg/L. Late gadolinium enhancement cardiovascular magnetic resonance showed a patchy midmyocardial and epicardial hyperenhancement of the lateral, anterior and inferior wall. These findings are typical of acute myocarditis.
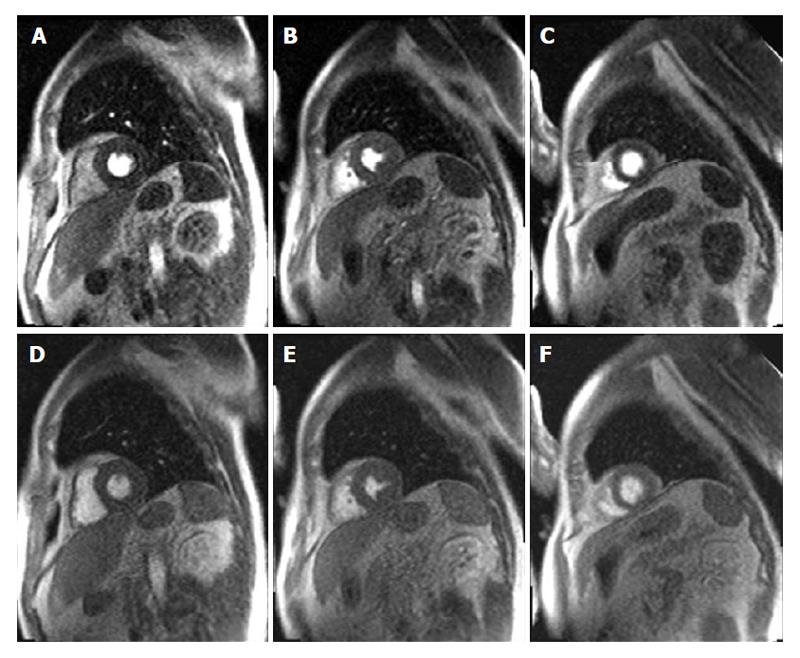
Figure 4 Adenosine stress perfusion imaging.
A 63-year-old patient who presented with stable angina for more than 6 mo. Adenosine stress (A-C) vs rest perfusion (D-F) revealed myocardial ischemia only during stress perfusion of the basal inferior and lateral as well as midventriucular inferoseptal wall. The patient did not show a late gadolinium enhancement. Coronary angiography showed a 60% stenosis of the medial right coronary artery that was treated with percutaneous coronary intervention and stent implantation due to the detected ischemia.
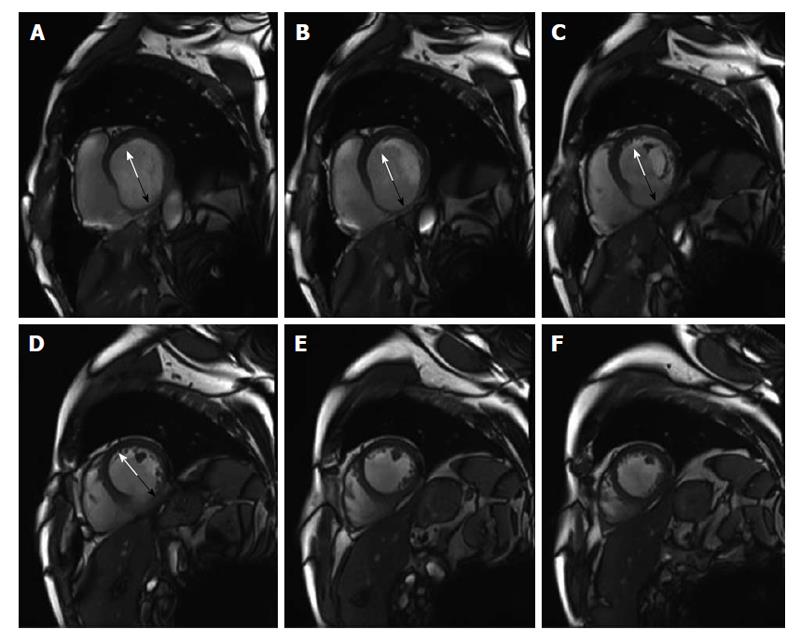
Figure 5 End diastolic wall thickness.
Representative end diastolic short axis images from basal (A) to apical (F) of a patient with previous inferior myocardial infarction. The anterior, septal and lateral region (white arrow, A-D) show a preserved end diastolic wall thickness (EDWT) > 6 mm suggesting viable myocardium, whereas EDWT of the inferior wall (black arrow, A-D) is ≤ 6 mm indicating myocardial scarring.
Figure 6 Late gadolinium enhancement imaging.
Representative late gadolinium enhancement images of patients without scar (A), with a transmural extent of hyperenhancement of 1%-15% (B), 26%-50% (C), 51%-75% (D) and more than 75% (E) and the respective percentage of improved contractility according the study by Kim et al[51].
- Citation: Doesch C, Papavassiliu T. Diagnosis and management of ischemic cardiomyopathy: Role of cardiovascular magnetic resonance imaging. World J Cardiol 2014; 6(11): 1166-1174
- URL: https://www.wjgnet.com/1949-8462/full/v6/i11/1166.htm
- DOI: https://dx.doi.org/10.4330/wjc.v6.i11.1166


