Copyright
©2013 Baishideng Publishing Group Co.
World J Cardiol. Jul 26, 2013; 5(7): 265-269
Published online Jul 26, 2013. doi: 10.4330/wjc.v5.i7.265
Published online Jul 26, 2013. doi: 10.4330/wjc.v5.i7.265
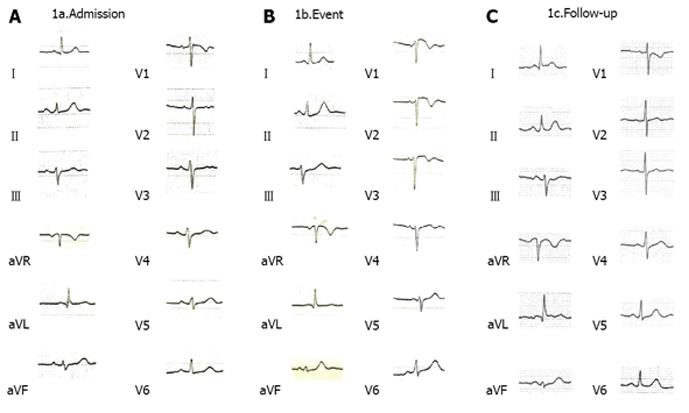
Figure 1 The electrocardiogram.
A: A 12-lead standard electrocardiogram (ECG) of the patient at hospital admission; B: At 10th day after admission. An ST elevation in leads V1-V2 and T-wave abnormalities can be noted; C: In the repeat ECG, all changes noted in the abnormal ECG have resolved, as can be noted.
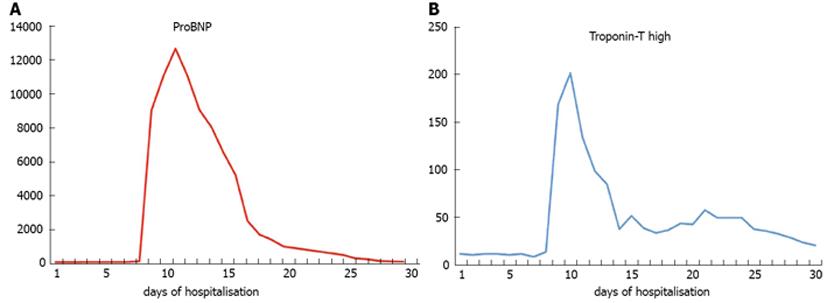
Figure 2 The frequency of such episodes of chest pain was increased.
A: ProBNP; B: Troponin-T. ProBNP, troponin-T high levels during clinical presentation of patient’s symptomatology. In Y axis, both ProBNP and troponin are measured in pg/mL (normal values; ProBNP < 150 pg/mL, troponine < 14150 pg/mL).
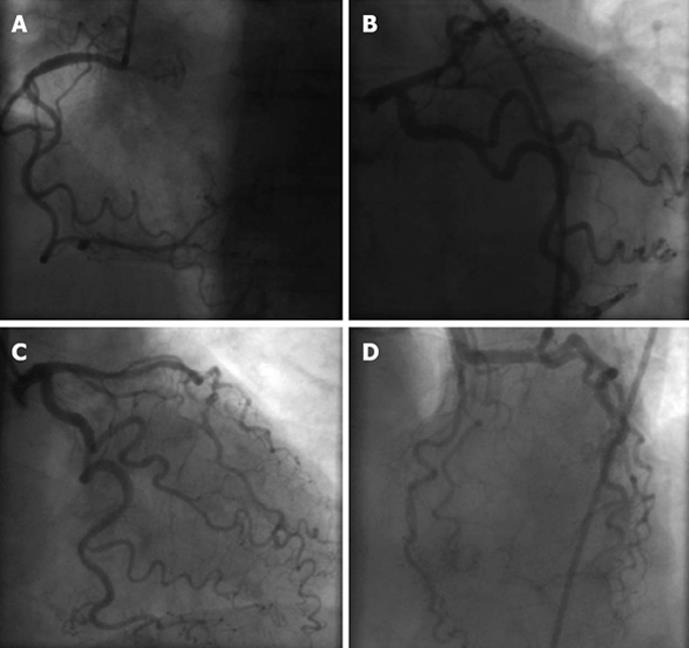
Figure 3 A normal coronary angiography performed at the patient.
A: Right coronarogram; B: Left coronarogram; C: Left coronary artery-right anterior oblique; D: Left coronary artery-left anterior oblique.
- Citation: Zis P, Dimopoulos S, Markaki V, Tavernarakis A, Nanas S. Non-coronary myocardial infarction in myasthenia gravis: Case report and review of the literature. World J Cardiol 2013; 5(7): 265-269
- URL: https://www.wjgnet.com/1949-8462/full/v5/i7/265.htm
- DOI: https://dx.doi.org/10.4330/wjc.v5.i7.265


