Copyright
©2013 Baishideng Publishing Group Co.
World J Cardiol. Jul 26, 2013; 5(7): 258-260
Published online Jul 26, 2013. doi: 10.4330/wjc.v5.i7.258
Published online Jul 26, 2013. doi: 10.4330/wjc.v5.i7.258
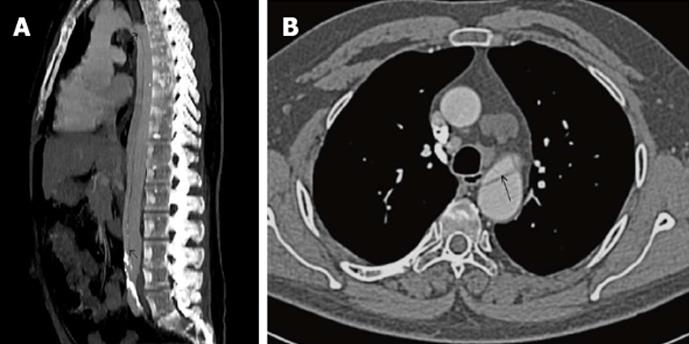
Figure 1 Computed tomography aorta.
A: Sagittal view; B: Transverse view. Computed tomography aorta showing the chronic aortic dissection extending from the upper descending aorta down to the abdominal aorta. Arrows indicate dissection flap entry and exit points (A) and flap (B).
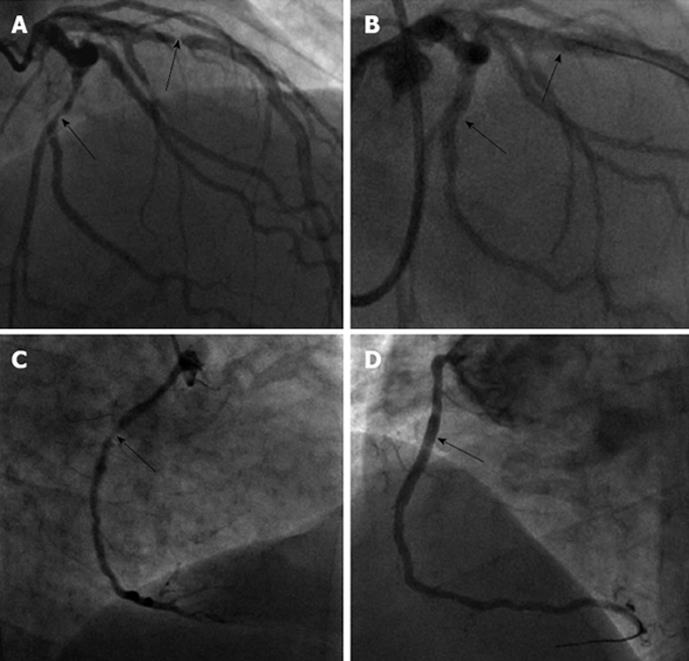
Figure 2 Coronary angiogram image.
A: Lesions in left anterior descending (LAD), left circumflex (LCx). Coronary angiogram image showing severe lesions in LAD and LCx arteries (arrows); B: Percutaneous coronary intervention to LAD and LCx. Post-percutaneous coronary intervention (PCI) images showing successful PCI to lesions in LAD and LCx (arrows); C: Lesion in right coronary artery (RCA). Coronary angiogram image showing tight lesion in RCA (arrow); D: PCI to RCA. Successful PCI to RCA with a DES (arrow).
- Citation: Hamid T, Choudhury TR, Fraser D. Multi-vessel percutaneous coronary intervention in a patient with a type B aortic dissection-transradial or transfemoral? World J Cardiol 2013; 5(7): 258-260
- URL: https://www.wjgnet.com/1949-8462/full/v5/i7/258.htm
- DOI: https://dx.doi.org/10.4330/wjc.v5.i7.258


