Copyright
©2013 Baishideng Publishing Group Co.
World J Cardiol. Jun 26, 2013; 5(6): 196-206
Published online Jun 26, 2013. doi: 10.4330/wjc.v5.i6.196
Published online Jun 26, 2013. doi: 10.4330/wjc.v5.i6.196
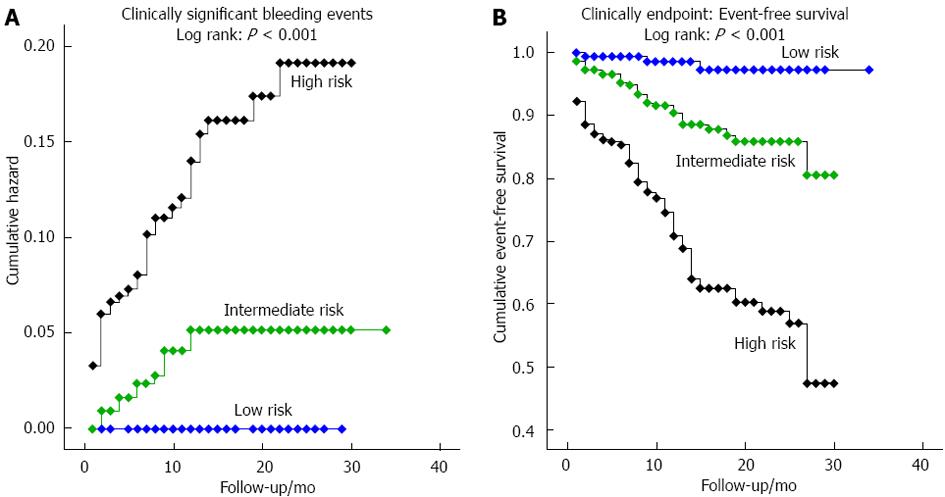
Figure 1 Kaplan-Meier curves illustrating.
A: The occurrence of significant bleeding events during follow-up in the validation sample according to risk-group stratification; B: Event-free survival in the validation sample according to risk-group stratification.
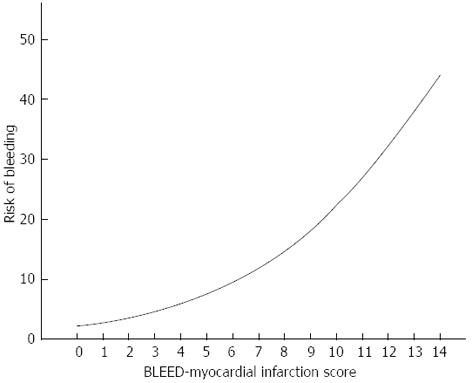
Figure 2 Curvilinear change in expected risk of bleeding with increasing BLEED-myocardial infarction scores (Table 5 illustrates the actual risk of bleeding with increasing BLEED-myocardial infarction scores).
- Citation: Barra S, Providência R, Caetano F, Almeida I, Paiva L, Dinis P, Leitão Marques A. BLEED-Myocardial Infarction Score: Predicting mid-term post-discharge bleeding events. World J Cardiol 2013; 5(6): 196-206
- URL: https://www.wjgnet.com/1949-8462/full/v5/i6/196.htm
- DOI: https://dx.doi.org/10.4330/wjc.v5.i6.196


