Copyright
©2013 Baishideng Publishing Group Co.
Figure 1 A 64-year-old male was admitted at our hospital because of progressive angina.
A: Coronary angiogram demonstrated a complex stenosis in the mid segment of the circumflex coronary artery; B-F: Optical coherence tomography revealed a large complex thin-cap fibroatheroma (arrows) proximal and at the site of the stenosis. The fibrous cap covering the lipid rich plaque had a variable thickness and in its thinnest part measured 55 μm (arrows in D). Distally, the same plaque had large lipidic core and an image compatible with a rupture site (*) (E). Please note that residual lining red thrombus with a clear dorsal shadowing was also detected at some sites (+). Finally, at the most severe site (F), a fibrous plaque was noted.
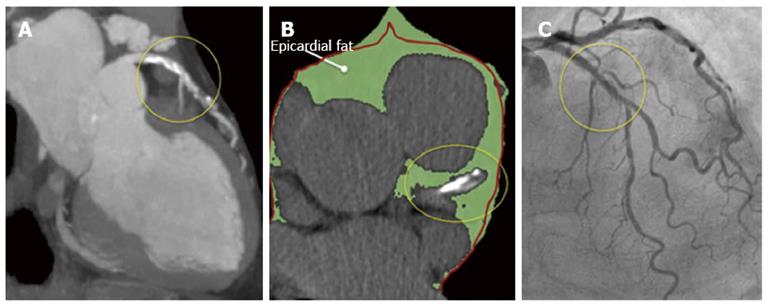
Figure 2 A multislice computed tomography was performed in a 68-year old male because of atypical chest pain.
A: This study revealed a long mixed, calcific and non-calcific plaque in the proximal and mid segments of the left anterior descending artery; B: A large amount of epicardial adipose tissue (EAT) [(159.2 cm3 (green) (figure 3)] was also calculated. Please note that the left anterior descending artery is embedded in EAT (yellow circles). The red line represents the pericardium; C: A coronary angiogram was scheduled and revealed intermediate stenoses in the same arterial segment that was subsequently studied with optical coherence tomography.
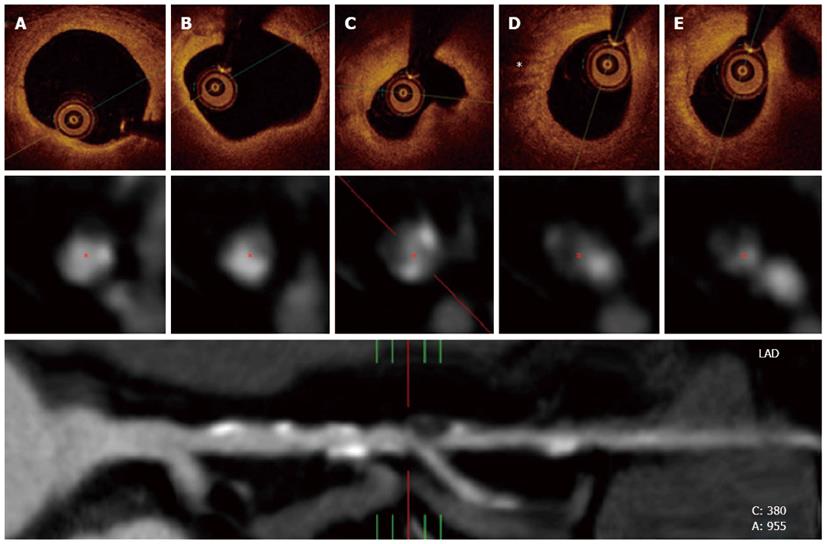
Figure 3 Optical coherence tomography and multislice computed tomography findings of the same patient in figure 2.
A and B: In the upper panel, optical coherence tomography revealed a complex plaque affecting a long portion of the vessel with calcified and lipidic regions; C: Also, a complex fibroatheroma that included a lipidic core was observed at the site of the most severe stenosis; D: A high light attenuation band with distal shadowing can be attributed to macrophage infiltration (*). The middle panel represents cross-sectional views of the vessel at the same stenosis as visualized by multislice computed tomography (MSCT). Calcified and non-calcified regions including eccentric plaques were found within the diseased segment. The inferior panel shows a MSCT multiplanar reconstruction of the vessel and its anatomical bookmarks.
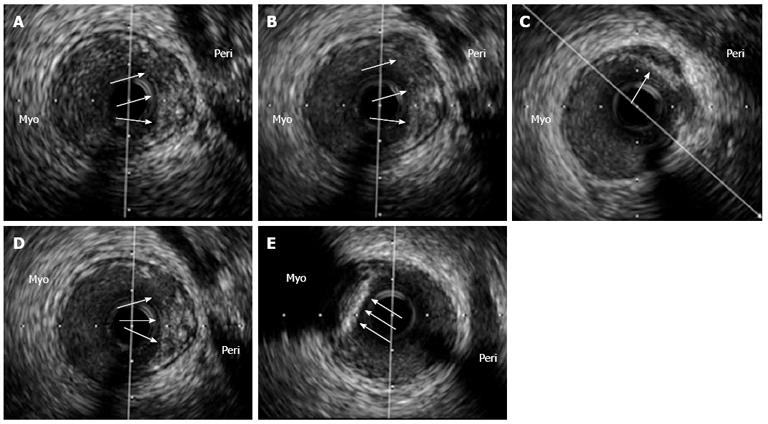
Figure 4 An intravascular ultrasound analysis of the left anterior descending coronary artery in an asymptomatic patient with a previously deployed stent (not shown) that underwent this study as part of an institutional protocol.
A-D: In the pericardial side (Peri) of the vessel, an eccentric and positively remodeled plaque with heterogenic echo-reflection that included a hypoechogenic area, suggestive of a potentially “high risk” plaque, was found (arrows); E: Interestingly, just adjacently and in the opposite vessel side [myocardial side (Myo)], a calcified plaque with intense posterior shadowing, highly suggestive of a stable fibro-calcific plaque (arrows), was also observed. The patient has been asymptomatic during a 3-year clinical follow-up.
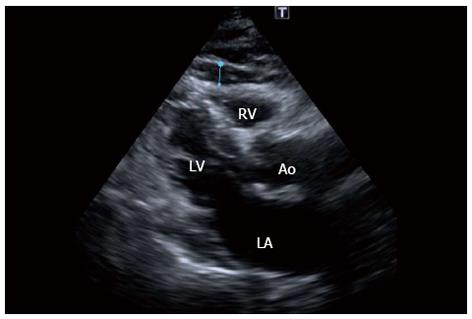
Figure 5 Echocardiogram in the parasternal long-axis view revealing a large amount of epicardial fat (thickness of 6 mm) over the free wall of the right ventricle (blue line) of the patient in figure 1.
RV: Right ventricle, LV: Left ventricle, LA: Left atrium; Ao: Aortic root.
- Citation: Echavarría-Pinto M, Hernando L, Alfonso F. From the epicardial adipose tissue to vulnerable coronary plaques. World J Cardiol 2013; 5(4): 68-74
- URL: https://www.wjgnet.com/1949-8462/full/v5/i4/68.htm
- DOI: https://dx.doi.org/10.4330/wjc.v5.i4.68


