Copyright
©2013 Baishideng Publishing Group Co.
World J Cardiol. Dec 26, 2013; 5(12): 444-452
Published online Dec 26, 2013. doi: 10.4330/wjc.v5.i12.444
Published online Dec 26, 2013. doi: 10.4330/wjc.v5.i12.444
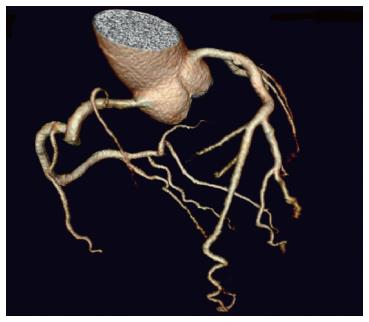
Figure 1 3D volume rendering shows normal right and left coronary arteries with excellent demonstration of main and side branches.
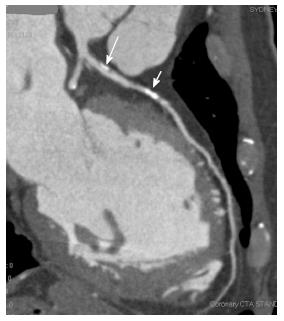
Figure 2 Curved planar reformation image shows significant stenosis of the left anterior descending coronary artery due to presence of plaques.
The long arrow refers to the mixed plaque at the proximal segment of left left anterior descending (LAD), while the short arrow points to the calcified plaque at the proximal segment of LAD.
Figure 3 Characterization of coronary plaques on coronary computed tomography angiography.
Coronal maximum intensity projection shows a calcified plaque (A, arrow) at the proximal segment of left coronary artery. A non-calcified plaque is present at the mid-segment of right coronary artery (B, arrow) on a curved planar reformation image. A mixed plaque is present at the proximal segment of right coronary artery (C, arrows) on a curved planar reformation image.
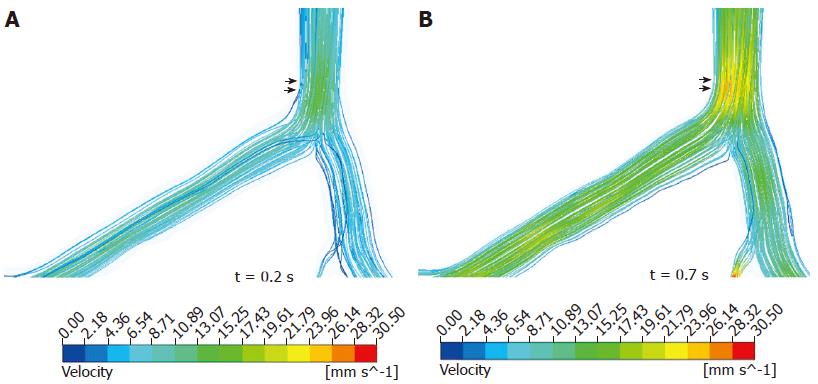
Figure 4 Local impact of flow velocity observed in a normal coronary model during systolic phase of 0.
2 s (A) and diastolic phase of 0.7 s (B). Double arrows reveal high flow velocity locations at bifurcation in the left coronary artery model.
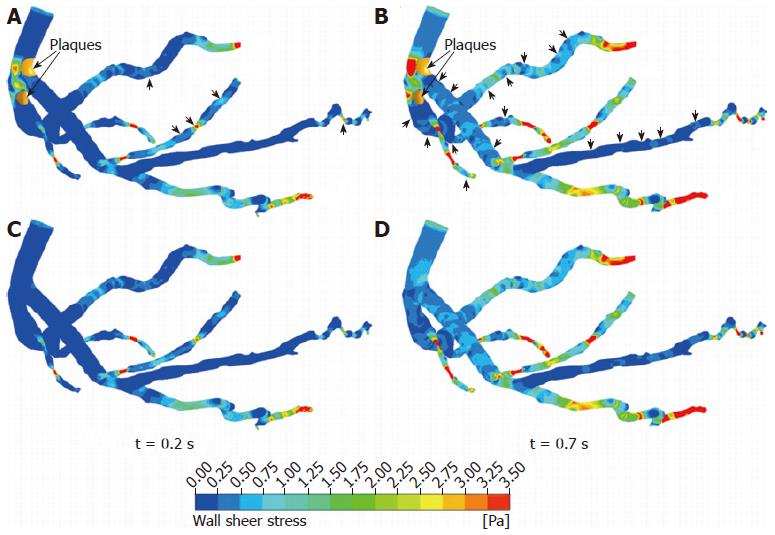
Figure 5 Computational fluid dynamics analysis of wall shear stress in 3D realistic models generated from coronary computed tomography angiography during systolic phase of 0.
2 s and diastolic phase of 0.7 s. A, B: Coronary models with presence of plaques in the left anterior descending; C, D: Computational fluid dynamics analysis simulation in coronary models without presence of plaques. Arrows indicate the effect of plaques locations on wall shear stress changes in coronary side branches in the post-plaques-conditions.
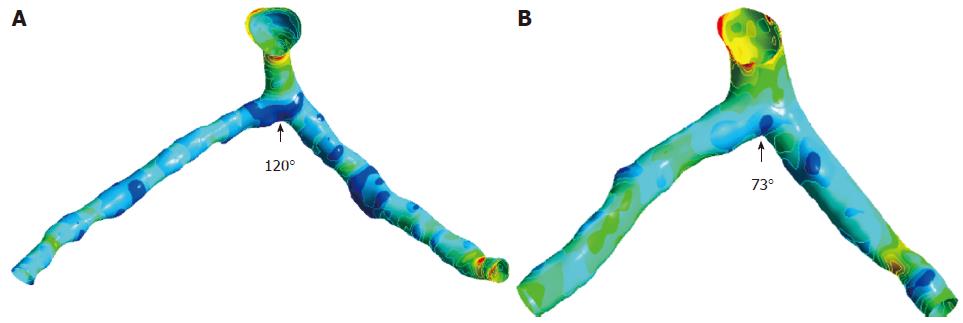
Figure 6 Wall shear stress gradient observed with different angles of the realistic left coronary artery models generated from coronary computed tomography angiography at peak systolic phase of 0.
4 s. The arrows display the wall shear stress gradient distributions, with a large region of the low magnitude present at present at a 120° model (A) and a small region at a 73° model (B).
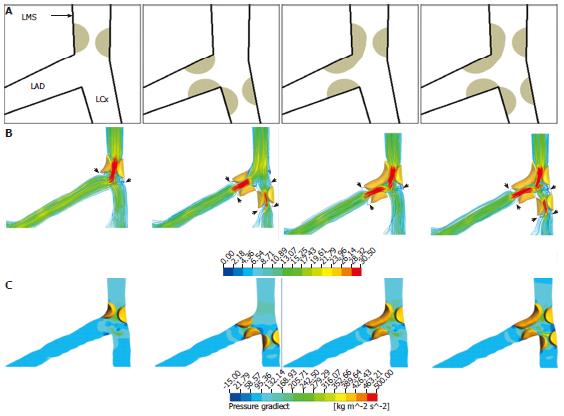
Figure 7 Computational fluid dynamics simulation of left coronary models with measurement of flow velocity and pressure gradient.
A: Diagram shows characterization of the four different types of bifurcation plaques in the left coronary artery; B: The velocity patterns inside left bifurcation at effective plaque locations with these types of bifurcation plaques during the diastolic phase (0.7 s); C: The pressure gradient patterns inside left bifurcation at plaque locations with different types of bifurcation plaques during the systolic phase (0.2 s) (C). Arrows refer to the flow changes in the location of plaques. It is noticed that high velocity and high pressure gradient are present in the models with more plaques formed in the left coronary artery branches. LMS: Left main stem; LAD: Left anterior descending; LCx: Left circumflex.
- Citation: Sun Z. Coronary CT angiography: Beyond morphological stenosis analysis. World J Cardiol 2013; 5(12): 444-452
- URL: https://www.wjgnet.com/1949-8462/full/v5/i12/444.htm
- DOI: https://dx.doi.org/10.4330/wjc.v5.i12.444


