Copyright
©2013 Baishideng Publishing Group Co.
World J Cardiol. Nov 26, 2013; 5(11): 404-409
Published online Nov 26, 2013. doi: 10.4330/wjc.v5.i11.404
Published online Nov 26, 2013. doi: 10.4330/wjc.v5.i11.404
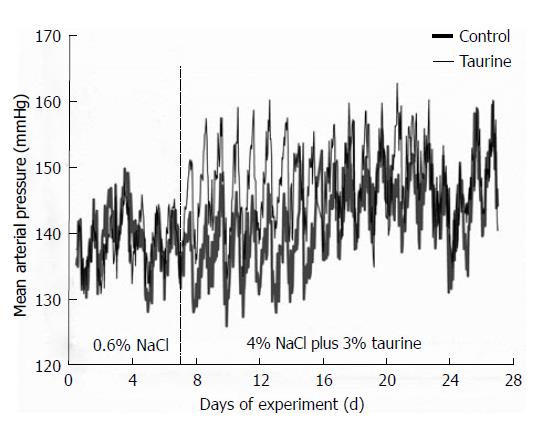
Figure 1 Group average, mean arterial pressures in control (thick line) and taurine (thin line) groups.
The values were averaged from seven (control) and twelve (taurine) rats and the standard errors of means were not included to avoid confusion. Significant differences between groups (P < 0.05 by one-way analysis of variance and post hoc Duncan’s multiple range test) were consistently observed in nighttime but not daytime mean arterial pressures from day 1 to day 9 of high salt treatment. The vertical dashed line at day 7 indicates the day that the high NaCl diet and taurine supplementation began.
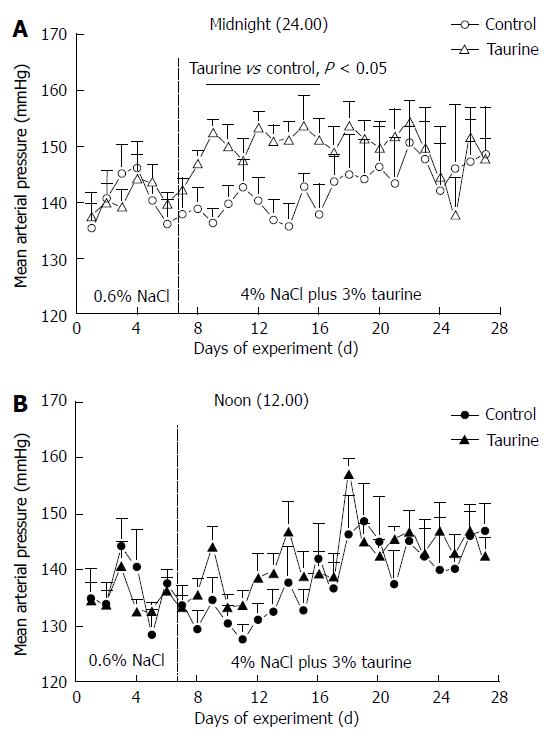
Figure 2 Group averages of mean arterial pressure in control (n = 7) and taurine (n = 12) treated groups at midnight (A) and at noon (B).
The daytime mean arterial pressures were not significantly different between groups throughout the study. The vertical dashed line at day 7 indicates the day that the high NaCl diet and taurine supplementation began. Statistical comparisons were performed by one-way analysis of variance and post hoc Duncan’s multiple range test.
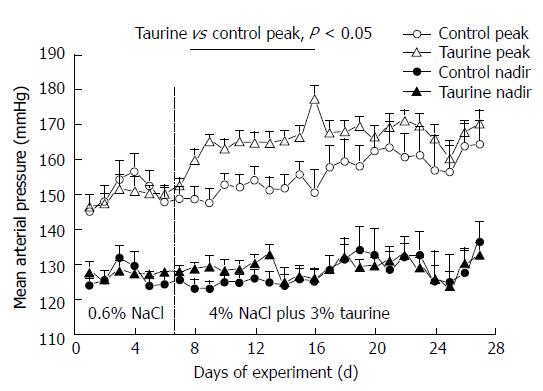
Figure 3 Peak (open symbols) and nadir (closed symbols) mean arterial pressures in control (n = 7) and taurine treated (n = 12) groups.
The vertical dashed line at day 7 indicates the day that the high NaCl diet and taurine supplementation began. Statistical comparisons were performed by one-way analysis of variance and post hoc Duncan’s multiple range test.
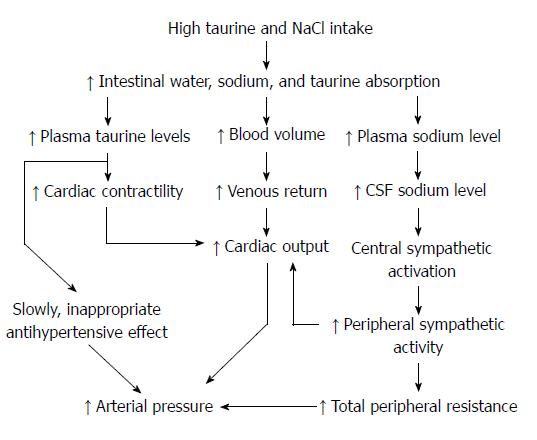
Figure 4 Possible pathways explaining the nighttime increase in arterial pressure after a combination of taurine supplementation and high salt diet in spontaneously hypertensive rats.
CSF: Cerebrospinal fluid.
- Citation: Suwanich A, Wyss JM, Roysommuti S. Taurine supplementation in spontaneously hypertensive rats: Advantages and limitations for human applications. World J Cardiol 2013; 5(11): 404-409
- URL: https://www.wjgnet.com/1949-8462/full/v5/i11/404.htm
- DOI: https://dx.doi.org/10.4330/wjc.v5.i11.404


