Copyright
©2012 Baishideng Publishing Group Co.
World J Cardiol. Aug 26, 2012; 4(8): 260-263
Published online Aug 26, 2012. doi: 10.4330/wjc.v4.i8.260
Published online Aug 26, 2012. doi: 10.4330/wjc.v4.i8.260
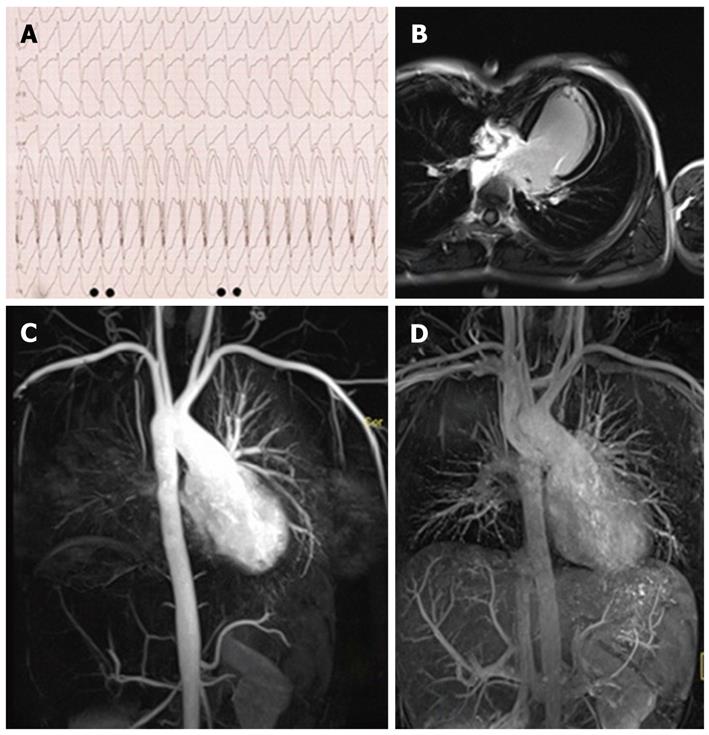
Figure 1 Wide complex tachycardia.
A: Electrocardiographic findings in the emergency room; B: Long-axis late gadolinium enhancement view, main chamber and one outflow tract; C: Magnetic resonance (MR) angiography, arterial phase [maximum intensity projection (MIP)]; D: MR-angiography, venous phase (MIP).
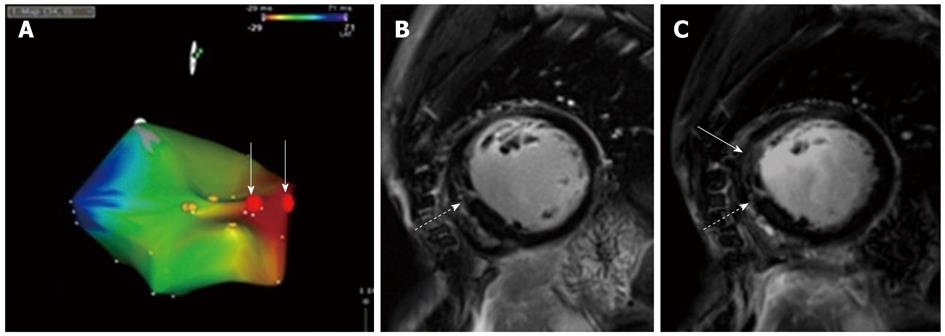
Figure 2 Tachycardia origin and post-ablation scan.
A: Carto3. Yellow: His Bundle; red: area of earliest activation; red dots marked by white arrows: ablation sites; B: Short axis ate gadolinium enhancement (LGE) prior to ablation with no areas indicating scars. Note area of the septal patch (white arrow); C: Short axis LGE post-ablation: the ablation lesion is close to the area of the septal patch (white arrow).
- Citation: Reiter T, Ritter O, Nordbeck P, Beer M, Bauer WR. MRI-guided ablation of wide complex tachycardia in a univentricular heart. World J Cardiol 2012; 4(8): 260-263
- URL: https://www.wjgnet.com/1949-8462/full/v4/i8/260.htm
- DOI: https://dx.doi.org/10.4330/wjc.v4.i8.260


