Copyright
©2011 Baishideng Publishing Group Co.
World J Cardiol. Sep 26, 2011; 3(9): 303-310
Published online Sep 26, 2011. doi: 10.4330/wjc.v3.i9.303
Published online Sep 26, 2011. doi: 10.4330/wjc.v3.i9.303
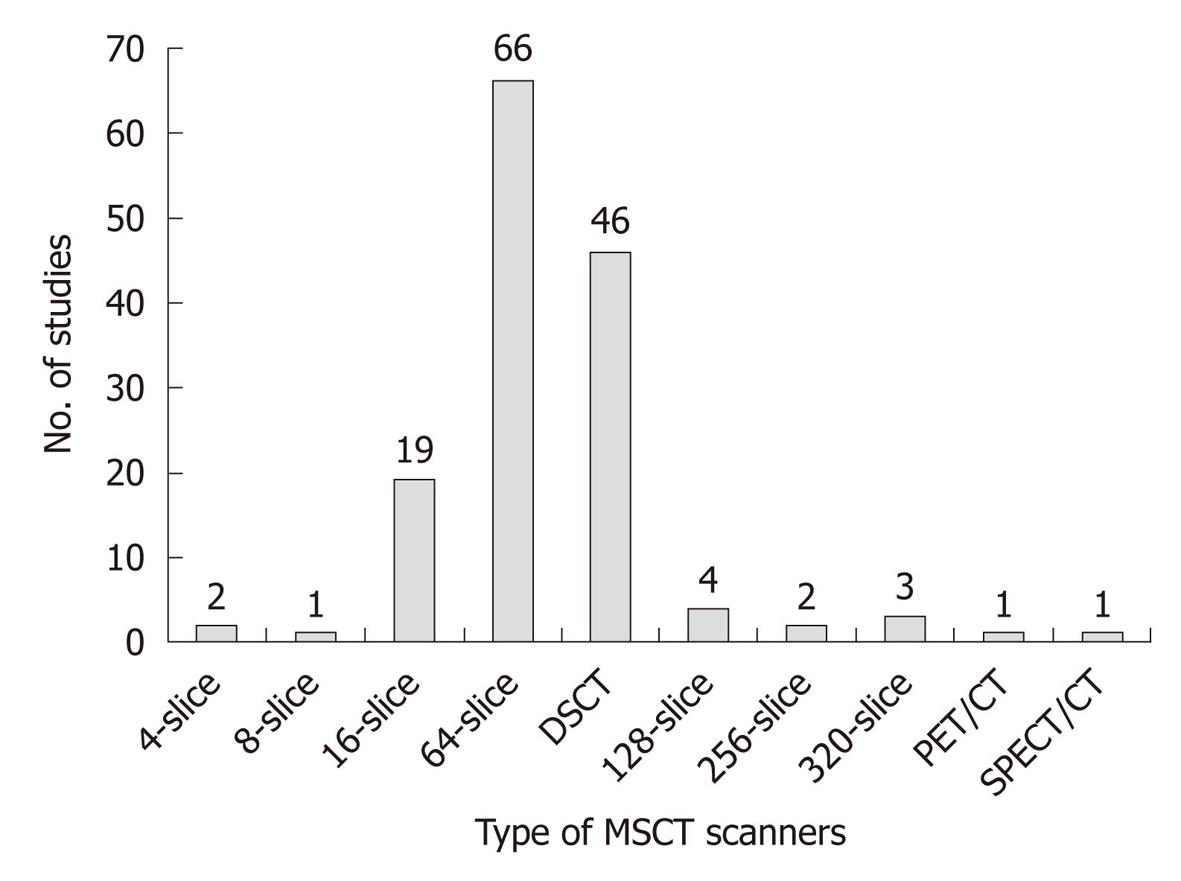
Figure 1 The number of studies performed with different generations of multislice computed tomography scanners.
CT: Computed tomography; DSCT: Dual-source CT; MSCT: Multislice CT; PET: Positron emission tomography; SPECT: Single photon emission computed tomography.
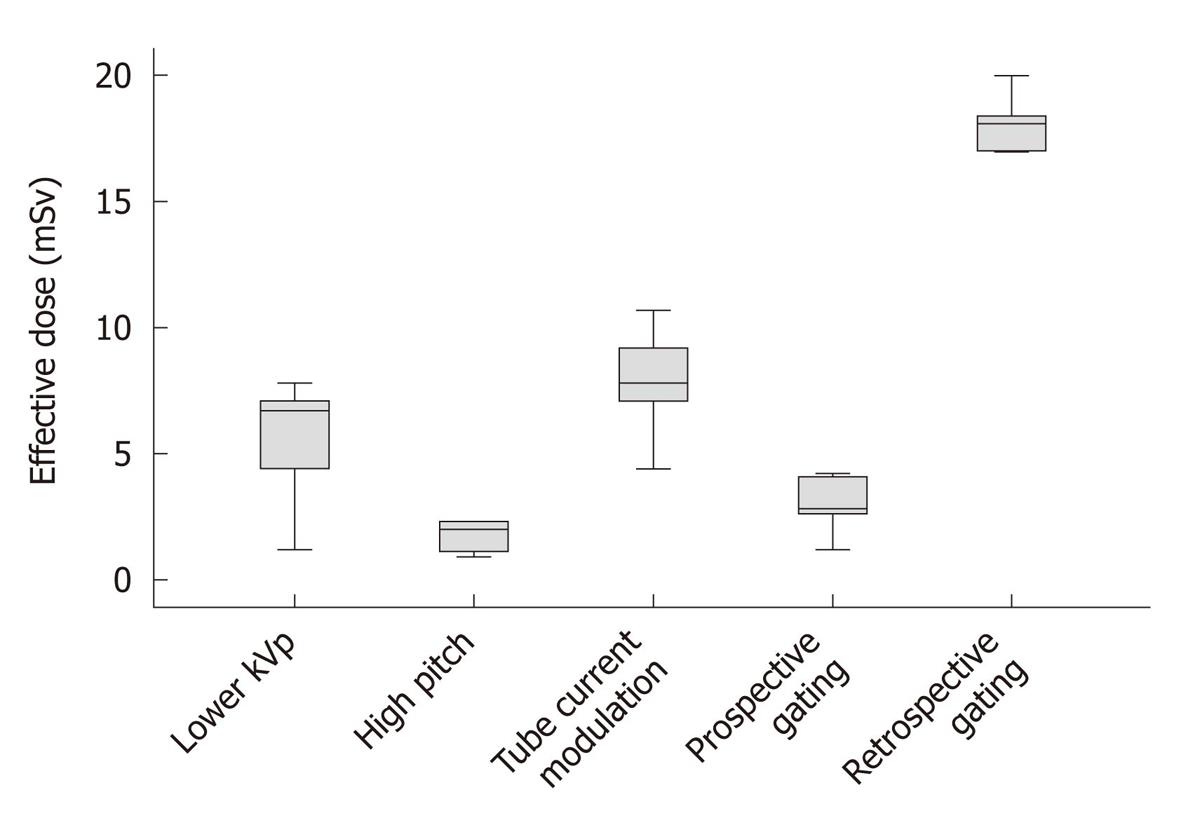
Figure 2 Box plot shows the mean effective dose associated with different dose-reduction techniques.
Coronary computed tomography angiography with the use of high pitch and prospective electrocardiography-triggering leads to the lowest radiation dose. The boxes indicate the first to third quartiles, and each midline indicates the median (second quartile) and the whiskers represent the maximum and minimum values of effective dose.
- Citation: Sun Z, Ng KH. Coronary computed tomography angiography in coronary artery disease. World J Cardiol 2011; 3(9): 303-310
- URL: https://www.wjgnet.com/1949-8462/full/v3/i9/303.htm
- DOI: https://dx.doi.org/10.4330/wjc.v3.i9.303


