Copyright
©2011 Baishideng Publishing Group Co.
World J Cardiol. Jul 26, 2011; 3(7): 256-259
Published online Jul 26, 2011. doi: 10.4330/wjc.v3.i7.256
Published online Jul 26, 2011. doi: 10.4330/wjc.v3.i7.256
Figure 1 A 12-lead electrocardiogram showing left ventricular hypertrophy and inverted T-waves in the V2, V3, V4, V5 and V6 leads.
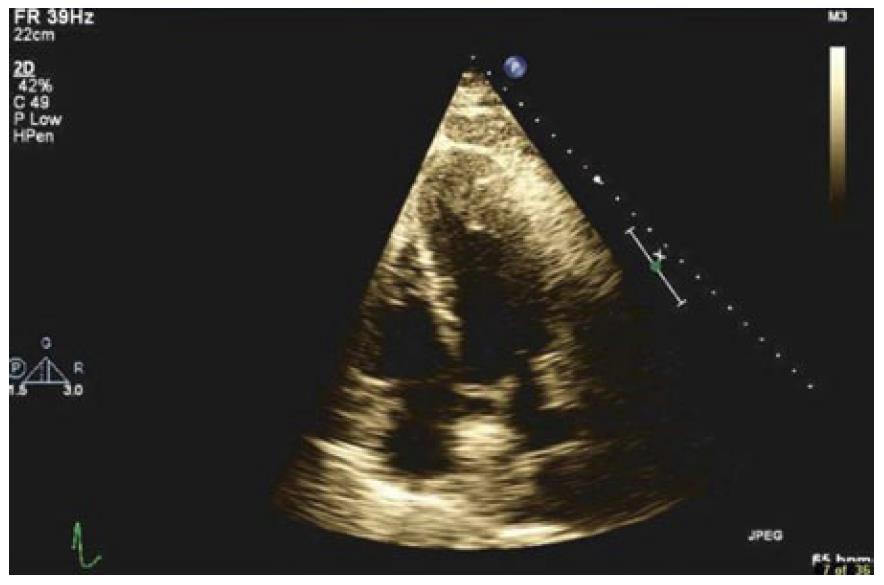
Figure 2 A 2D transthoracic echocardiogram showing left ventricular apical hypertrophy.
Figure 3 Doppler imaging showing a late peaking systolic gradient.
- Citation: Yusuf SW, Bathina JD, Banchs J, Mouhayar EN, Daher IN. Apical hypertrophic cardiomyopathy. World J Cardiol 2011; 3(7): 256-259
- URL: https://www.wjgnet.com/1949-8462/full/v3/i7/256.htm
- DOI: https://dx.doi.org/10.4330/wjc.v3.i7.256


