Copyright
©2011 Baishideng Publishing Group Co.
World J Cardiol. Oct 26, 2011; 3(10): 329-336
Published online Oct 26, 2011. doi: 10.4330/wjc.v3.i10.329
Published online Oct 26, 2011. doi: 10.4330/wjc.v3.i10.329
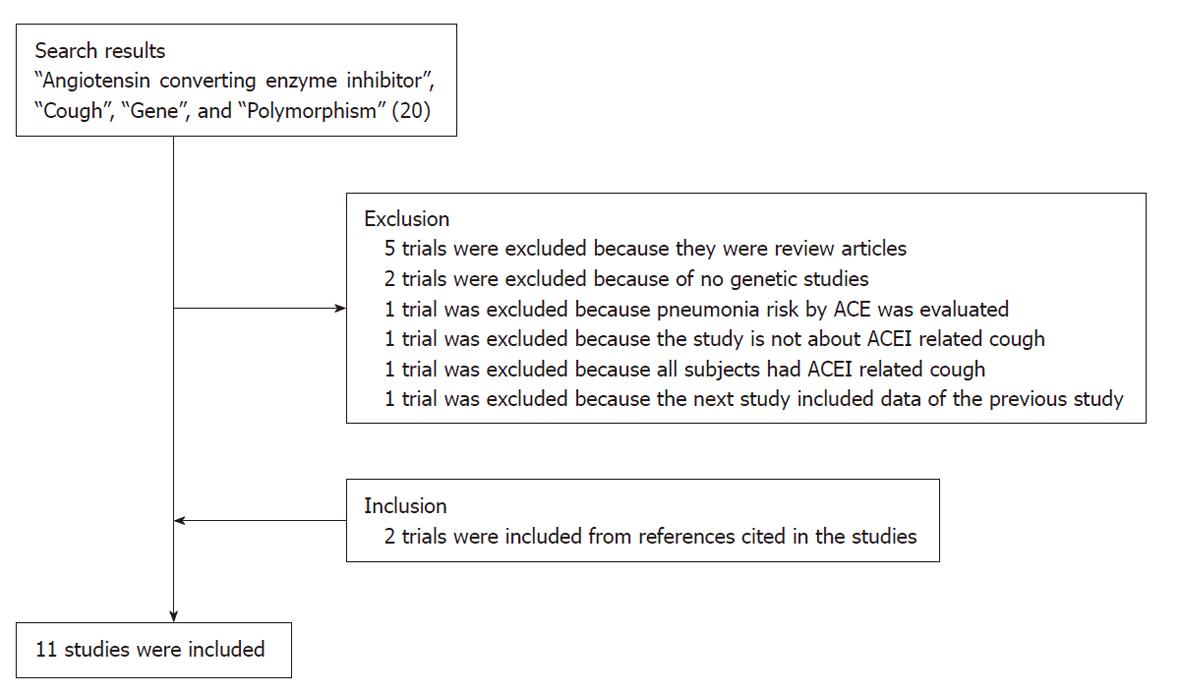
Figure 1 Flow chart of retrieved studies and studies excluded, with specification of reasons.
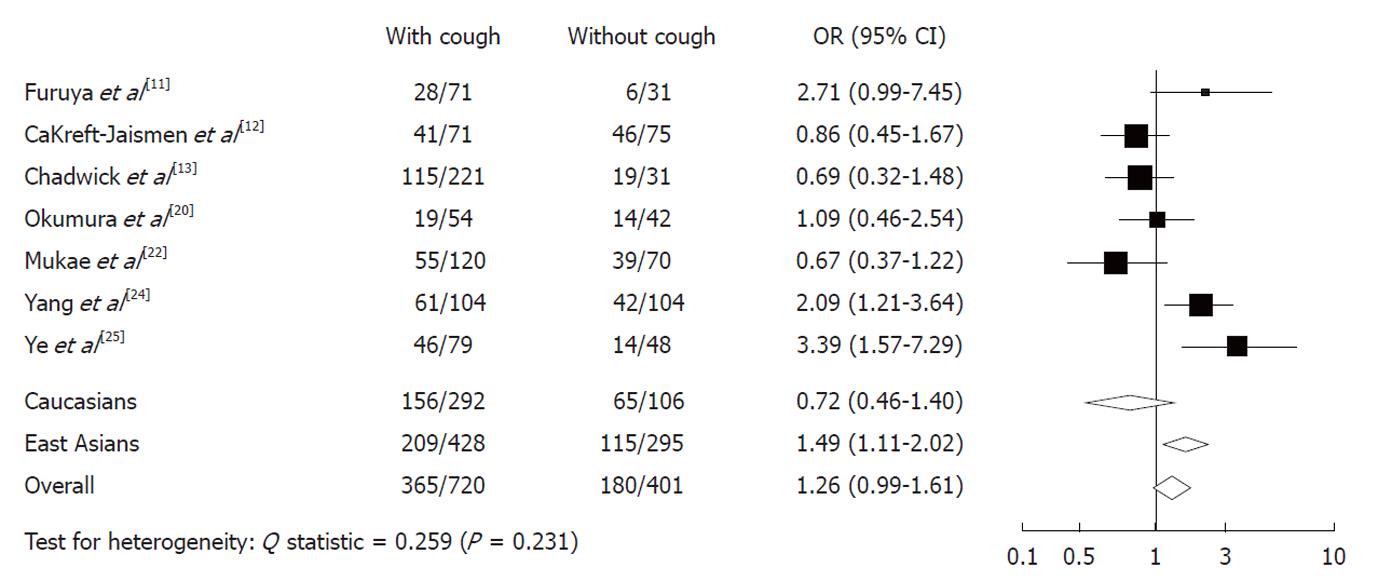
Figure 2 Random effects odds ratio estimates with the corresponding 95% confidence interval of the ACE allele contrast for ACEI-related cough.
The odds ratio (OR) estimate of each study is marked with a solid black square. The size of the square represents the weight that the corresponding study exerts in the meta-analysis. The confidence intervals of pooled estimates are displayed as a horizontal line through the diamond. The horizontal axis is plotted on a log scale. OR greater than 1 indicates increased risk of ACEI-induced cough.
Figure 3 Random effects odds ratio estimates with the corresponding 95% confidence interval of the bradykinin B2 receptor allele contrast for ACEI-related cough.
The odds ratio (OR) estimate of each study is marked with a solid black square. The size of the square represents the weight that the corresponding study exerts in the meta-analysis. The confidence intervals of pooled estimates are displayed as a horizontal line through the diamond. The horizontal axis is plotted on a log scale. OR greater than 1 indicates increased risk of ACEI-induced cough.
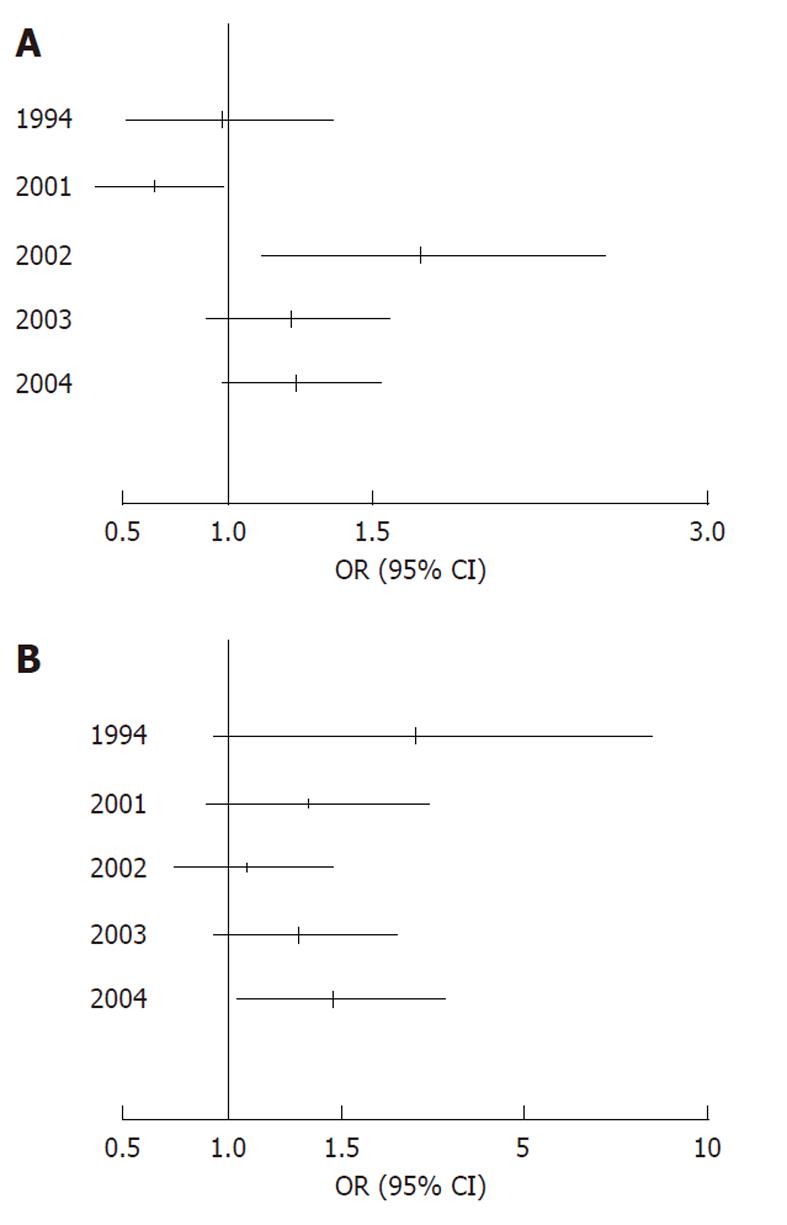
Figure 4 Cumulative meta-analysis of the ACE allele contrast for ACEI-related cough.
A: Entire population; B: East Asians. The random effects pooled odds ratio (OR) with the corresponding 95% CI at the end of each year-information step is shown. OR greater than 1 indicates increased risk of ACEI-induced cough.
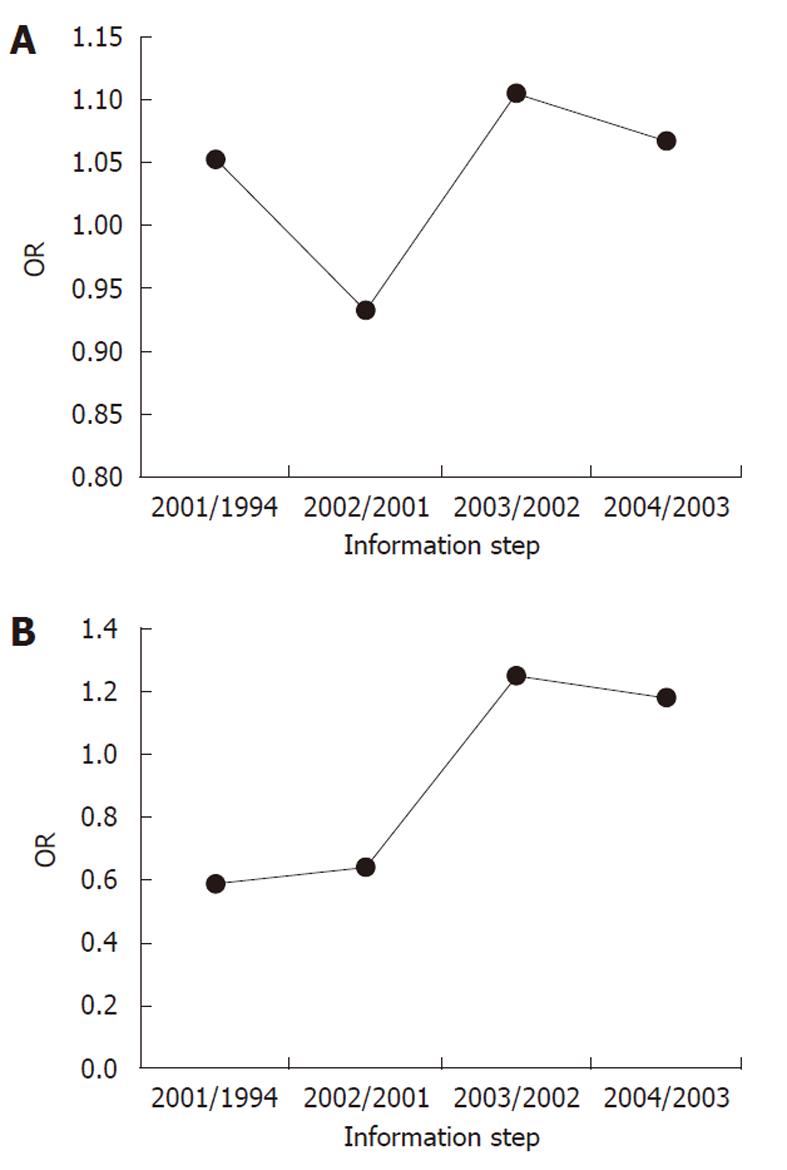
Figure 5 Recursive cumulative meta-analysis of the allele contrast (ACE D vs I) for ACEI-related cough.
A: Entire population; B: East Asians. The relative change in random effects pooled odds ratio (OR) in each information step (OR in next year/OR in current year) for the allele contrast is shown.
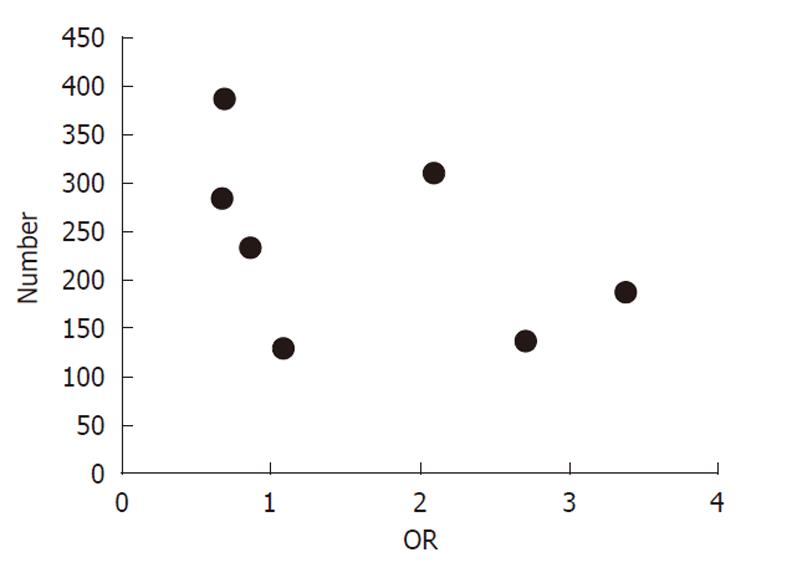
Figure 6 Funnel plot.
- Citation: Nishio K, Kashiki S, Tachibana H, Kobayashi Y. Angiotensin-converting enzyme and bradykinin gene polymorphisms and cough: A meta-analysis. World J Cardiol 2011; 3(10): 329-336
- URL: https://www.wjgnet.com/1949-8462/full/v3/i10/329.htm
- DOI: https://dx.doi.org/10.4330/wjc.v3.i10.329


