Copyright
©2011 Baishideng Publishing Group Co.
World J Cardiol. Oct 26, 2011; 3(10): 322-328
Published online Oct 26, 2011. doi: 10.4330/wjc.v3.i10.322
Published online Oct 26, 2011. doi: 10.4330/wjc.v3.i10.322
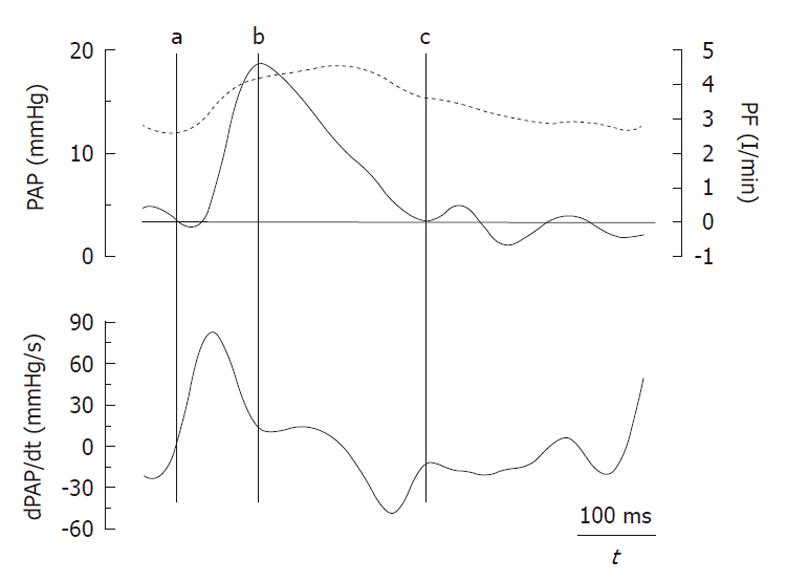
Figure 1 Pulmonary pressure and flow register (top) with the first derivative of the pulmonary arterial pressure (bottom) where the main events are defined as follows.
a: Diastolic pressure and beginning of ejection; b: Inflection point (peak pulmonary flow and first minimum of dPAP/dt); c: End of ejection. PAP: Pulmonary artery pressure; dPAP/dt: First derivative of PAP; PF: Pulmonary flow.
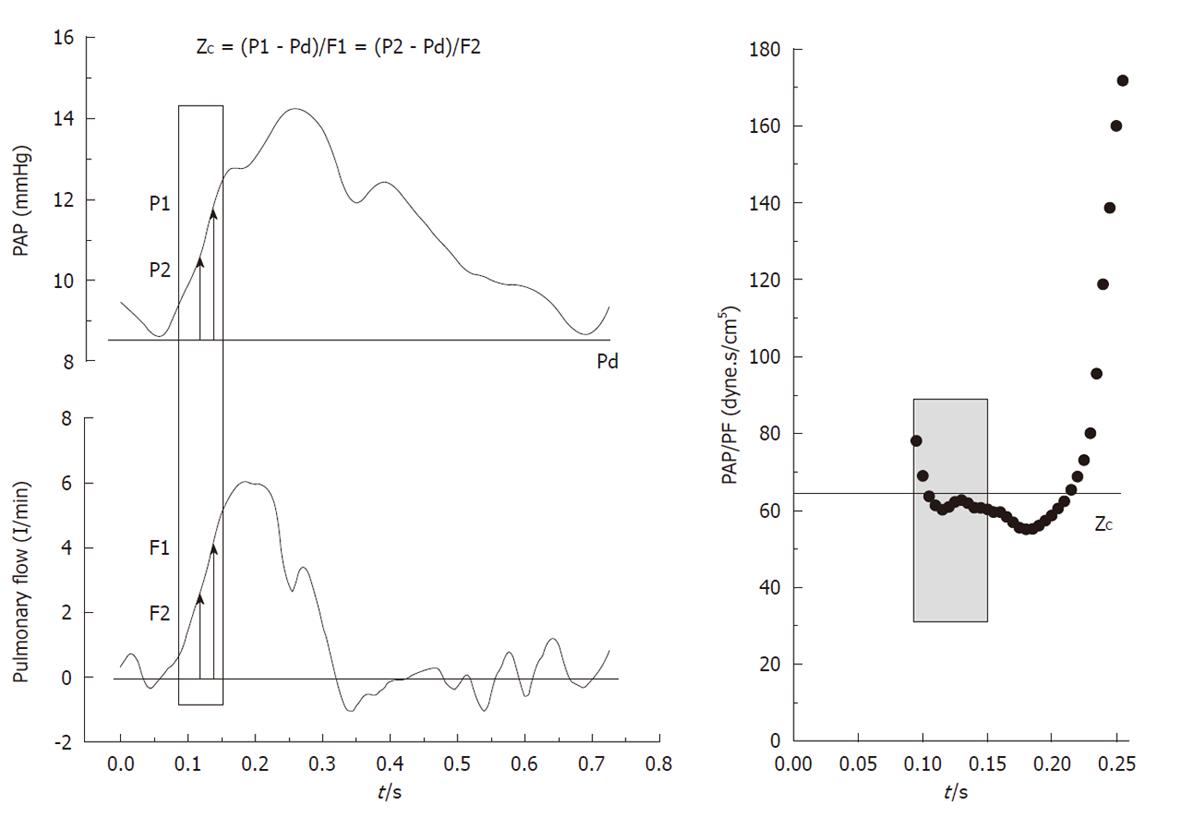
Figure 2 Method for obtaining the characteristic impedance (ZC) of the pulmonary artery.
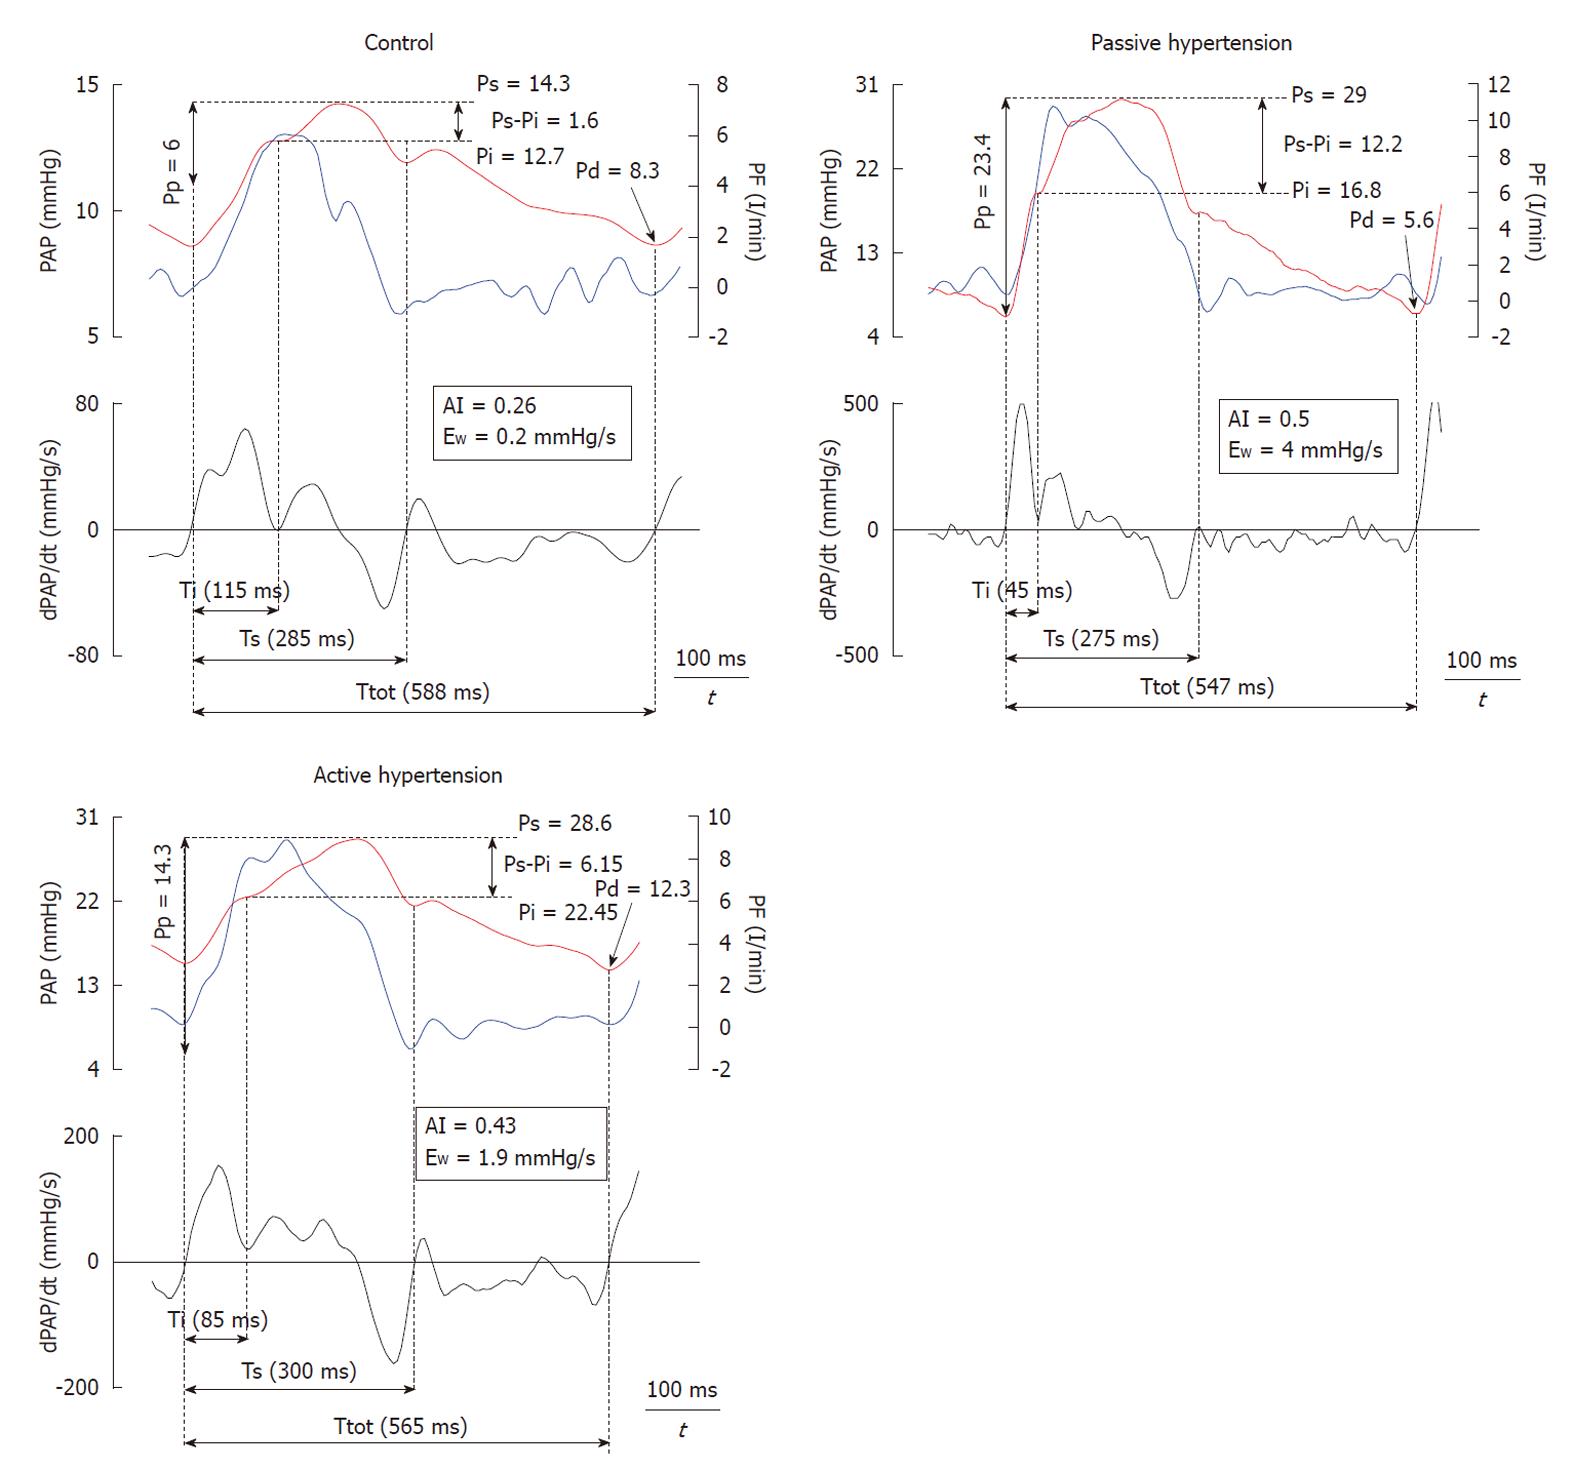
Figure 3 Time-domain analysis of pulmonary pressure and flow of a representative sheep in each of the experimental conditions.
Ti, Ts, Ttot: Incident, systolic and total times; Ps, Pi, Pd: Systolic, incident and diastolic pressures.
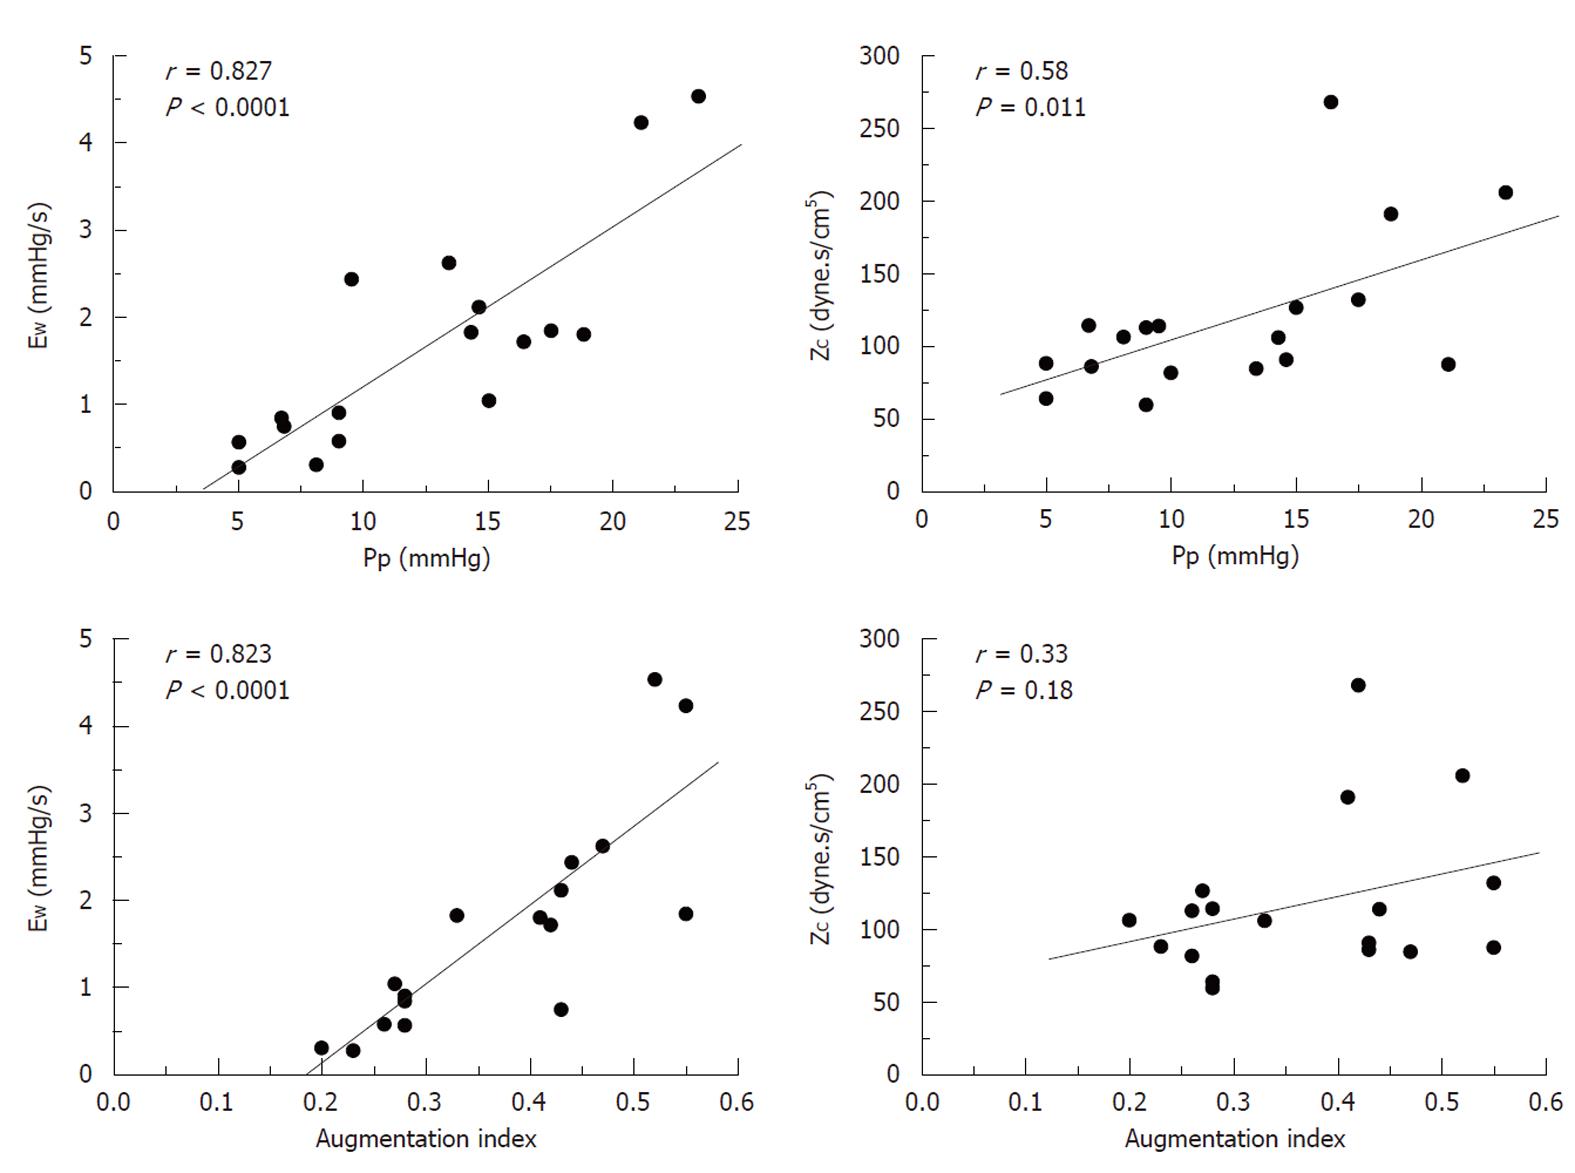
Figure 4 Correlation between pulse pressure (Pp) and augmentation index (AI) with the energy lost by the RV due to the reflected wave during ejection (EW), and the characteristic impedance (ZC).
- Citation: Grignola JC, Domingo E, Devera L, Ginés F. Assessment of right ventricular afterload by pressure waveform analysis in acute pulmonary hypertension. World J Cardiol 2011; 3(10): 322-328
- URL: https://www.wjgnet.com/1949-8462/full/v3/i10/322.htm
- DOI: https://dx.doi.org/10.4330/wjc.v3.i10.322


