Copyright
©The Author(s) 2025.
World J Cardiol. Jul 26, 2025; 17(7): 101434
Published online Jul 26, 2025. doi: 10.4330/wjc.v17.i7.101434
Published online Jul 26, 2025. doi: 10.4330/wjc.v17.i7.101434
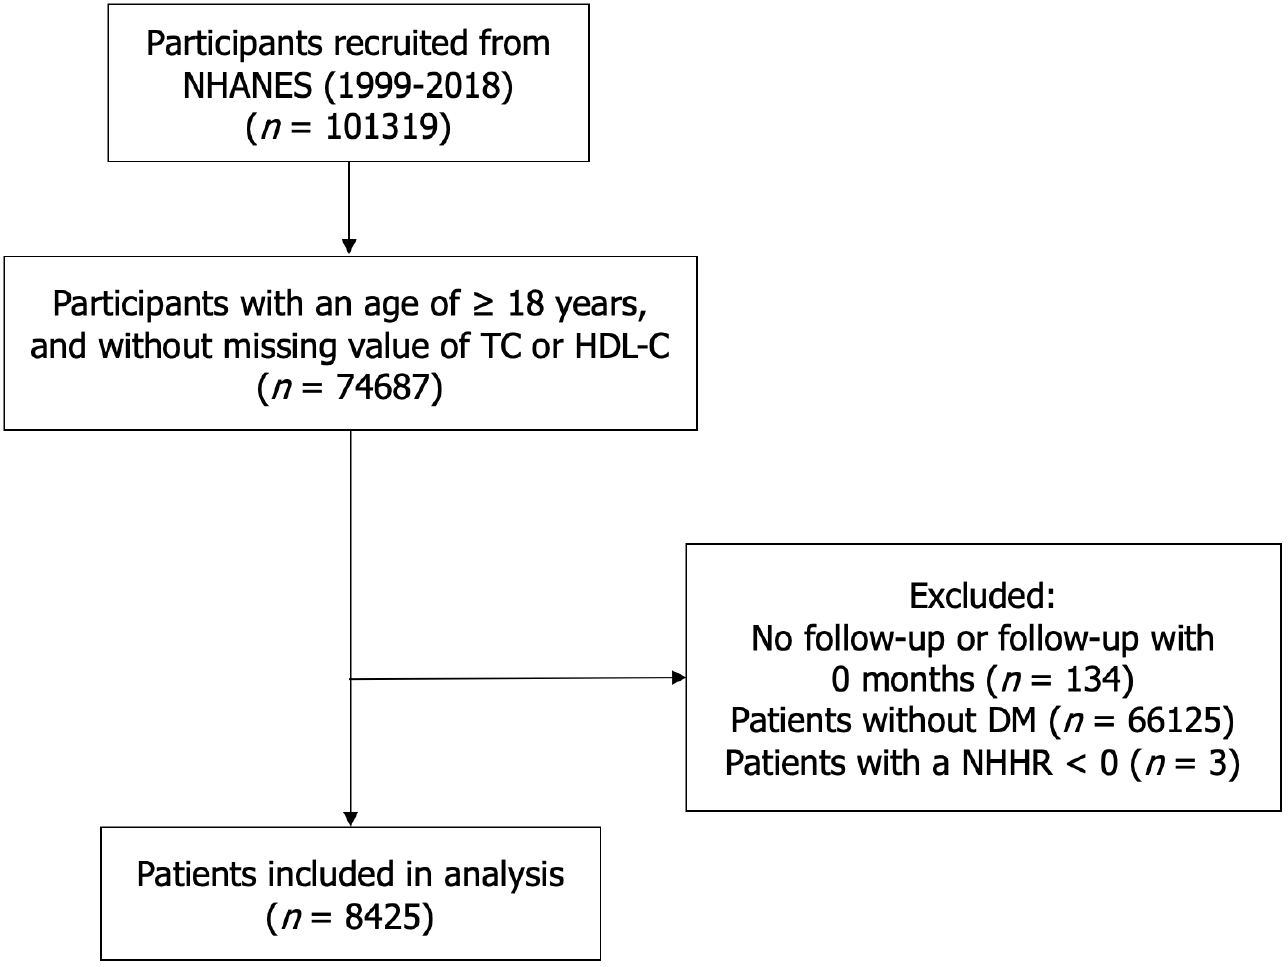
Figure 1 Study flowchart.
NHANES: National Health and Nutrition Examination Survey; TC: Total cholesterol; HDL-C: High-density lipoprotein cholesterol; NHHR: Non-high-density lipoprotein cholesterol/high-density lipoprotein cholesterol ratio; DM: Diabetes mellitus.
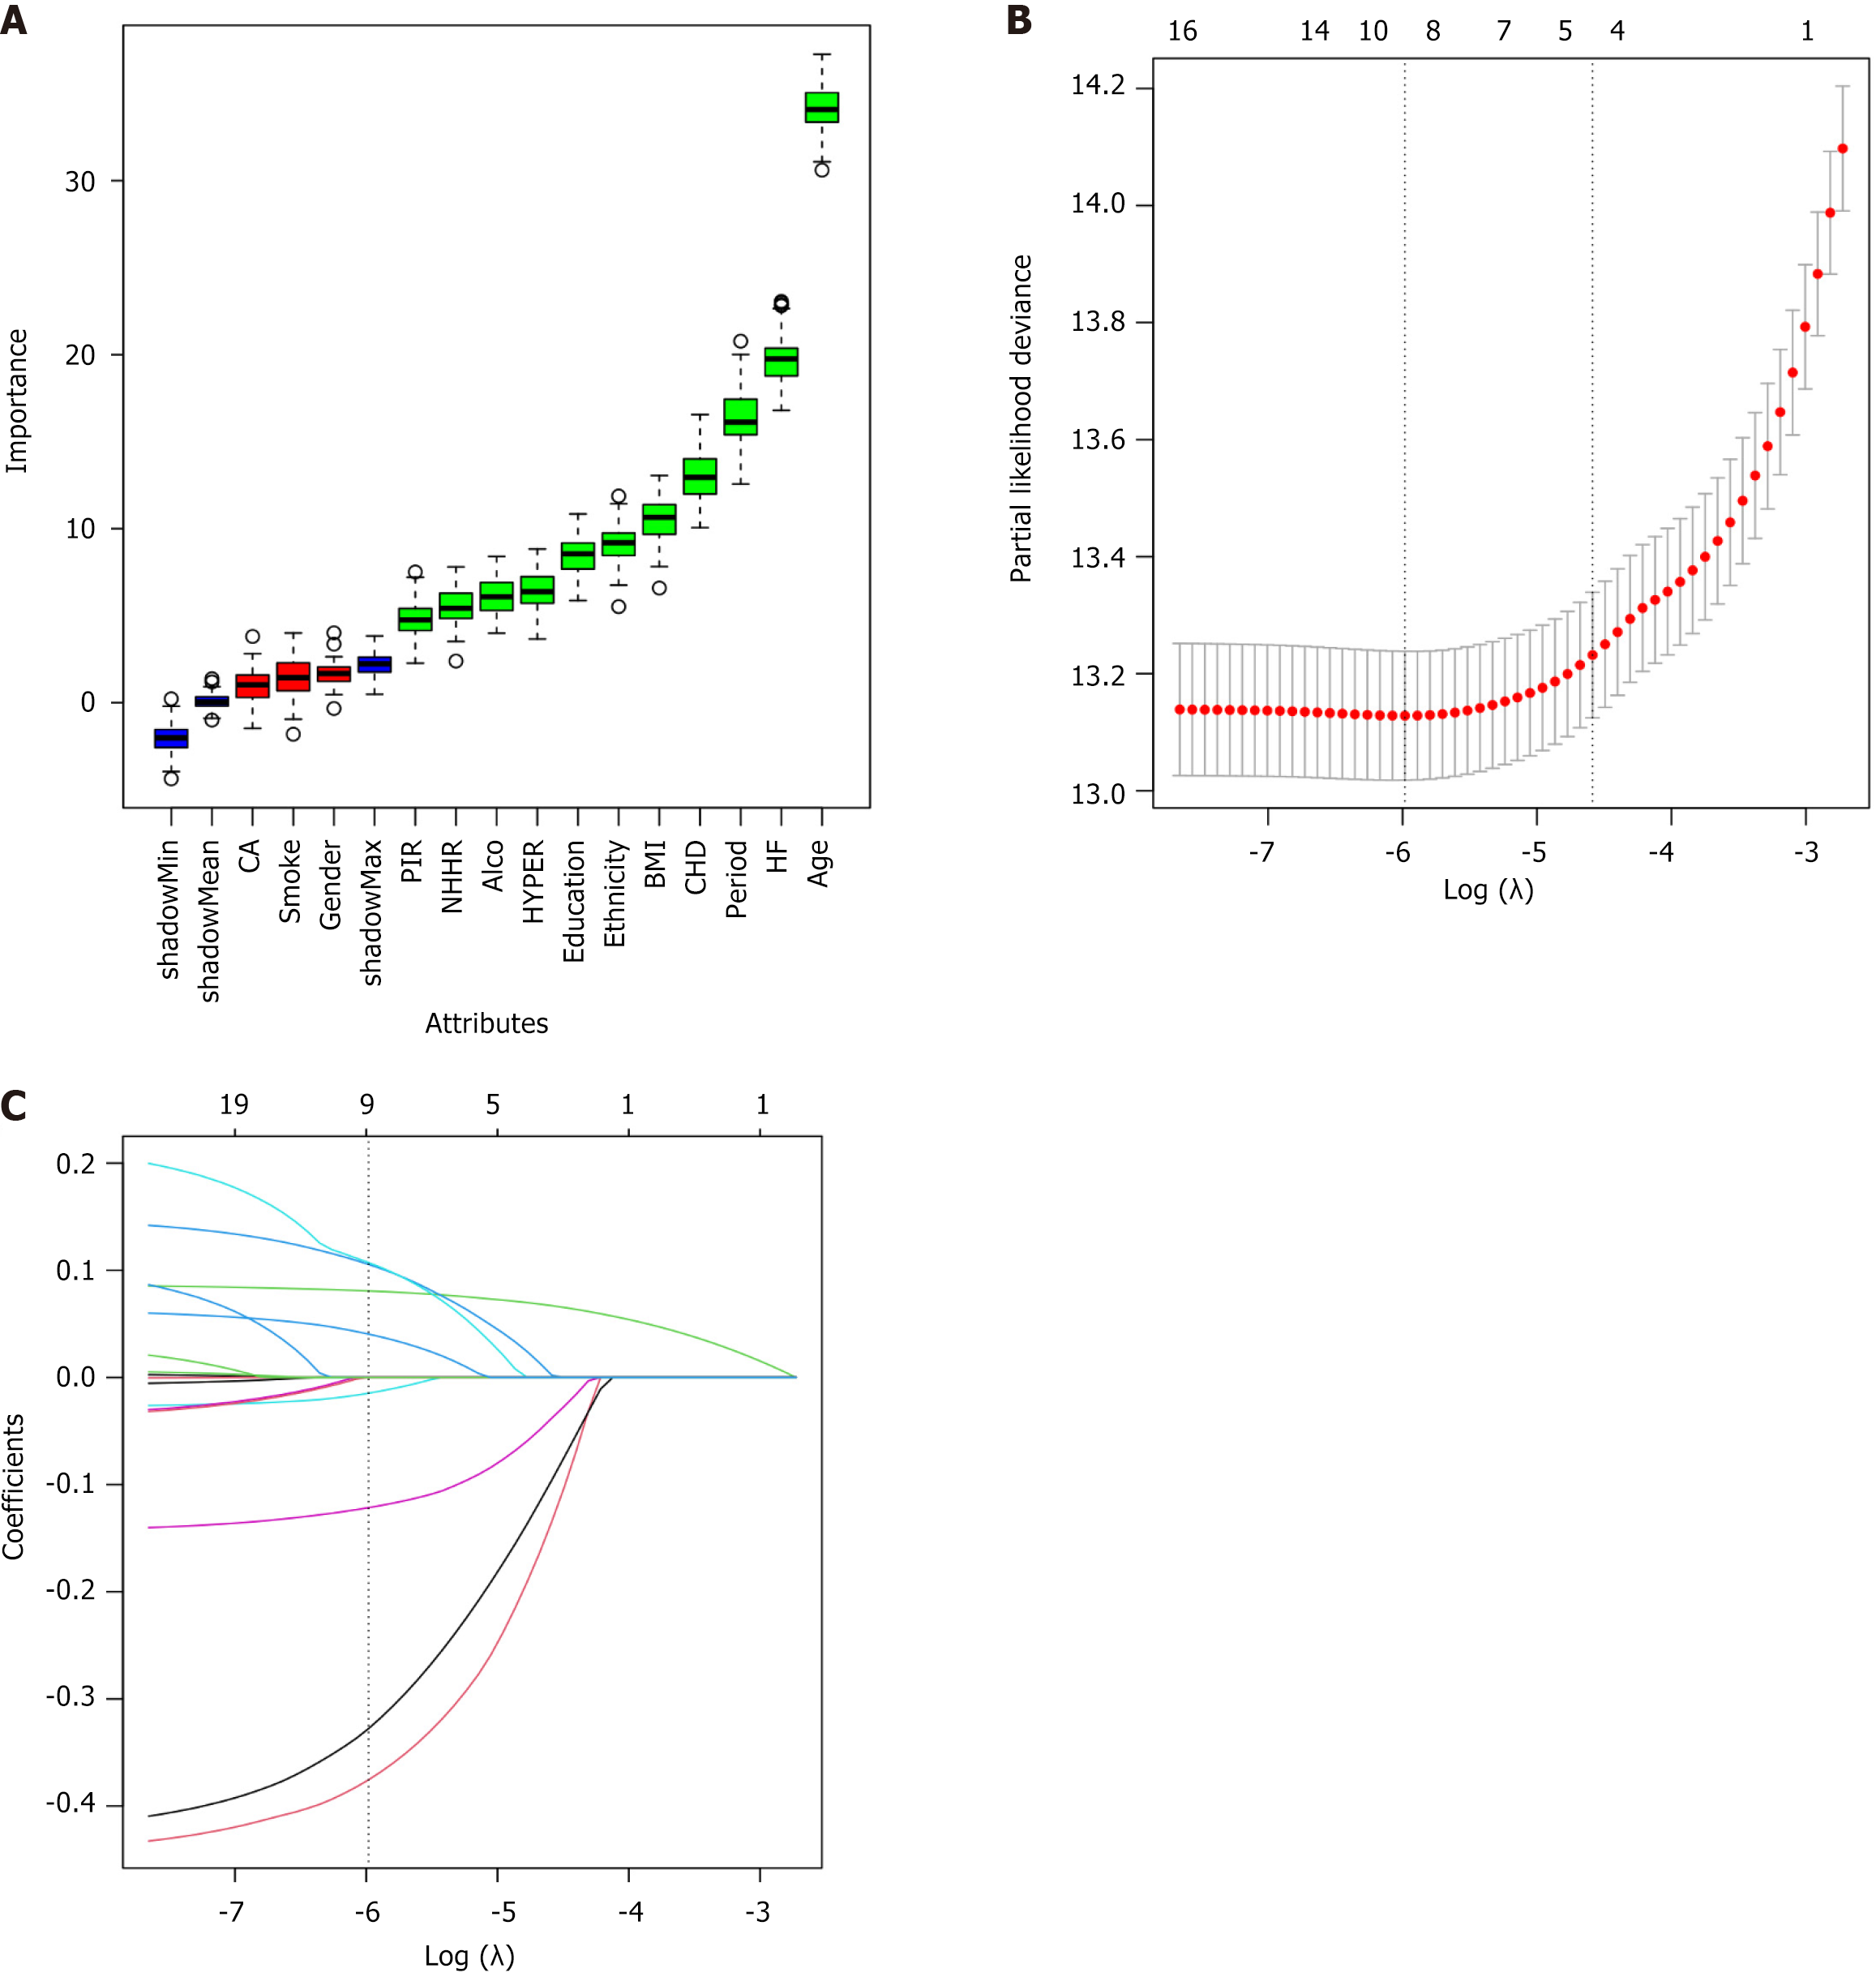
Figure 2 Feature selection by two machine learning method.
A: Feature selection by Boruta algorithm, the vertical axis represents the Z-value of each variable, boxes with green are important features; B: The plot of the association between the cross-validation error and the log-transformed penalty parameter (λ) in the least absolute shrinkage and selection operator regression analysis; C: The least absolute shrinkage and selection operator regression screening path for the variables based on the optimal log of lambda. PIR: Poverty-income ratio; HYPER: Hypertension; CHD: Coronary heart disease; HF: Heart failure; NHHR: Non-high-density lipoprotein cholesterol/high-density lipoprotein cholesterol ratio; BMI: Body mass index.
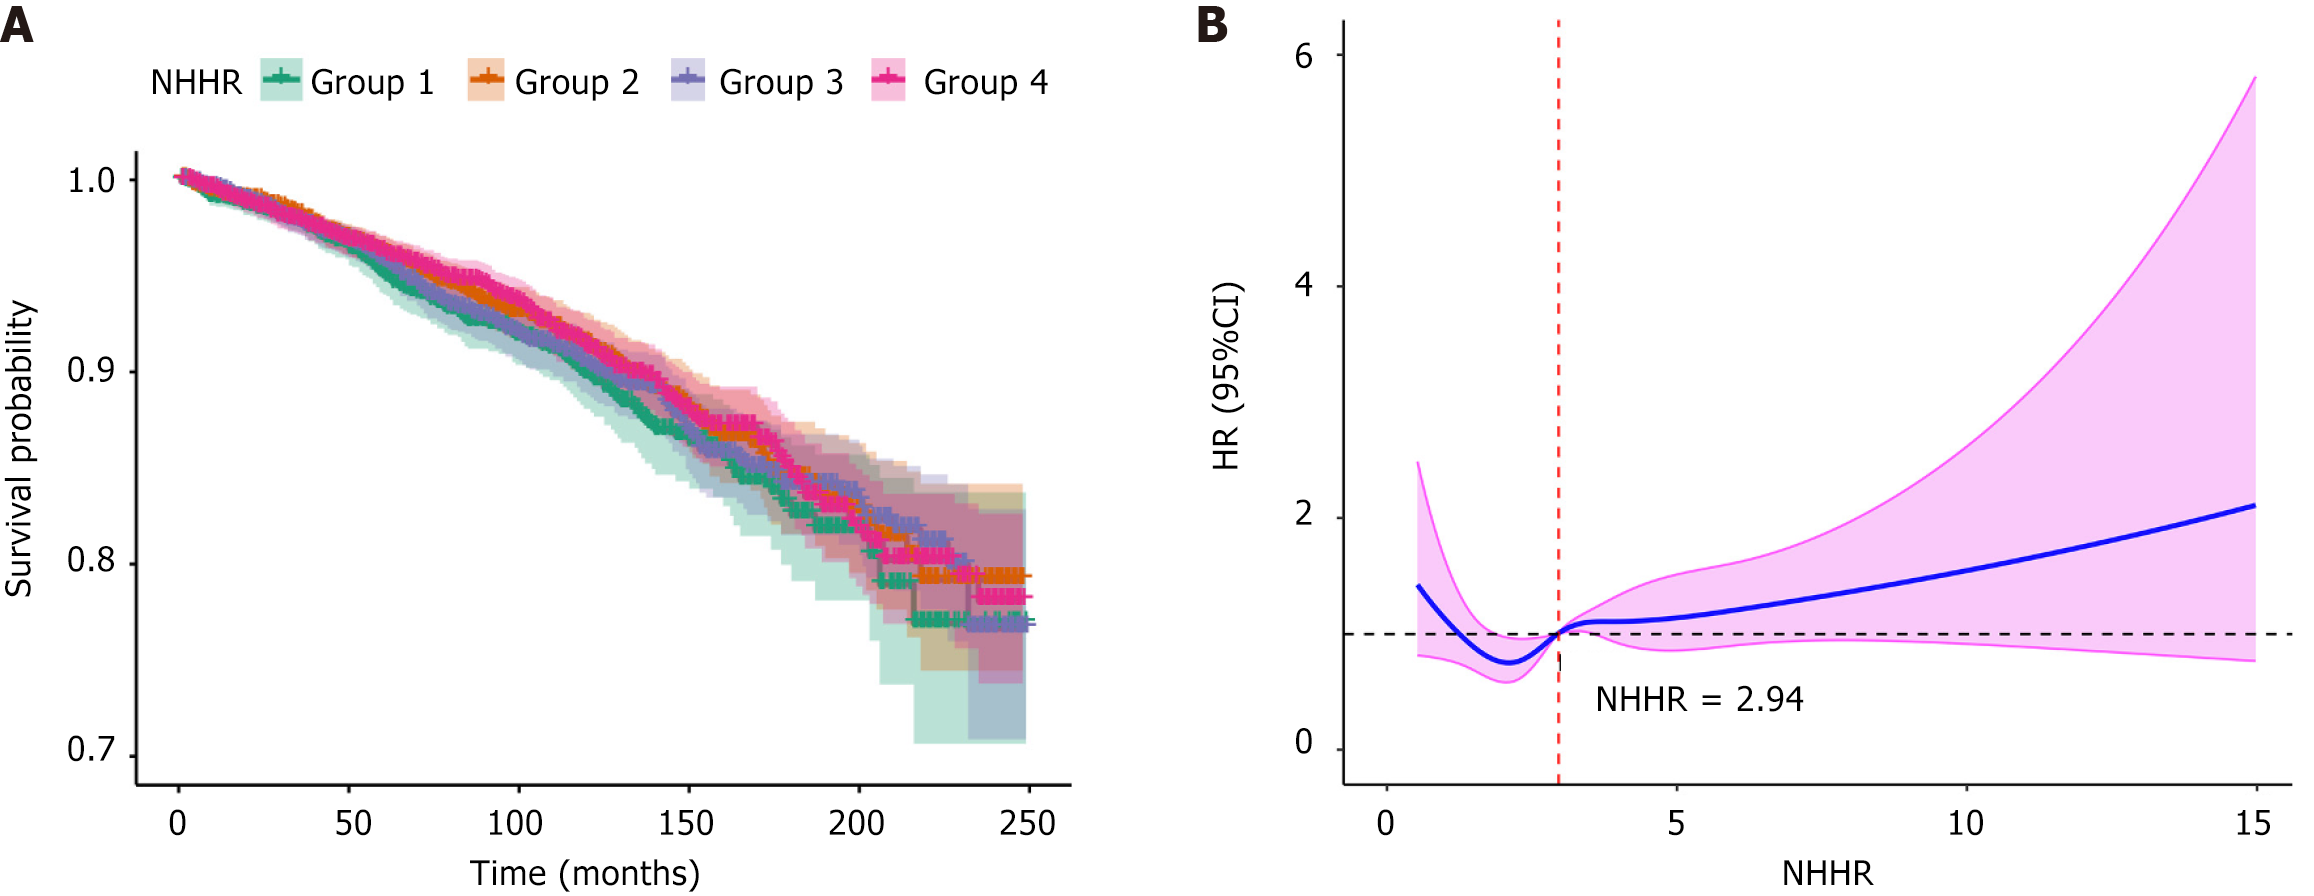
Figure 3 Kaplan-Meier curve and restricted cubic splines of the analysis on non-high-density lipoprotein cholesterol/high-density lipoprotein cholesterol ratio and cardiovascular mortality.
A: Kaplan-Meier curve stratified by non-high-density lipoprotein cholesterol/high-density lipoprotein cholesterol ratio (quartile 1 to quartile 4); B: Multiple-adjusted restricted cubic splines showing hazard ratios for the risk of incident cardiovascular mortality associated with remnant cholesterol. Blue solid lines represent hazard ratios, and shaded areas represent 95% confidence intervals. Analysis was adjusted for age, ethnicities, education levels, poverty-income ratio, history of heart failure and non-high-density lipoprotein cholesterol/high-density lipoprotein cholesterol ratio. HR: Hazard ratios; CI: Confidence intervals; NHHR: Non-high-density lipoprotein cholesterol/high-density lipoprotein cholesterol ratio.
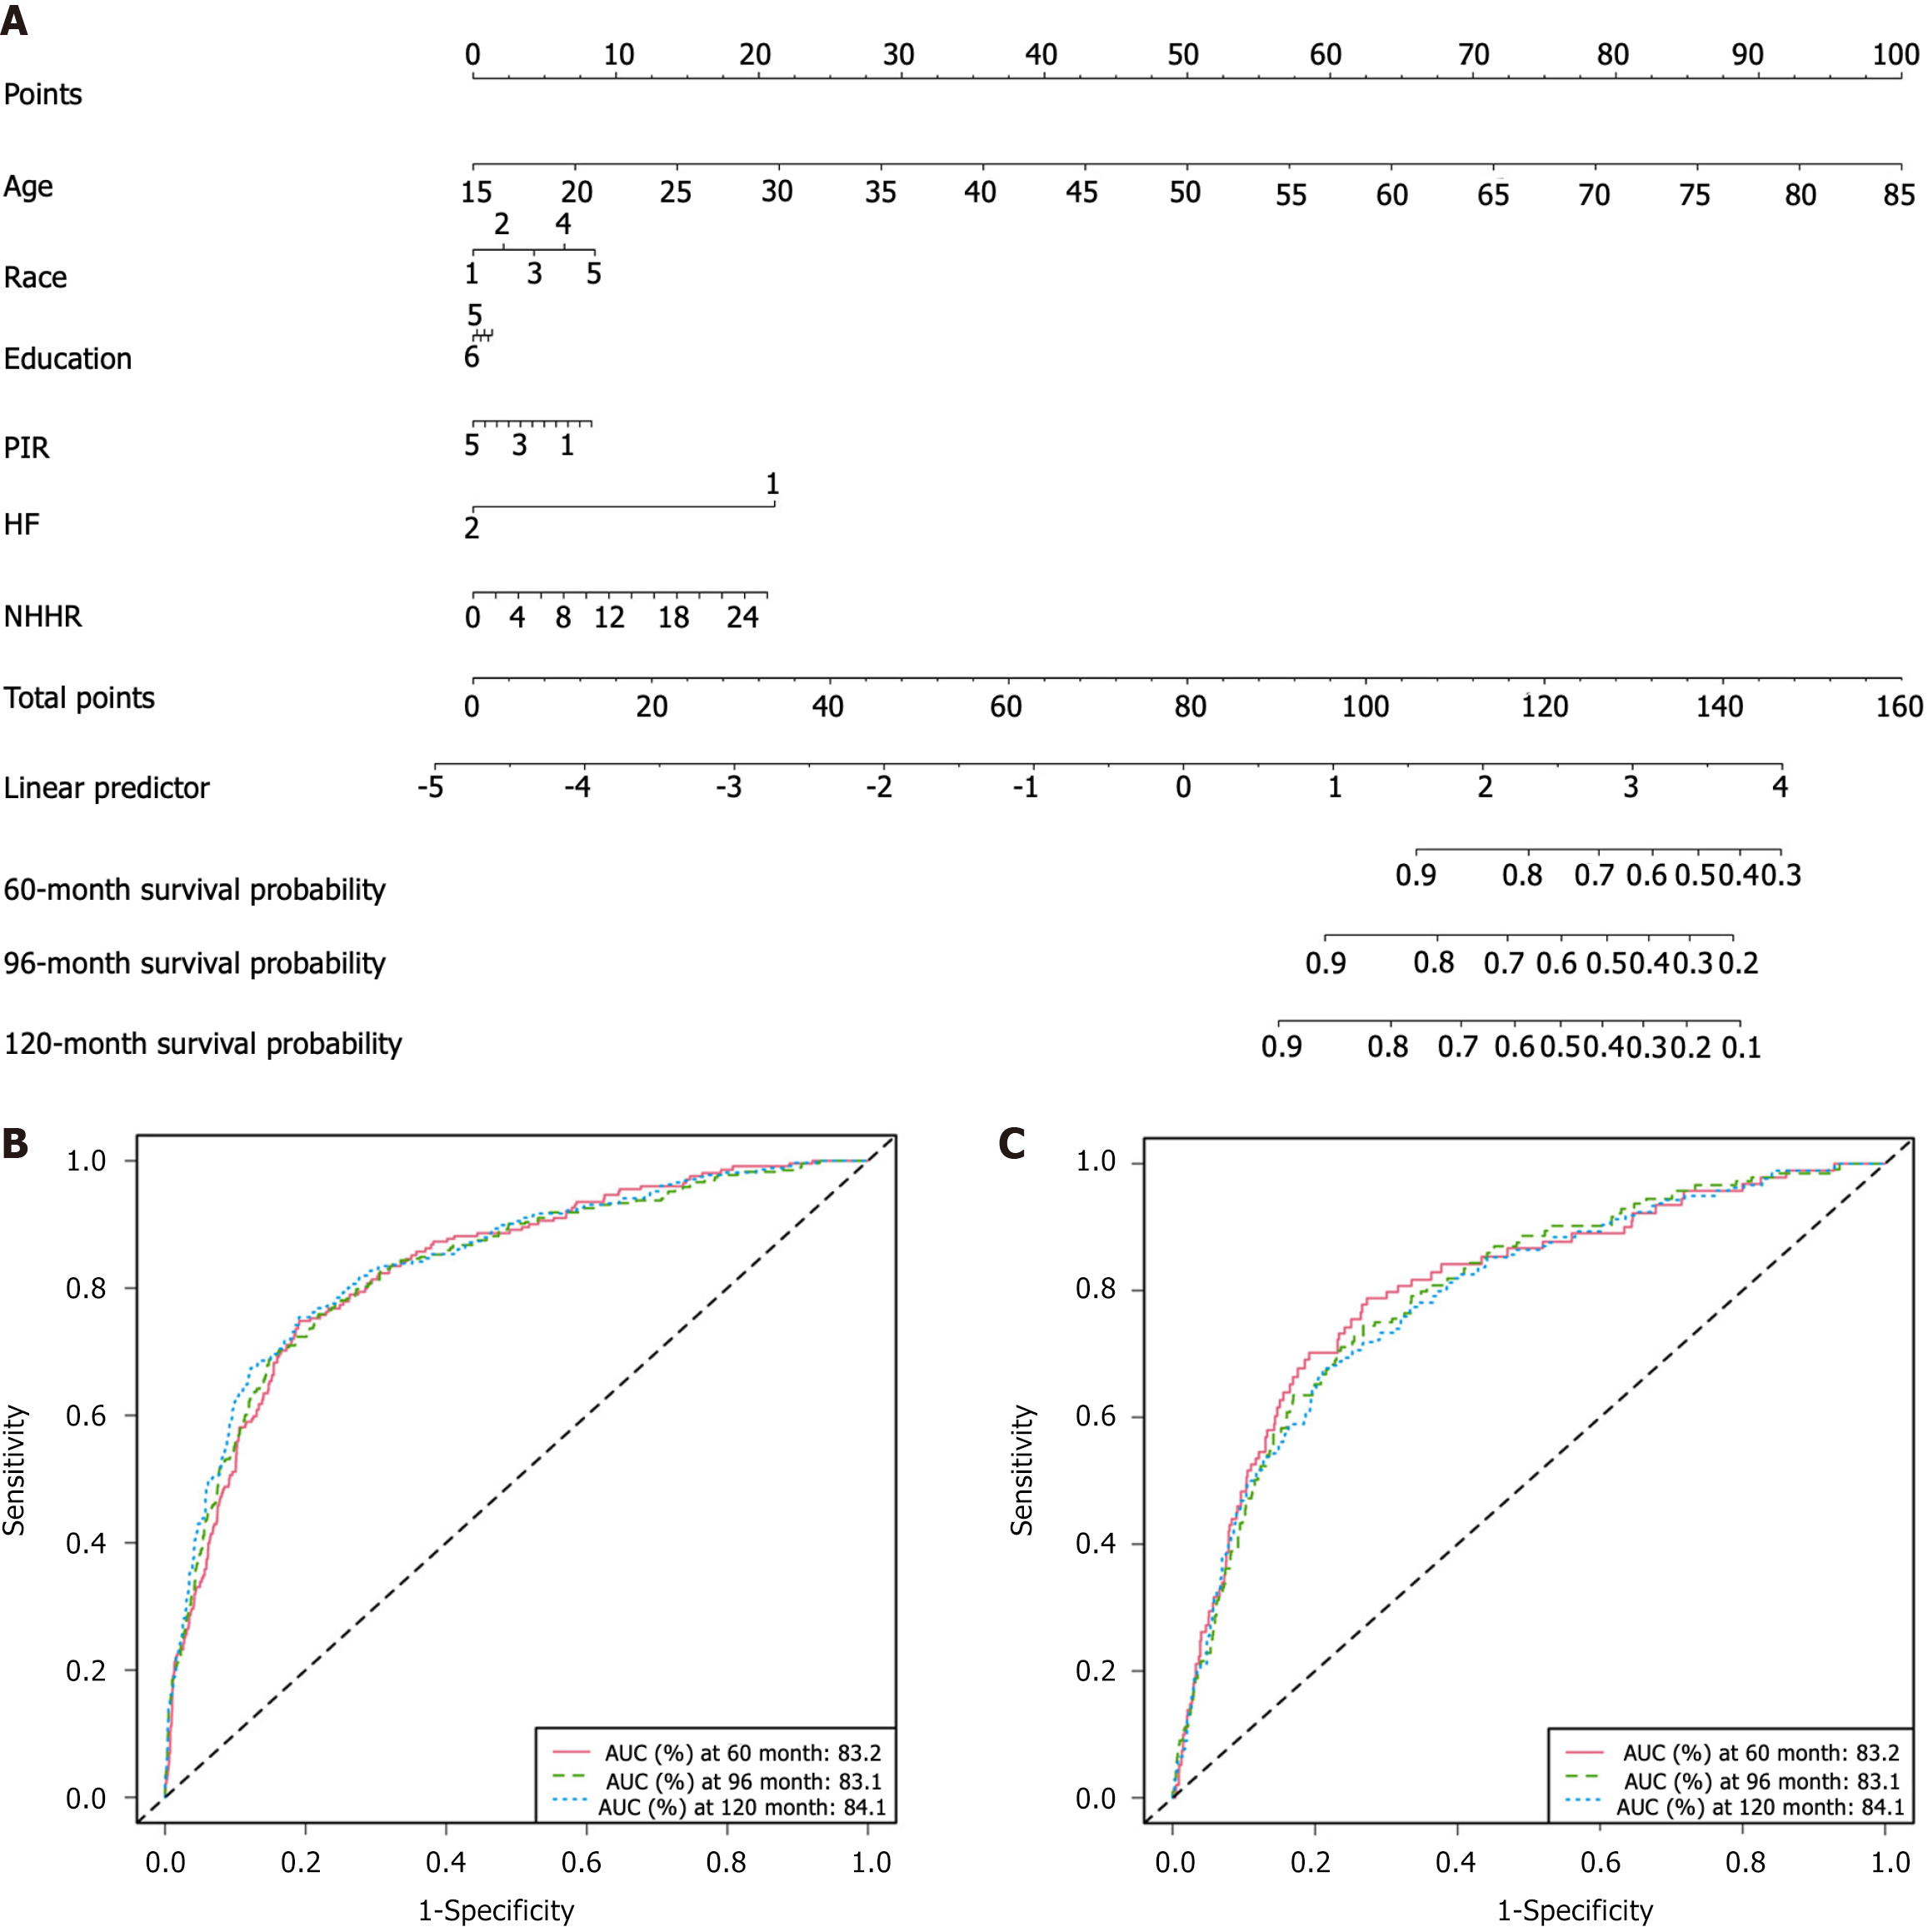
Figure 4 Nomogram predicting cardiovascular mortality in patients with diabetes mellitus.
A: Heart failure 1 indicates heart failure history, and 2 indicates no heart failure history. Race 1 indicates Mexican American, 2 indicates other Hispanic, 3 represents non-Hispanic white, 4 indicates non-Hispanic black, and 5 represents other ethnicities; Education (1-4 not shown in the nomogram but available online) 1 indicates less than 9th grade, 2 indicates 9-11th grade, 3 represents high school graduate, 4 indicates college, 5 represents college graduate or above, and 6 indicates unknown; B: Receiver operating characteristic curves of non-high-density lipoprotein cholesterol/high-density lipoprotein cholesterol ratio (NHHR) in predicting cardiovascular mortality for 60, 96, and 120 months in training cohort; C: Receiver operating characteristic curves of NHHR in predicting cardiovascular mortality for 60, 96, and 120 months in validation cohort. PIR: Poverty-income ratio; HF: Heart failure; NHHR: Non-high-density lipoprotein cholesterol/high-density lipoprotein cholesterol ratio; AUC: Area under the curve.
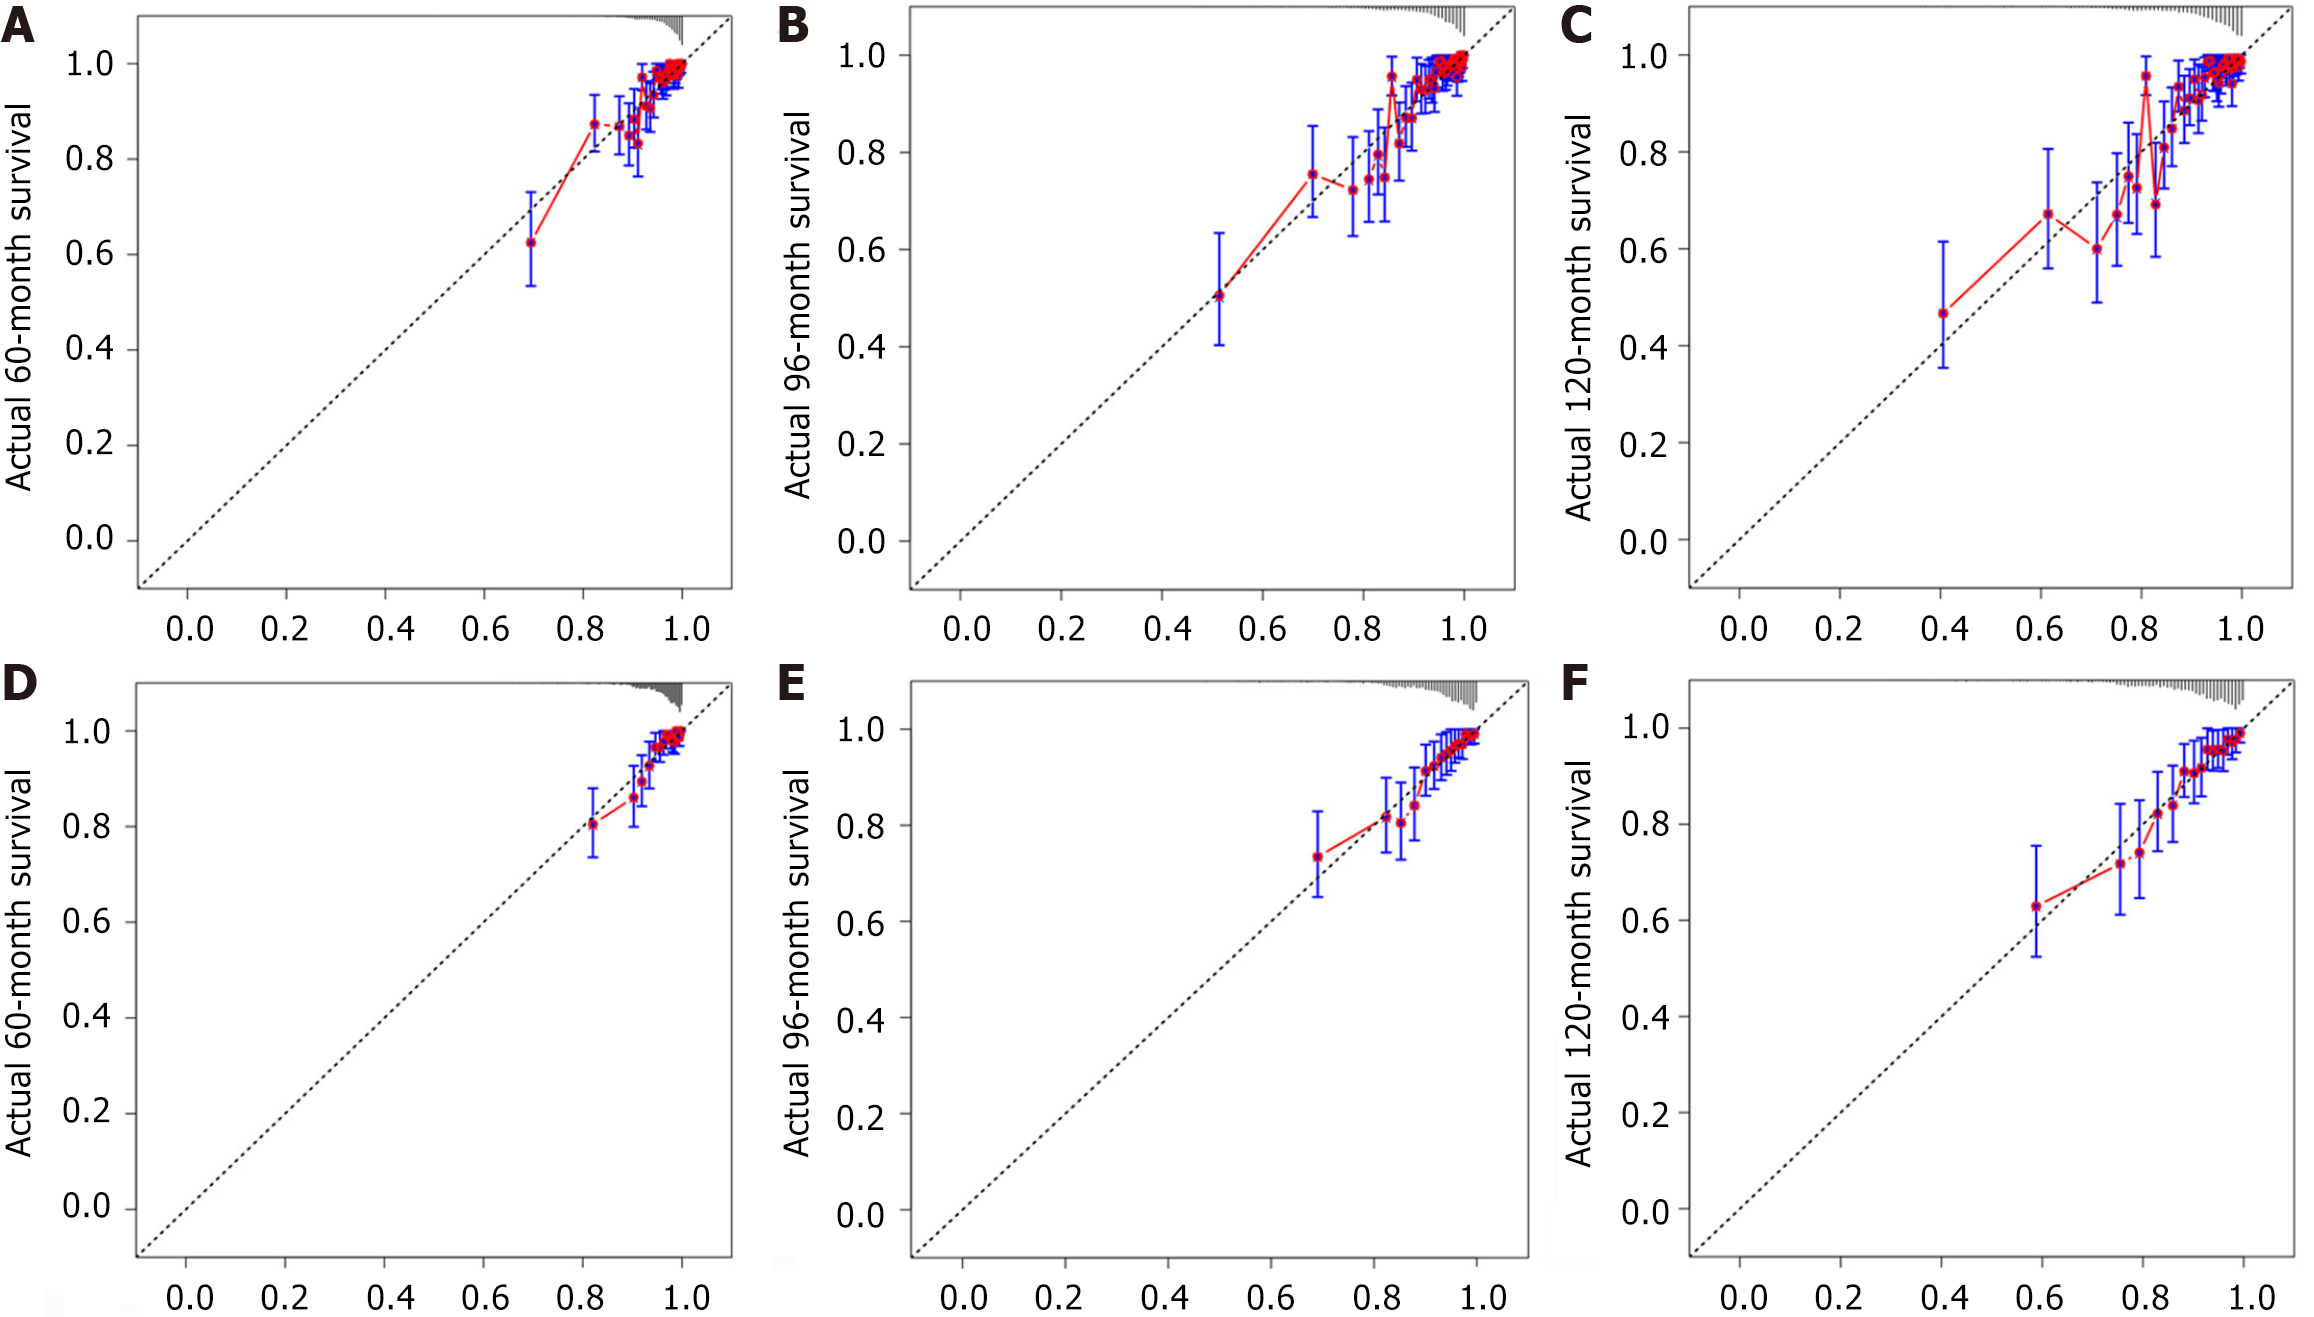
Figure 5 Calibration curves of the nomogram prediction model for cardiovascular mortality in patients with diabetes mellitus.
A-C: Calibration curve for 60, 96, and 120 months in the training set; D-F: Calibration curve for 60, 96, and 120 months in the validation set.
- Citation: Pan D, Chen PF, Ji SY, Chen TL, Zhang H. Non-high-density lipoprotein cholesterol/high-density lipoprotein cholesterol is a predictor for cardiovascular mortality in patients with diabetes mellitus. World J Cardiol 2025; 17(7): 101434
- URL: https://www.wjgnet.com/1949-8462/full/v17/i7/101434.htm
- DOI: https://dx.doi.org/10.4330/wjc.v17.i7.101434


