Copyright
©The Author(s) 2025.
World J Cardiol. Apr 26, 2025; 17(4): 104168
Published online Apr 26, 2025. doi: 10.4330/wjc.v17.i4.104168
Published online Apr 26, 2025. doi: 10.4330/wjc.v17.i4.104168
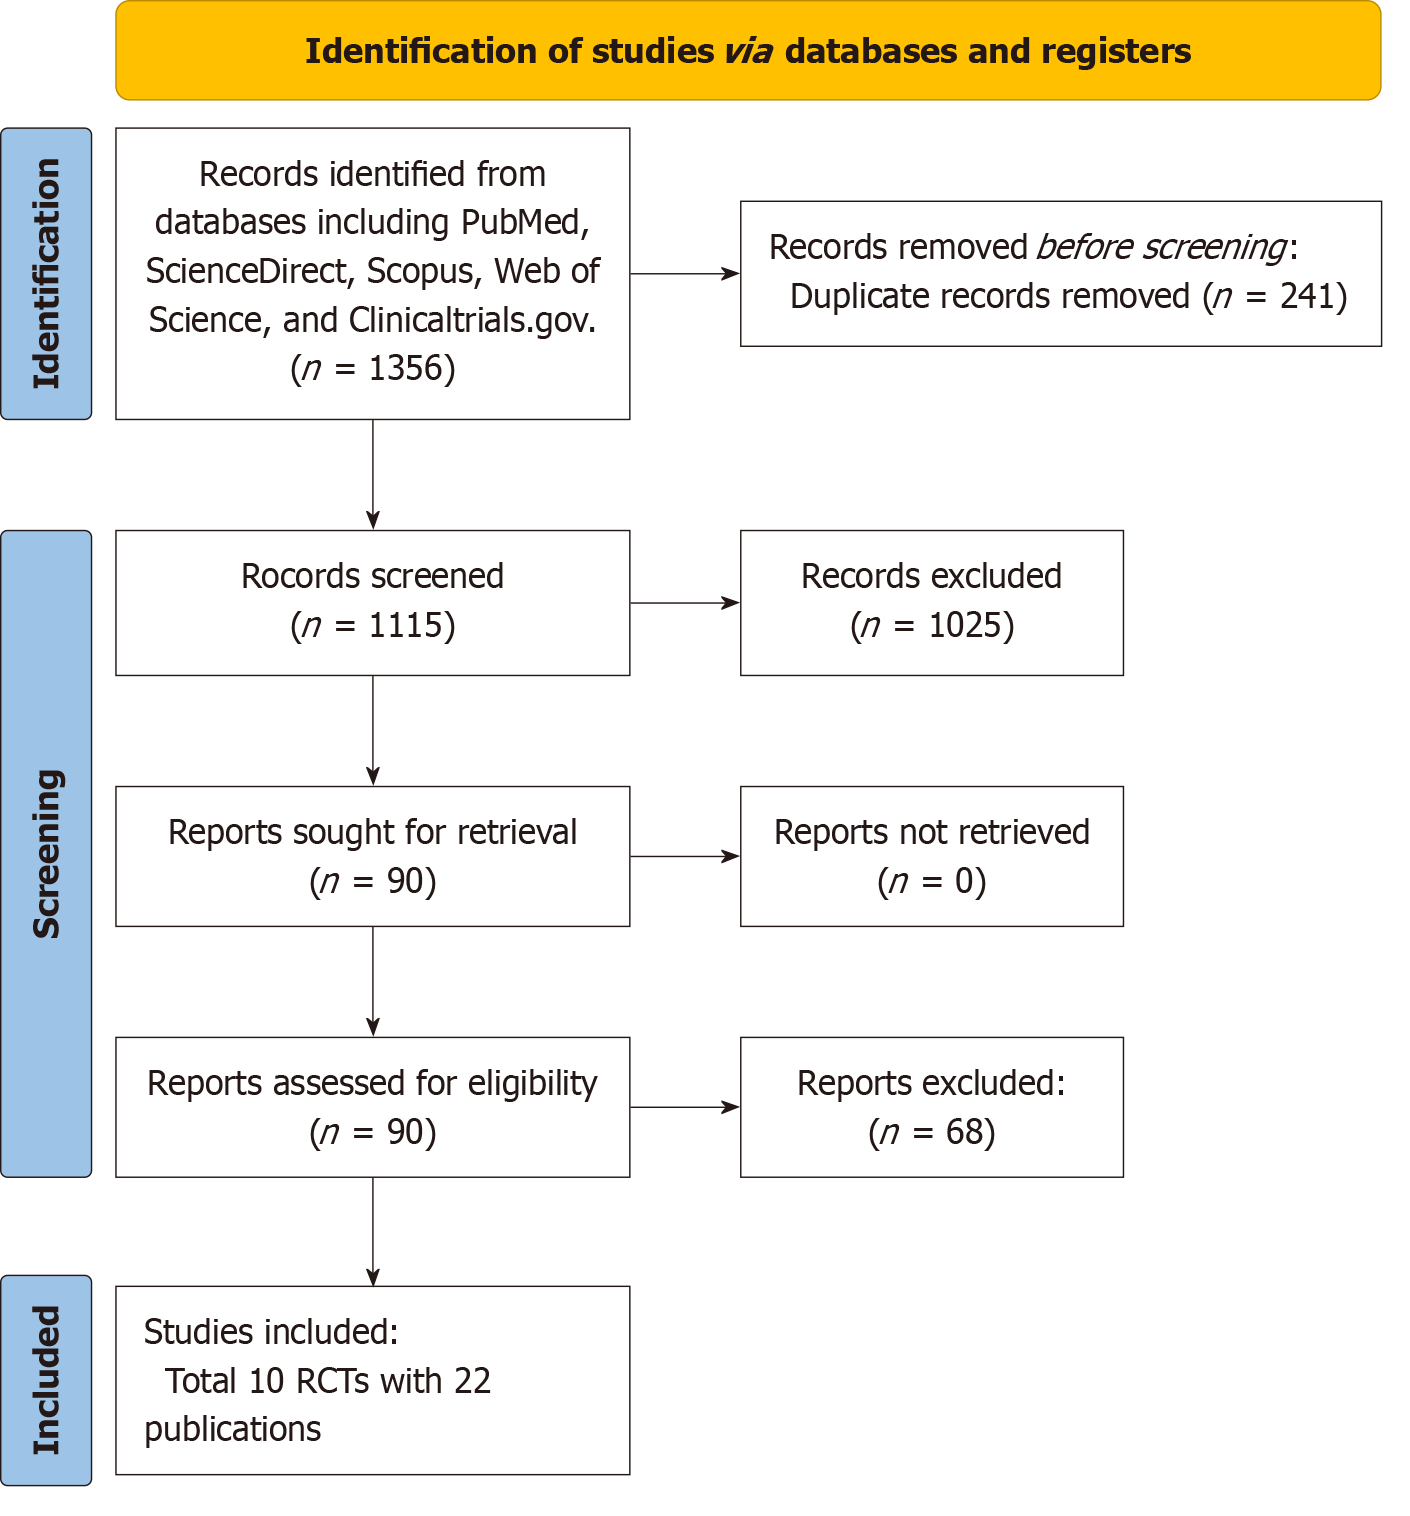
Figure 1
PRISMA flow diagram of the study selection process for the meta-analysis.
Figure 2 Forest plot of transcatheter aortic valve replacement vs surgical aortic valve replacement.
A: All-cause mortality; B: Stroke rates; C: Disabling stroke; D: Cardiac death; E: Myocardial infarction; F: New permanent pacemaker insertion rates; G: Acute kidney injury rates; H: Rehospitalization rates; I: Aortic valve reintervention rates; J: New atrial fibrillation rates; K: Paravalvular leak rates; L: Major bleeding rates; M: Major vascular complication rates. TAVR: Transcatheter aortic valve replacement; SAVR: Surgical aortic valve replacement.
- Citation: Moradi I, Mustafa MS, Sardar Sheikh J, Shojai Rahnama B, Fredericks M, Kumar Yennam A, Arain M, Saha U, Richard Ma A, Nagendran A, Bin Omer M, Armaghan M, Jaimes DCC, Avinash Bojanki NLSV, Shafique MA. Comparative effectiveness of transcatheter vs surgical aortic valve replacement: A systematic review and meta-analysis. World J Cardiol 2025; 17(4): 104168
- URL: https://www.wjgnet.com/1949-8462/full/v17/i4/104168.htm
- DOI: https://dx.doi.org/10.4330/wjc.v17.i4.104168


