Copyright
©The Author(s) 2024.
World J Cardiol. Jun 26, 2024; 16(6): 363-369
Published online Jun 26, 2024. doi: 10.4330/wjc.v16.i6.363
Published online Jun 26, 2024. doi: 10.4330/wjc.v16.i6.363
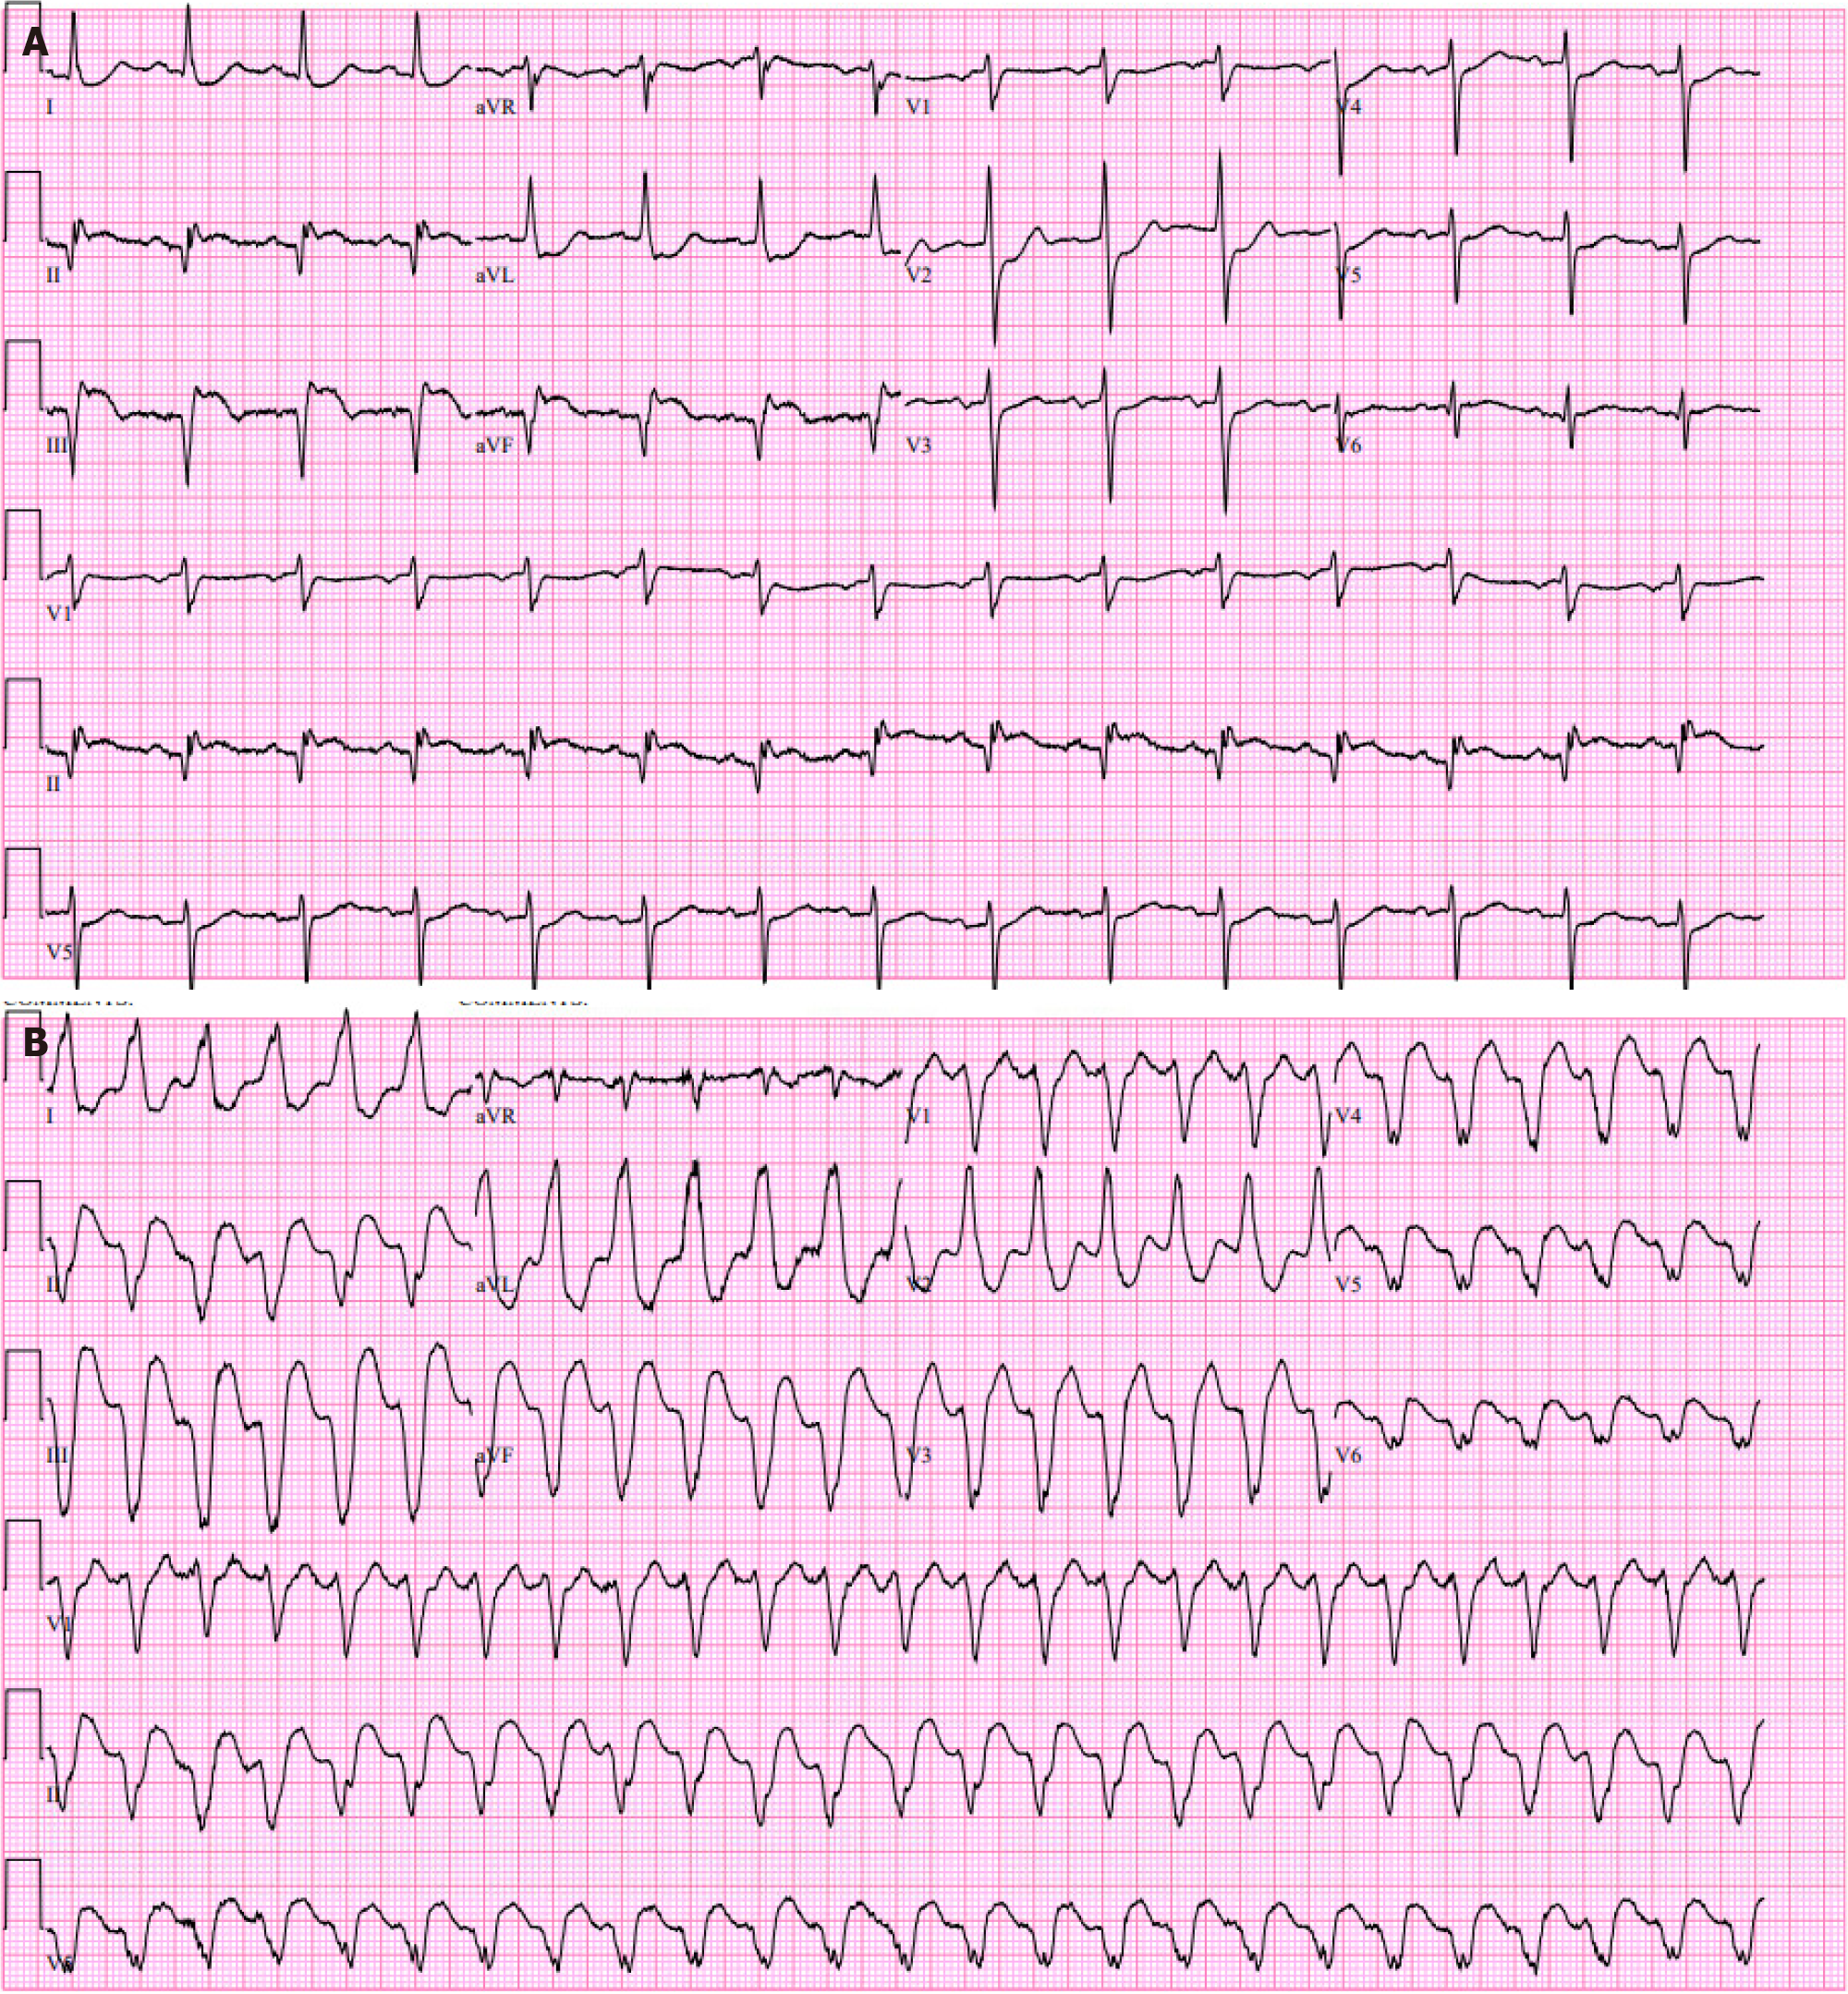
Figure 1 12-lead electrocardiograms showing an inferior ST-segment elevation myocardial infarction and ventricular tachycardia respectively.
A: 12-lead electrocardiogram one month earlier showing sinus rhythm with a ventricular rate of 90 beats per minute, left axis deviation, pathologic Q waves with 2-3 mm ST-segment elevation in inferior leads (III > II) and avF, and reciprocal ST depression in I and avL; B: 12-lead electrocardiogram showing ventricular tachycardia (VT) with a left bundle branch block morphology, ventricular rate of 150 beats per minute, left superior axis, poor precordial R wave progression, V2 transition suggesting inferoseptal origin of scar-related VT.
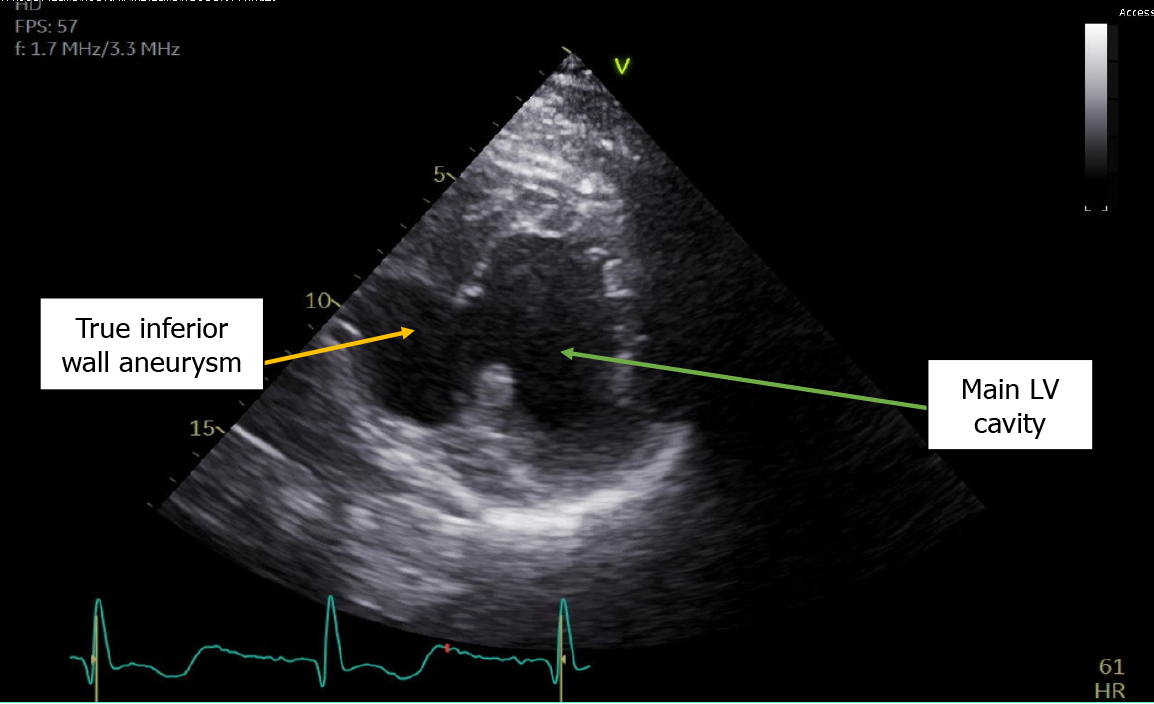
Figure 2 A large inferior wall left ventricle aneurysm shown on transthoracic echocardiography parasternal short-axis view in mid-diastole.
LV: Left ventricle.
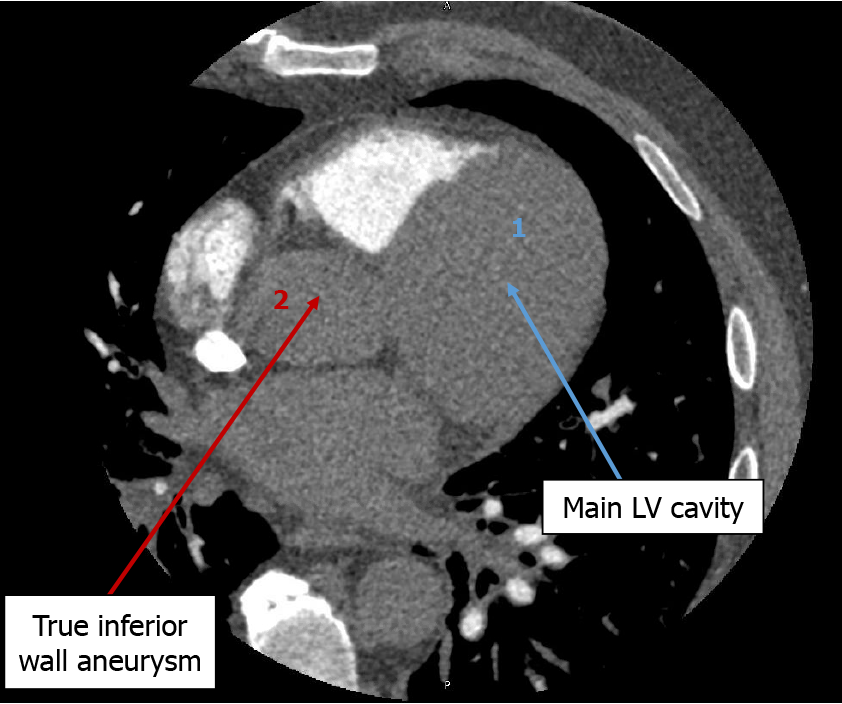
Figure 3 Coronary computed tomography angiography.
Still axial coronary computed tomography images reveal an enlarged left ventricle (LV) (1) identified by the blue arrow and a true infero-basal wall LV aneurysm (2) identified by the red arrow significantly reducing aortic ejection LV stroke volume. LV: Left ventricle.
Figure 4 3-D reconstruction of the computed tomography angiography images with the anteroposterior and posteroanterior views in the systolic phase demonstrating an aneurysm (orange arrow) in the inferior wall’s basal region.
A: Anteroposterior; B: Posteroanterior.
- Citation: Anuforo A, Charlamb J, Draytsel D, Charlamb M. Massive inferior wall aneurysm presenting with ventricular tachycardia and refractory cardiomyopathy requiring multiple interventions: A case report. World J Cardiol 2024; 16(6): 363-369
- URL: https://www.wjgnet.com/1949-8462/full/v16/i6/363.htm
- DOI: https://dx.doi.org/10.4330/wjc.v16.i6.363


