Copyright
©The Author(s) 2024.
World J Cardiol. May 26, 2024; 16(5): 274-281
Published online May 26, 2024. doi: 10.4330/wjc.v16.i5.274
Published online May 26, 2024. doi: 10.4330/wjc.v16.i5.274
Figure 1 Method of measuring mitral chordae tendineae length.
A: The cA was identified after obtaining an overall view of the mitral valve structure on a three-dimensional (3D) image created on the workstation; B: The attachment sites of the cA valve leaflet and papillary muscle were marked on the 3D image, and the marks in the corresponding positions were shown on the two-dimensional (2D)-multi-planar reformatting (MPR) image. The angle of the cross-section was adjusted so that the two marks appear simultaneously in the 2D-MPR image in three directions; C: The distance between the marks in the 2D-MPR image was measured using the measurement tool. The above procedure was also performed for the primary chordae tendineae from the posterior papillary muscle to the A2-3 region, and measurements were made over 11 time phases from 0% to 50%. White arrow: The primary chordae tendineae from the anterior papillary muscle to the A1-2 region (cA). LA: Left atrium; LV: Left ventricle; APM: Anterior papillary muscle; PPM: Posterior papillary muscle; MV: Mitral valve; AC: Anterior commissure; PC: Posterior commissure.
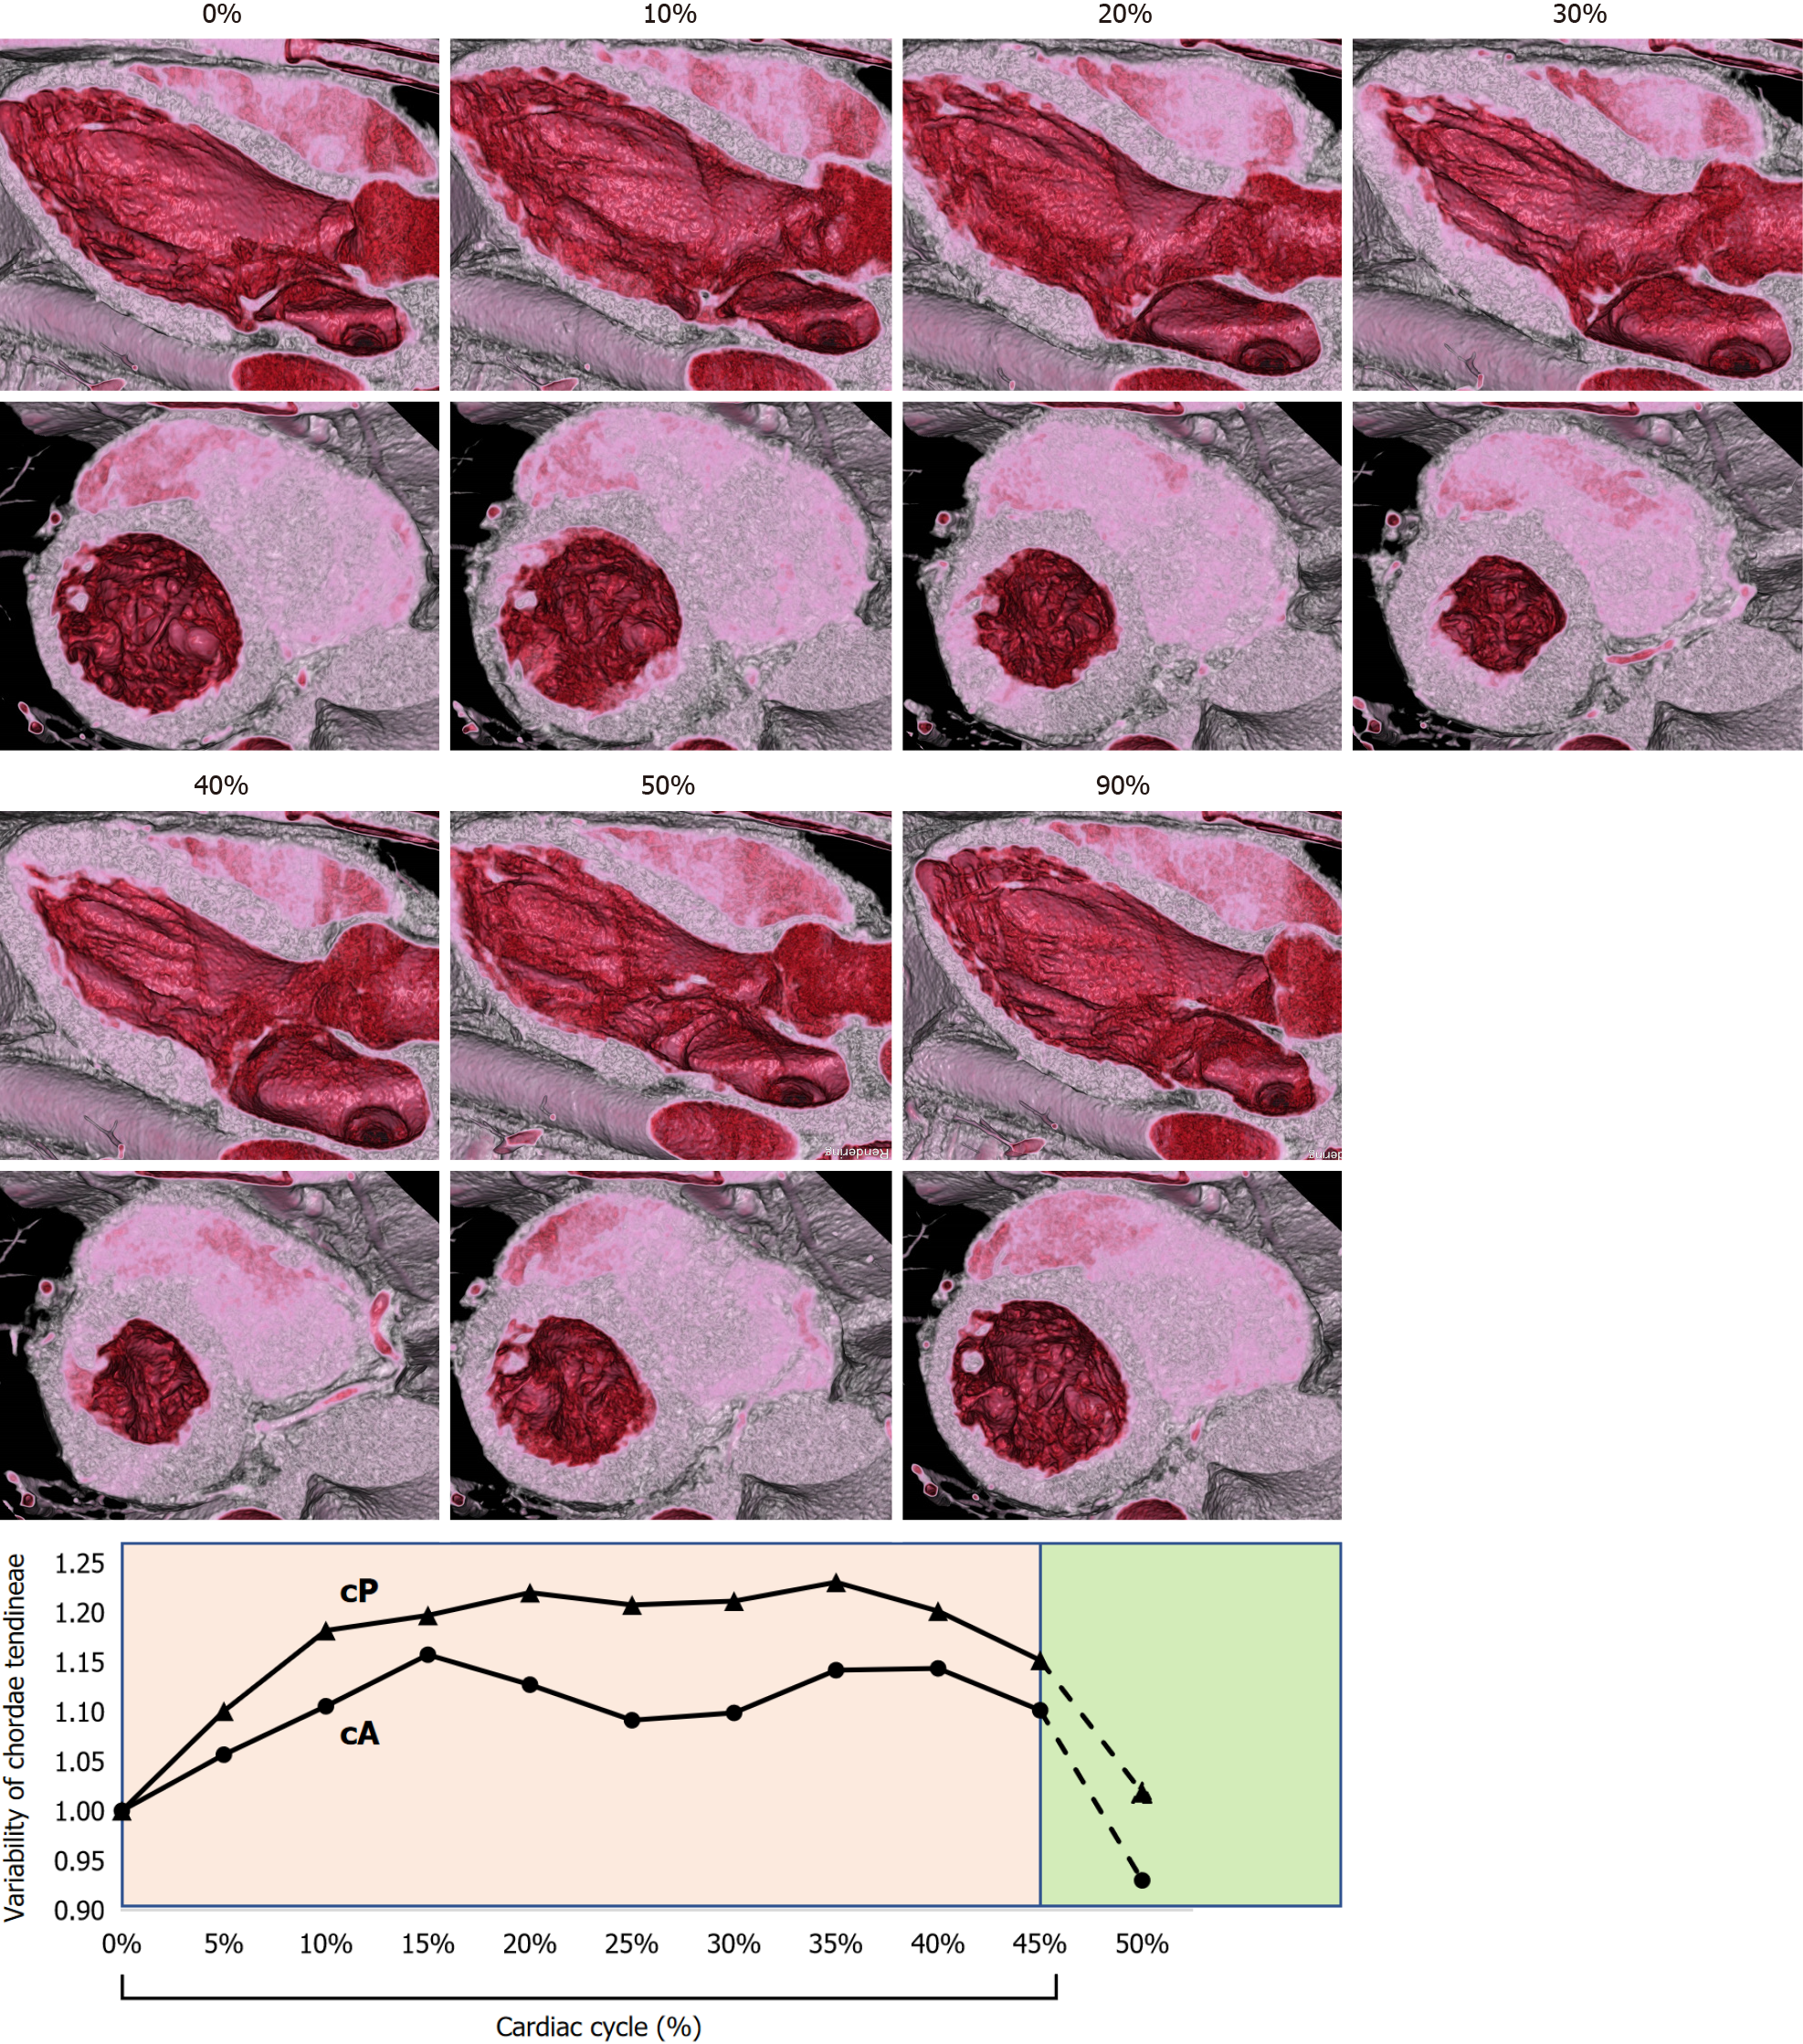
Figure 2 Variability of the mitral valve primary chordae tendineae during systole.
The primary chordae tendineae from the posterior papillary muscle to the A2-3 region (cP) plateaued at 15%. The primary chordae tendineae from the anterior papillary muscle to the A1-2 region (cA) peaked at 15%, then shortened slightly and again peaked toward end-systole. 0-40%: Systole, 45-100%: Diastole.
- Citation: Mori T, Matsushita S, Morita T, Abudurezake A, Mochizuki J, Amano A. Evaluation of mitral chordae tendineae length using four-dimensional computed tomography. World J Cardiol 2024; 16(5): 274-281
- URL: https://www.wjgnet.com/1949-8462/full/v16/i5/274.htm
- DOI: https://dx.doi.org/10.4330/wjc.v16.i5.274


