Copyright
©The Author(s) 2023.
World J Cardiol. Jun 26, 2023; 15(6): 293-308
Published online Jun 26, 2023. doi: 10.4330/wjc.v15.i6.293
Published online Jun 26, 2023. doi: 10.4330/wjc.v15.i6.293
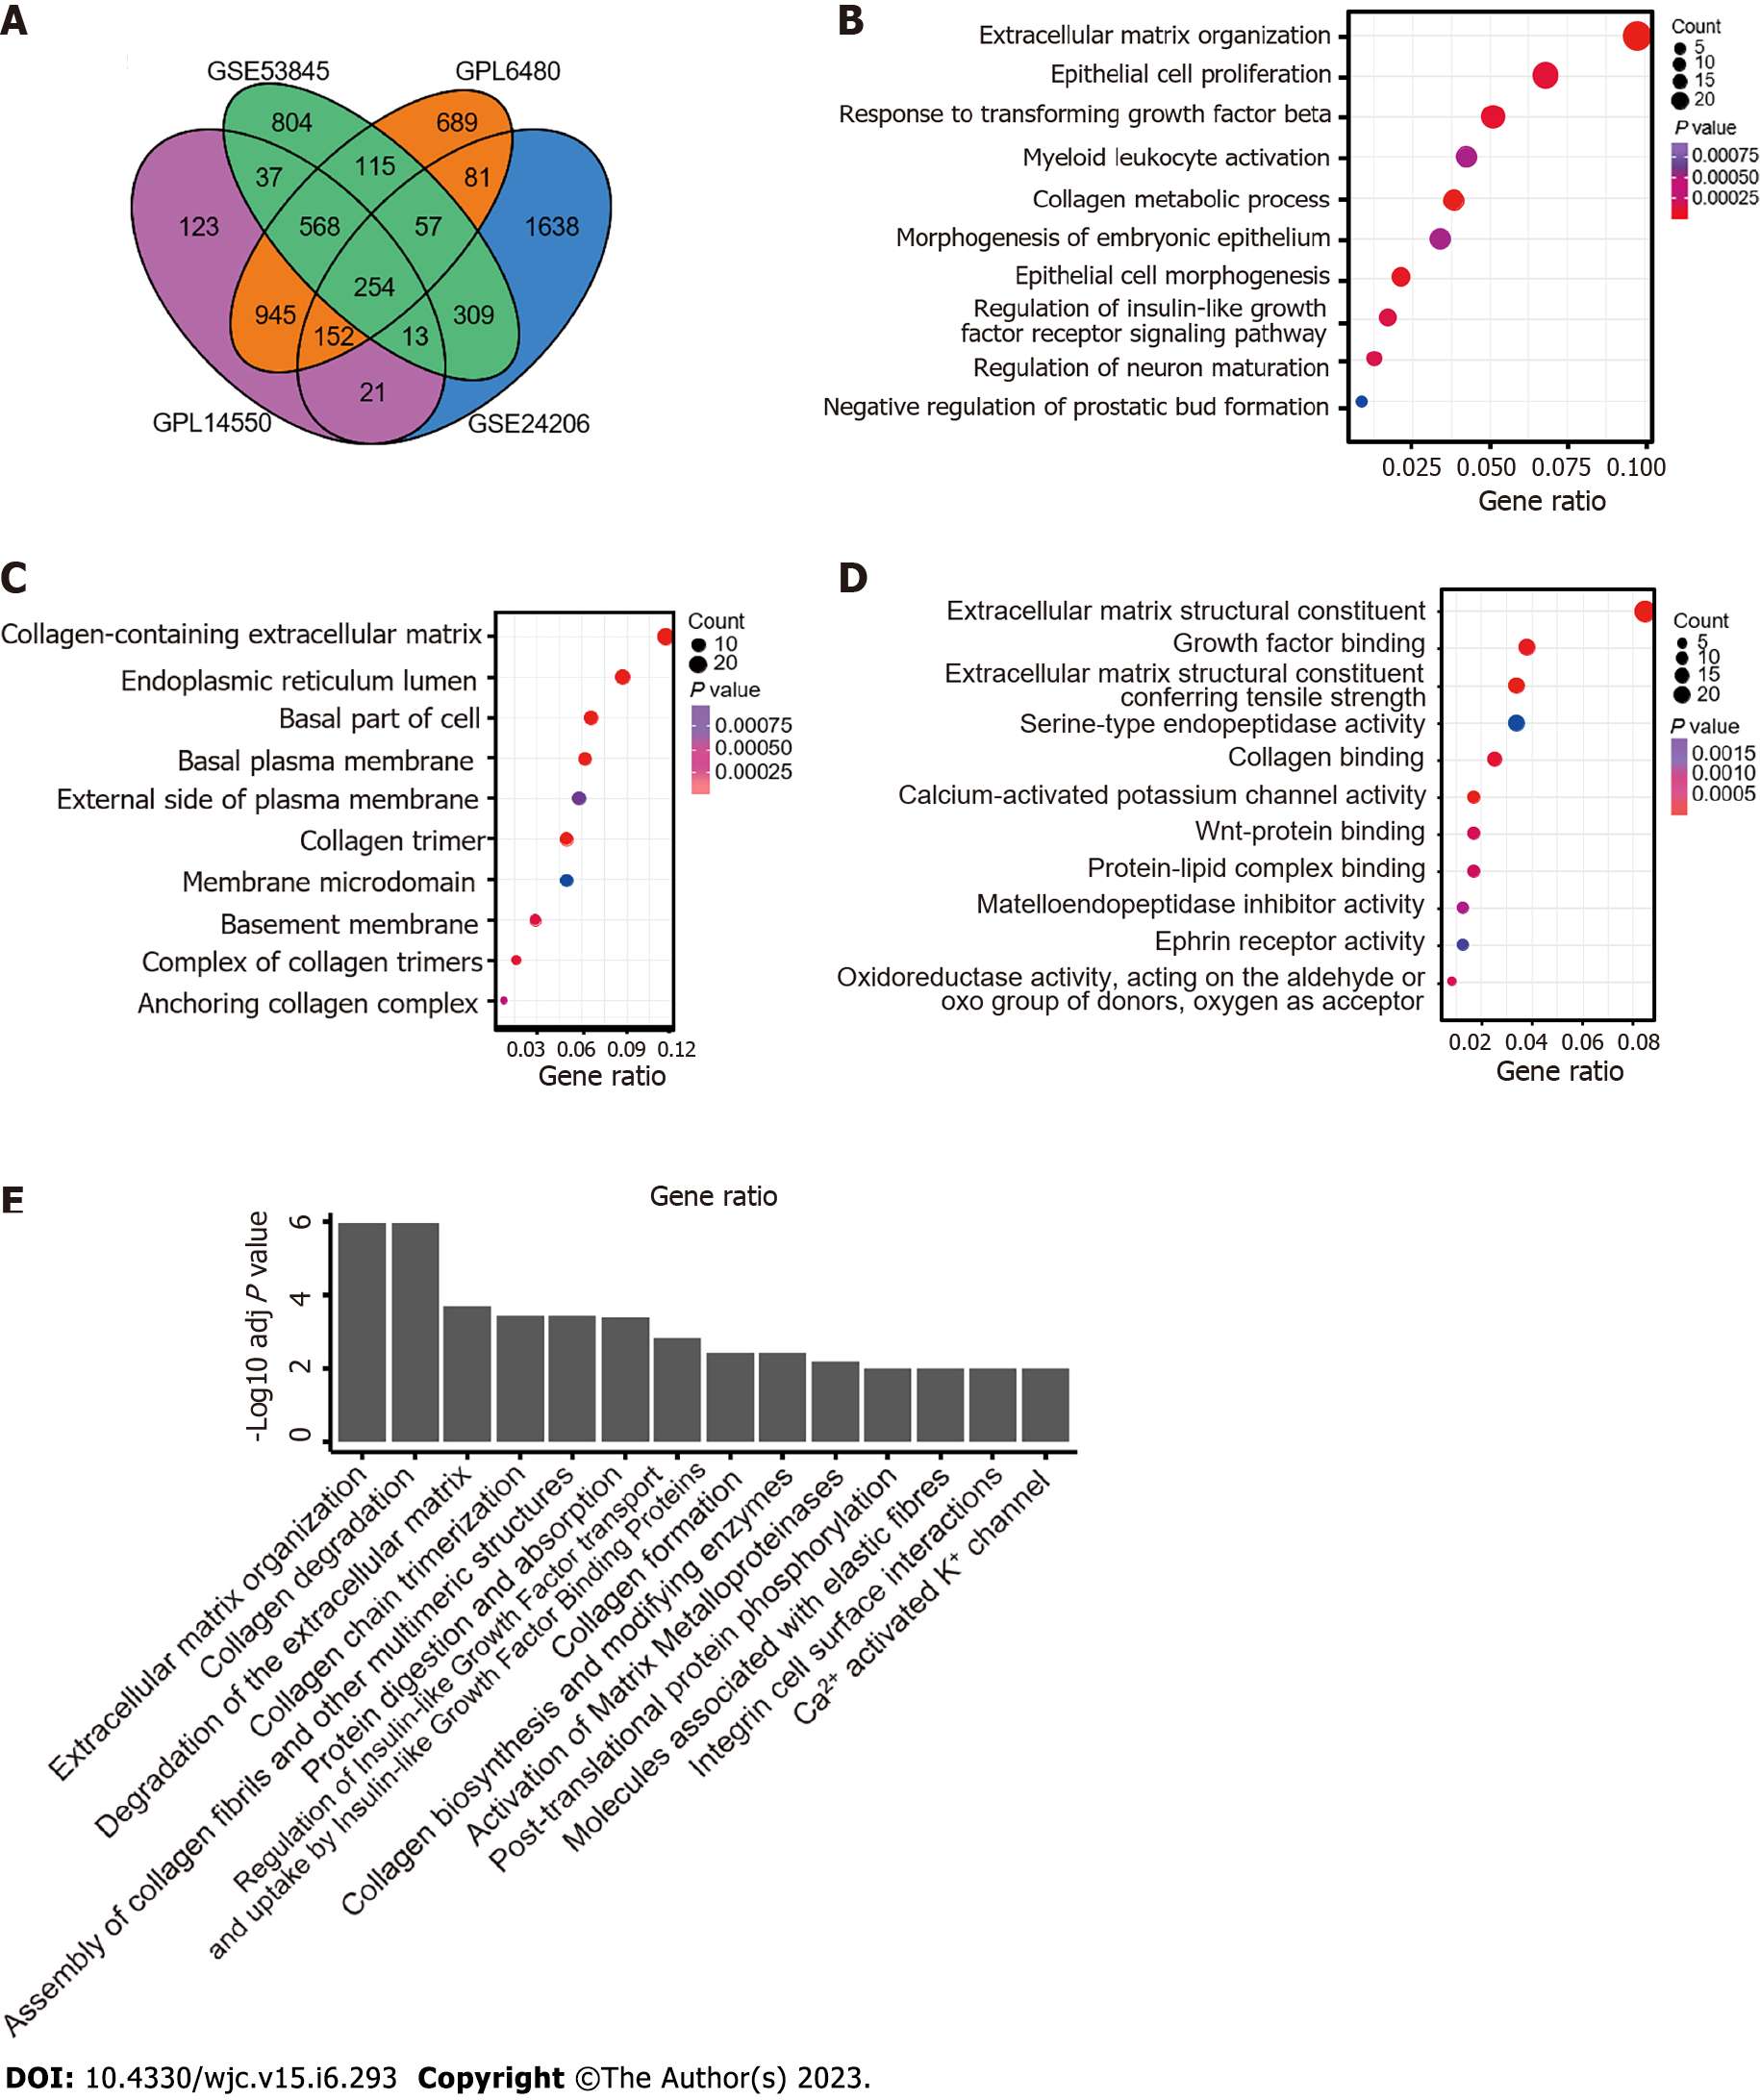
Figure 1 Identification and enrichment analysis of differentially expressed genes in idiopathic pulmonary fibrosis data compared with control data.
A: Analysis of common differentially expressed genes was performed between idiopathic pulmonary fibrosis and normal lung tissues with thresholds of P < 0.05 and fold change > 1.5 based on GSE53845, GSE47460 (GPL14550 and GPL6480), and GSE24206; B-D: Three categories of Gene Ontology analysis: Biological processes, cell components, and molecular functions; E: Kyoto Encyclopedia of Genes and Genomes and Reactome pathway analysis.
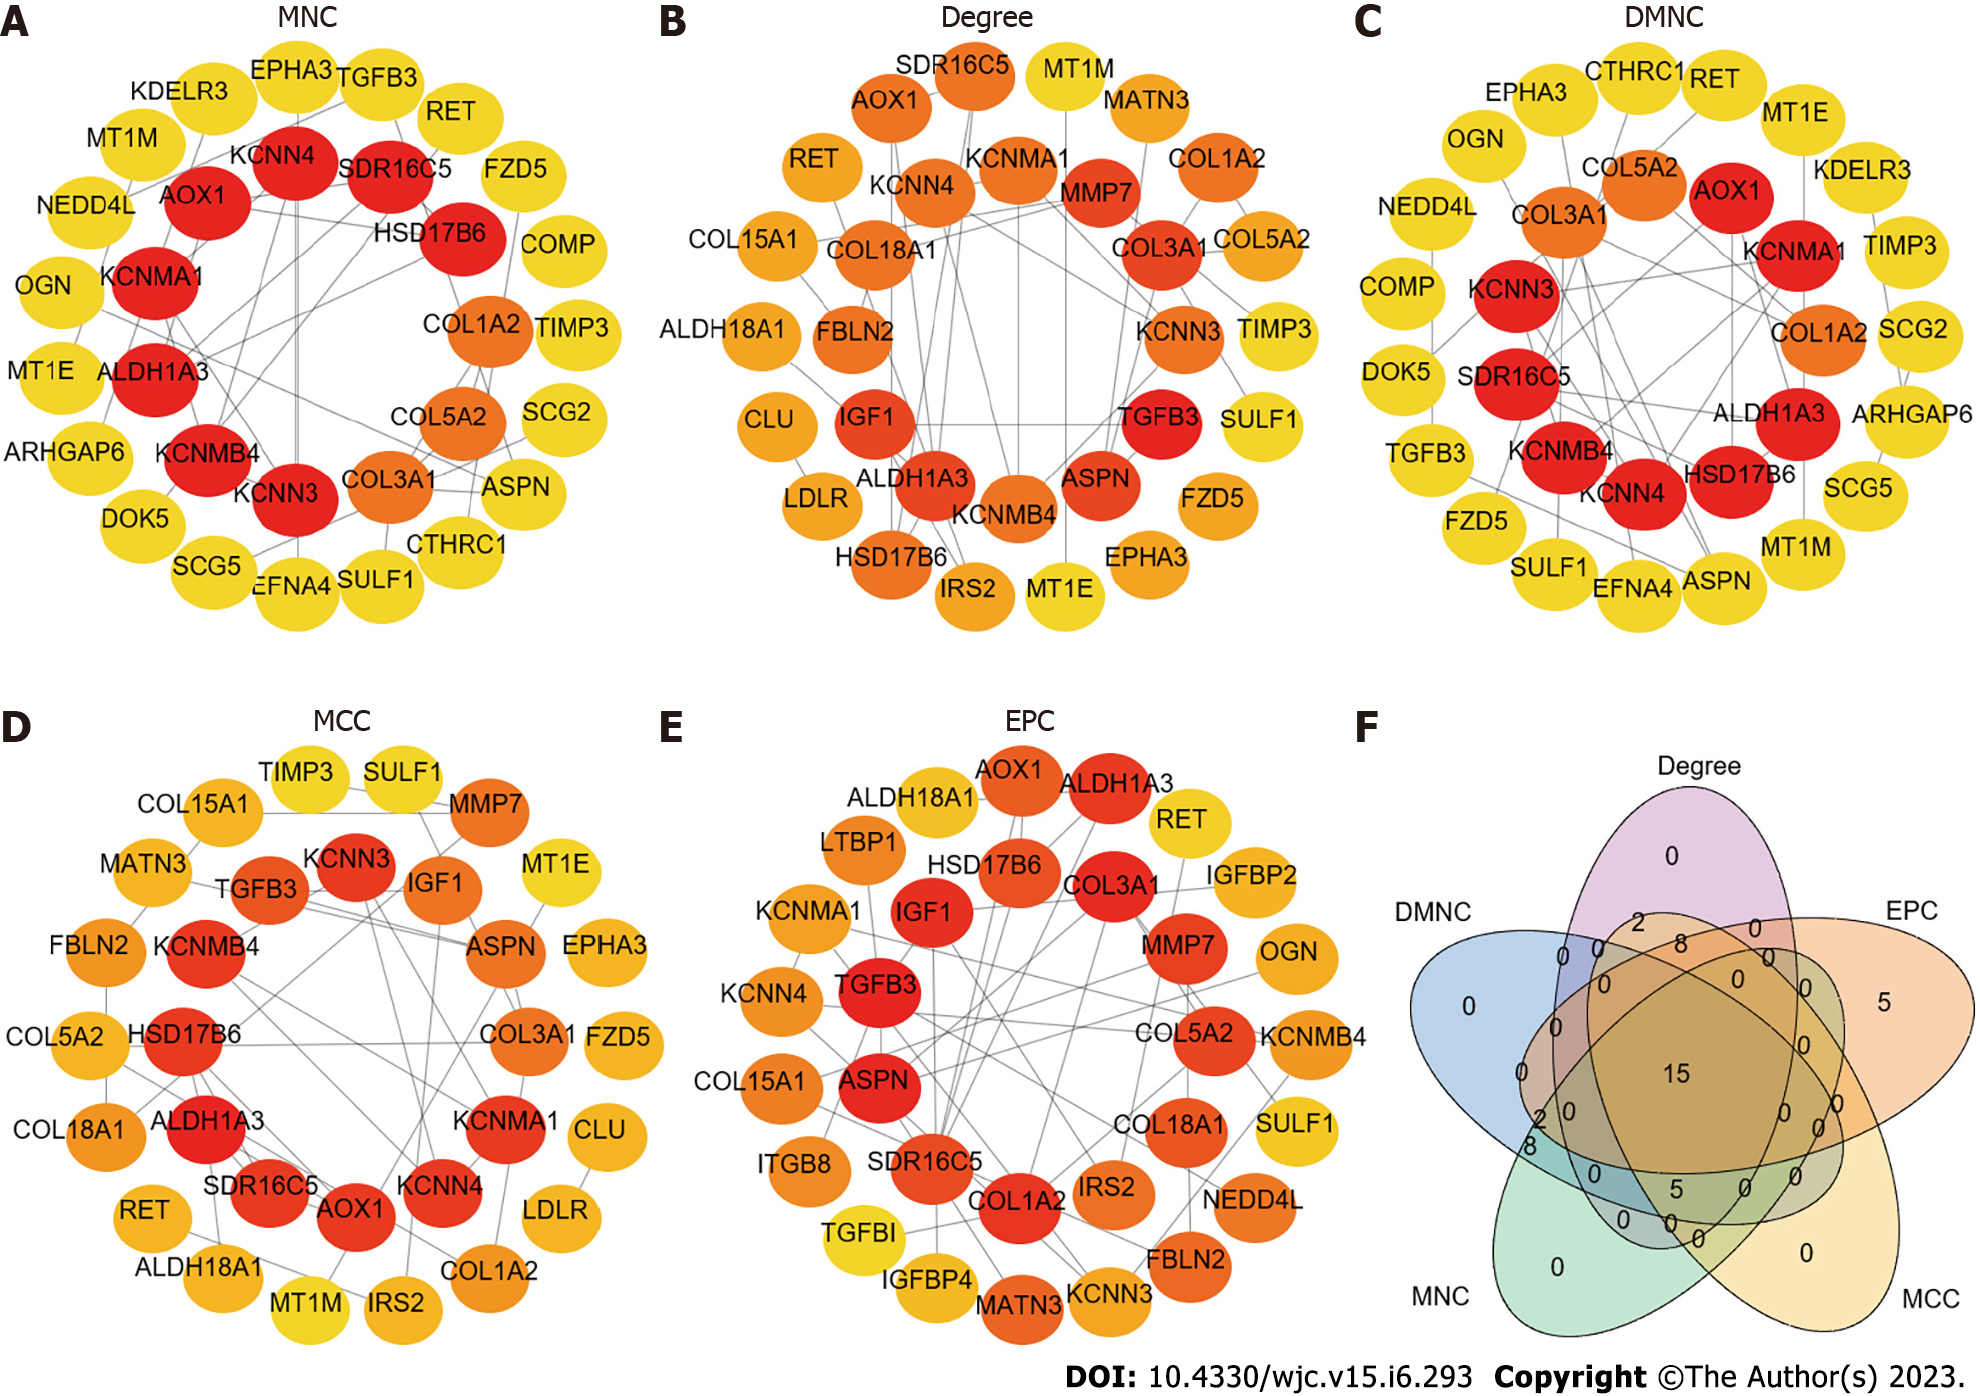
Figure 2 Hub genes identified by maximum neighbourhood component, Degree, density of maximum neighbourhood component, maximal clique centrality, edge percolated component, venn diagram of hub genes.
A: Maximum neighbourhood component; B: Degree; C: Density of maximum neighbourhood component; D: Maximal clique centrality; E: Edge percolated component; F: Venn diagram. The 15 hub genes were RET, TGFB3, HSD17B6, SULF1, ASPN, SDR16C5, ALDH1A3, COL3A1, COL1A2, KCNMA1, COL5A2, KCNMB4, AOX1, KCNN3, and KCNN4.
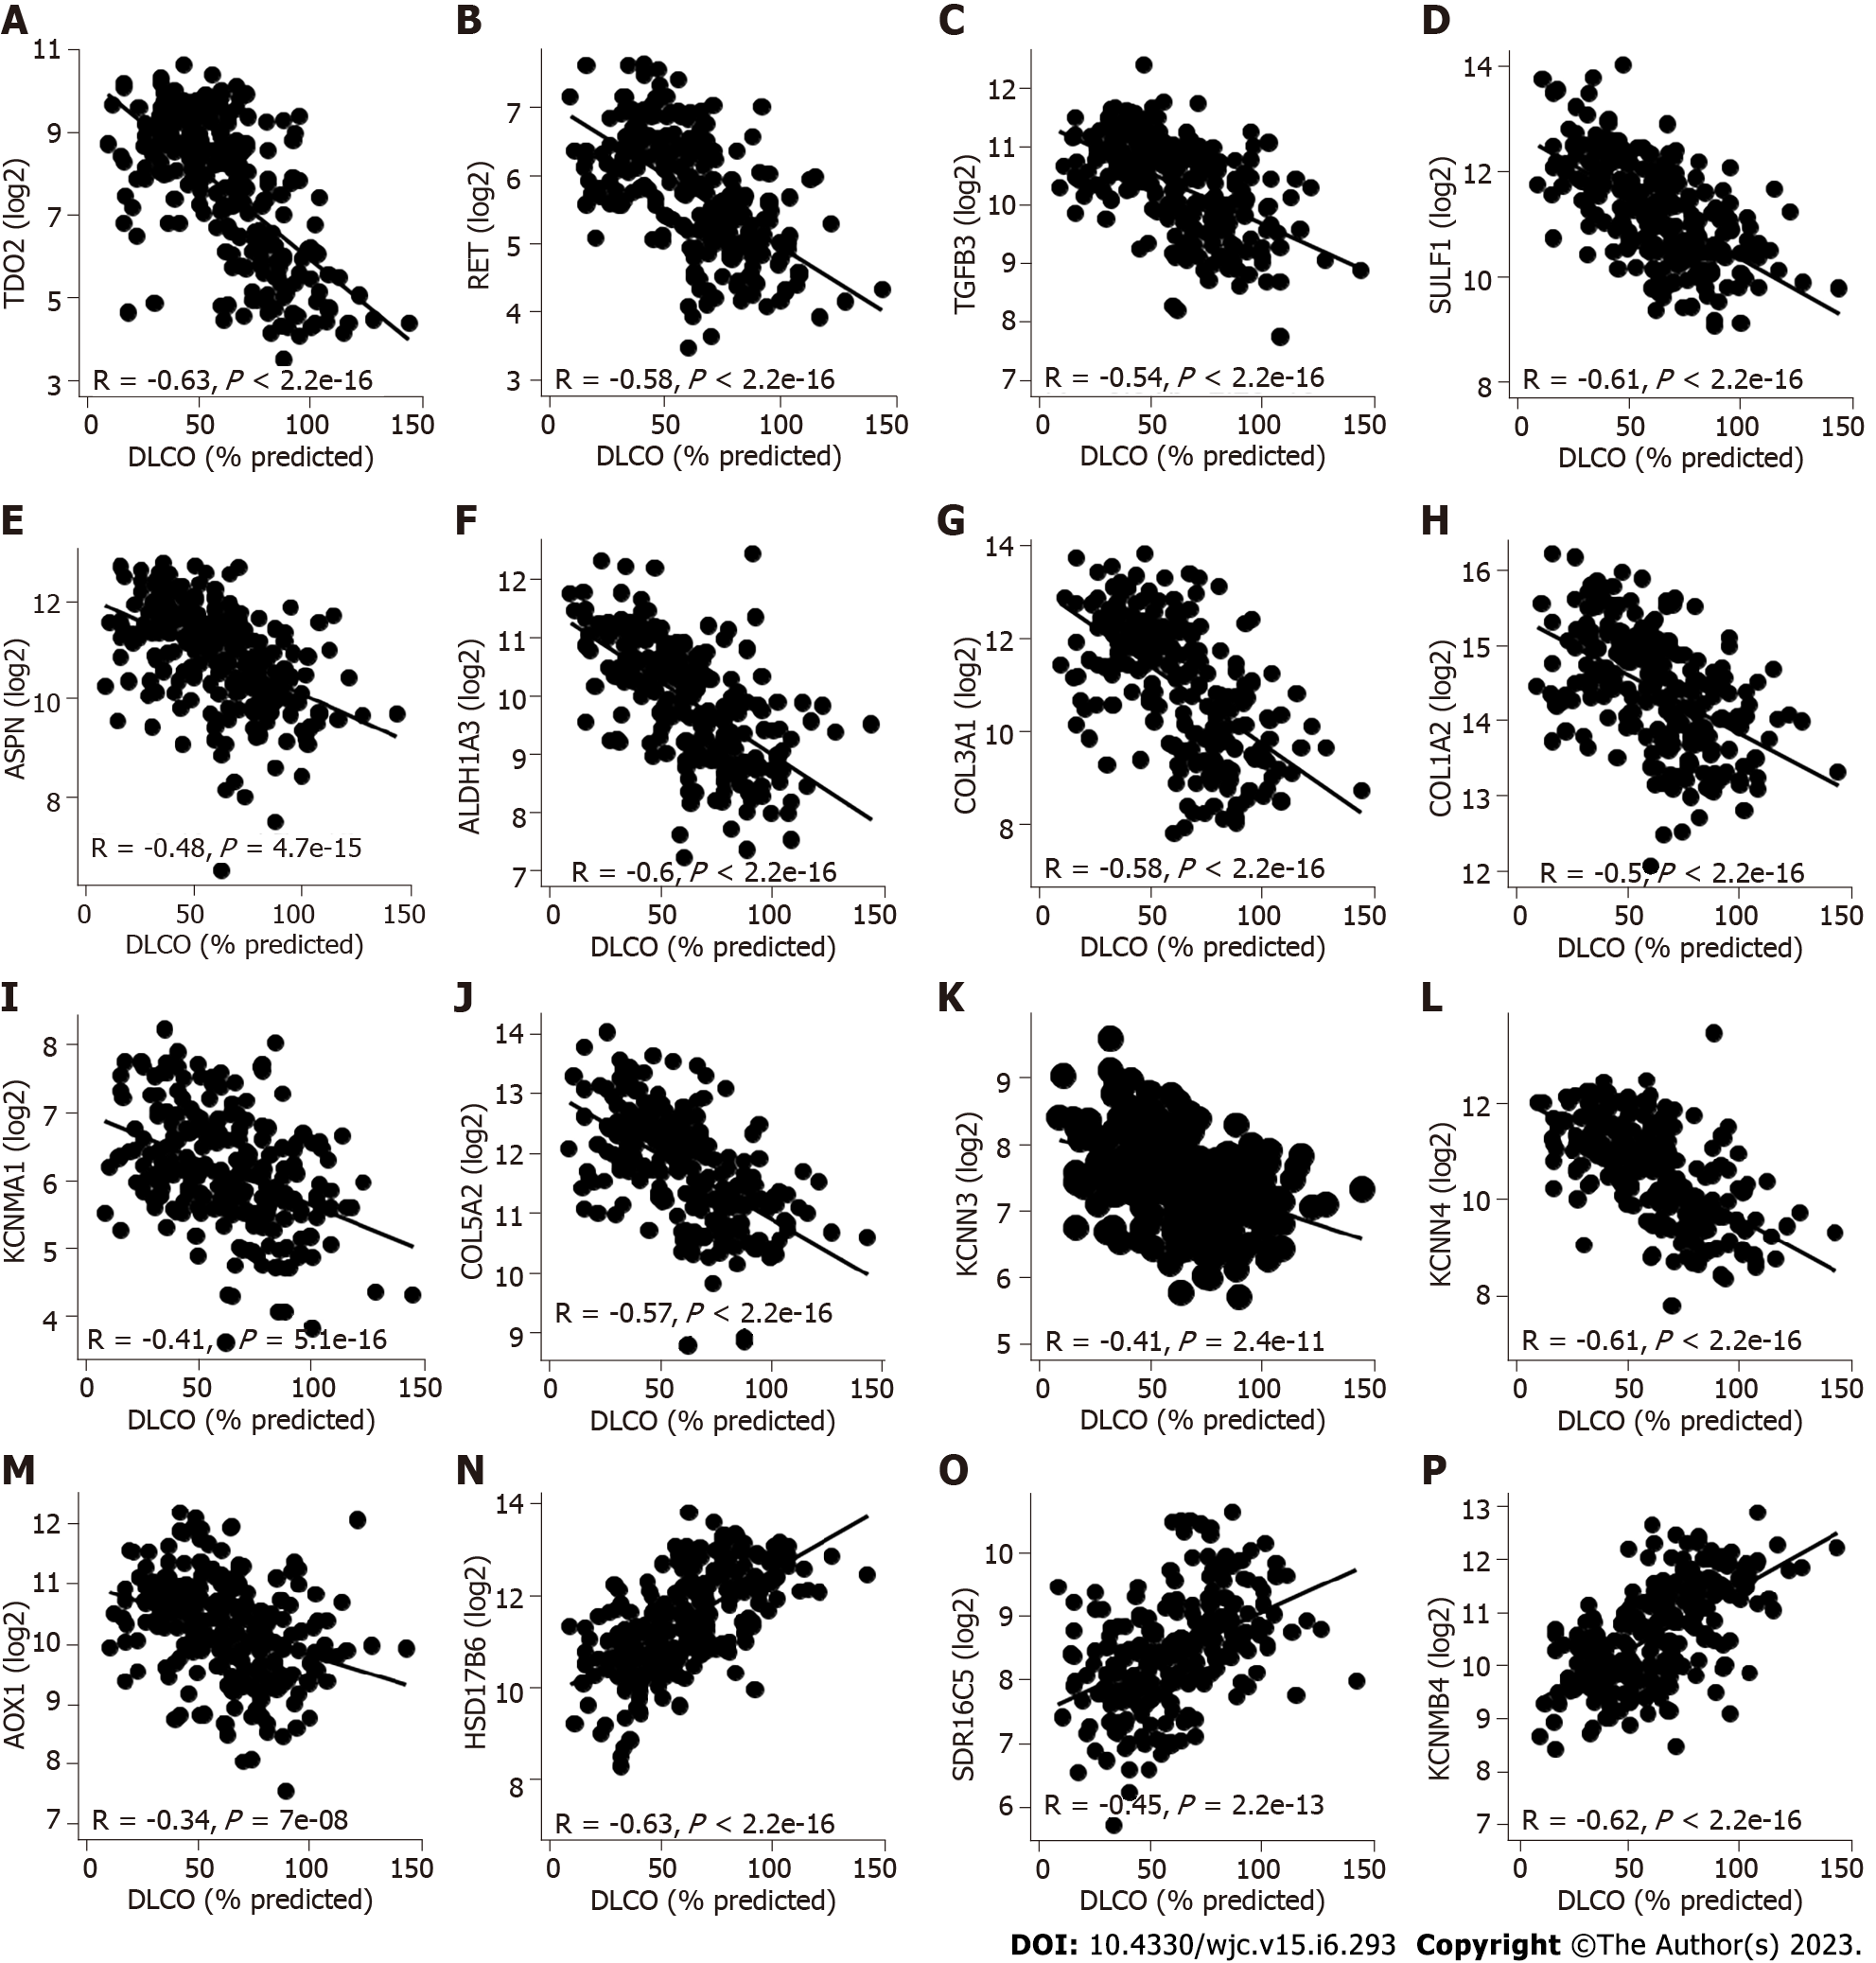
Figure 3 Correlations between lung gene expression and forced vital capacity and diffusing capacity.
A-M: TDO2, RET, TGFB3, SULF1, ASPN, ALDH1A3, COL3A1, COL1A2, KCNMA1, COL5A2, KCNN3, KCNN4 and AOX1 expression was negatively correlated with diffusing capacity of carbon monoxide (DLCO); N-P: HSD17B6, SDR16C5, and KCNMB4 were significantly positively correlated with DLCO. The Pearson correlation metric was computed by using the ‘stat_cor’ function in R. DLCO: Diffusing capacity of carbon monoxide.
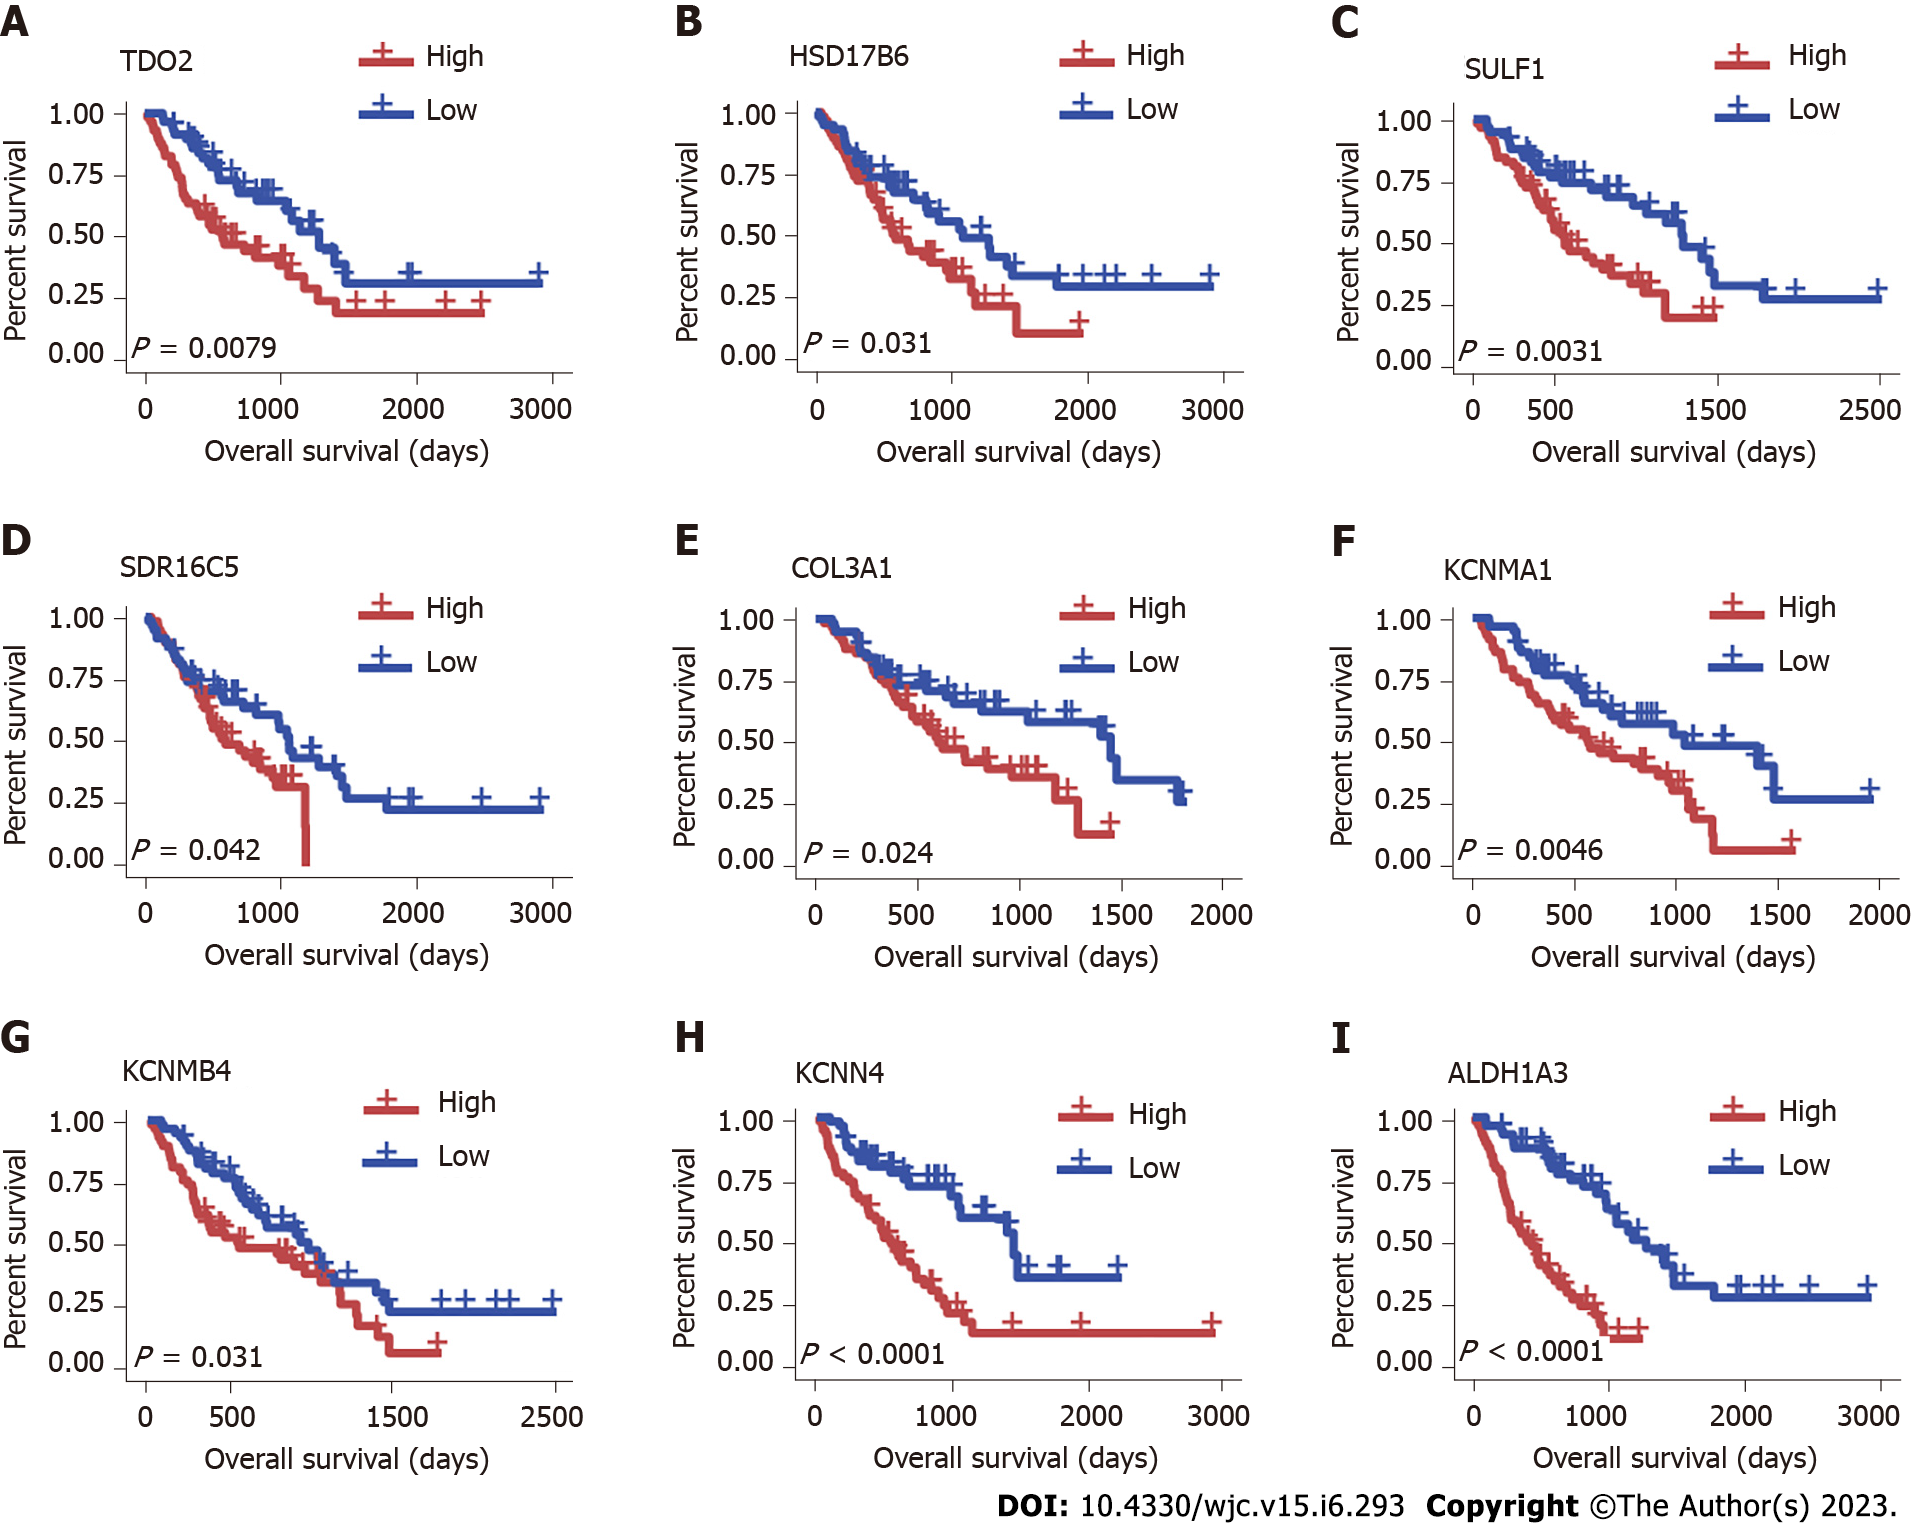
Figure 4 Survival analysis of overlapping hub genes.
Overall survival curves show that higher expression of TDO2, HSD17B6, SULF1, SDR16C5, COL3A1, KCNMA1, KCNMB4, KCNN4 and ALADH1A3 is associated with a worse survival rate. A: TDO2; B: HSD17B6; C: SULF1; D: SDR16C5; E: COL3A1; F: KCNMA1; G: KCNMB4; H: KCNN4; I: ALADH1A3.
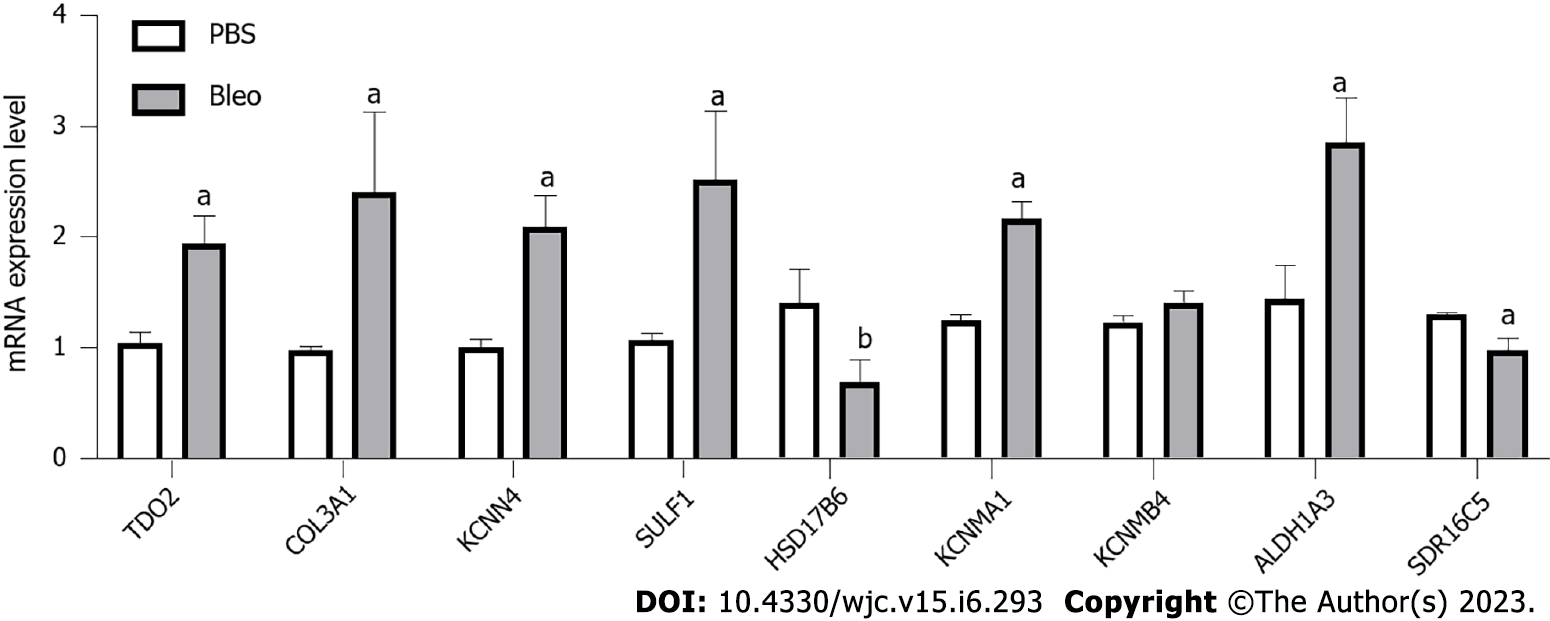
Figure 5 mRNA expression levels of TDO2, COL3A1, KCNN4, SULF1, HSD17B6, KCNMA1, KCNMB4, ALDH1A3, and SDR16C5 in the lung tissue vs PBS (n = 5 for PBS group, n = 5 for Bleo group).
The statistical test used was the t test. Data are expressed as the mean with SD. aP < 0.01, bP < 0.05.
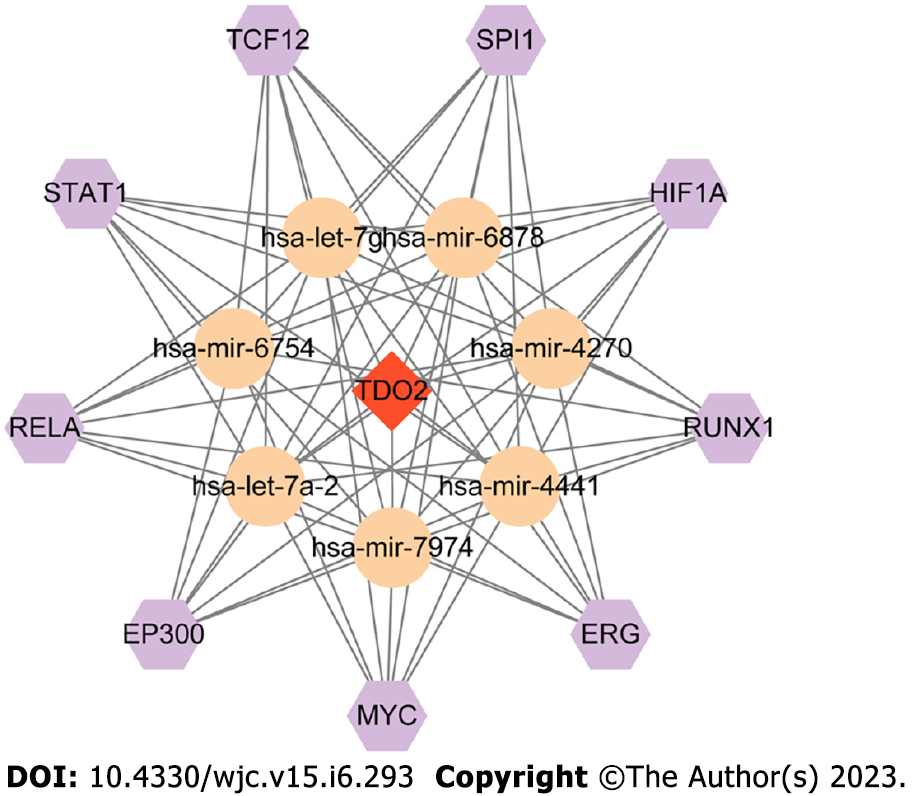
Figure 6 Transcription factors-miRNA-mRNA regulatory network.
Transcription factors, miRNA, and mRNA are represented by hexagons, circles, and diamonds, respectively.
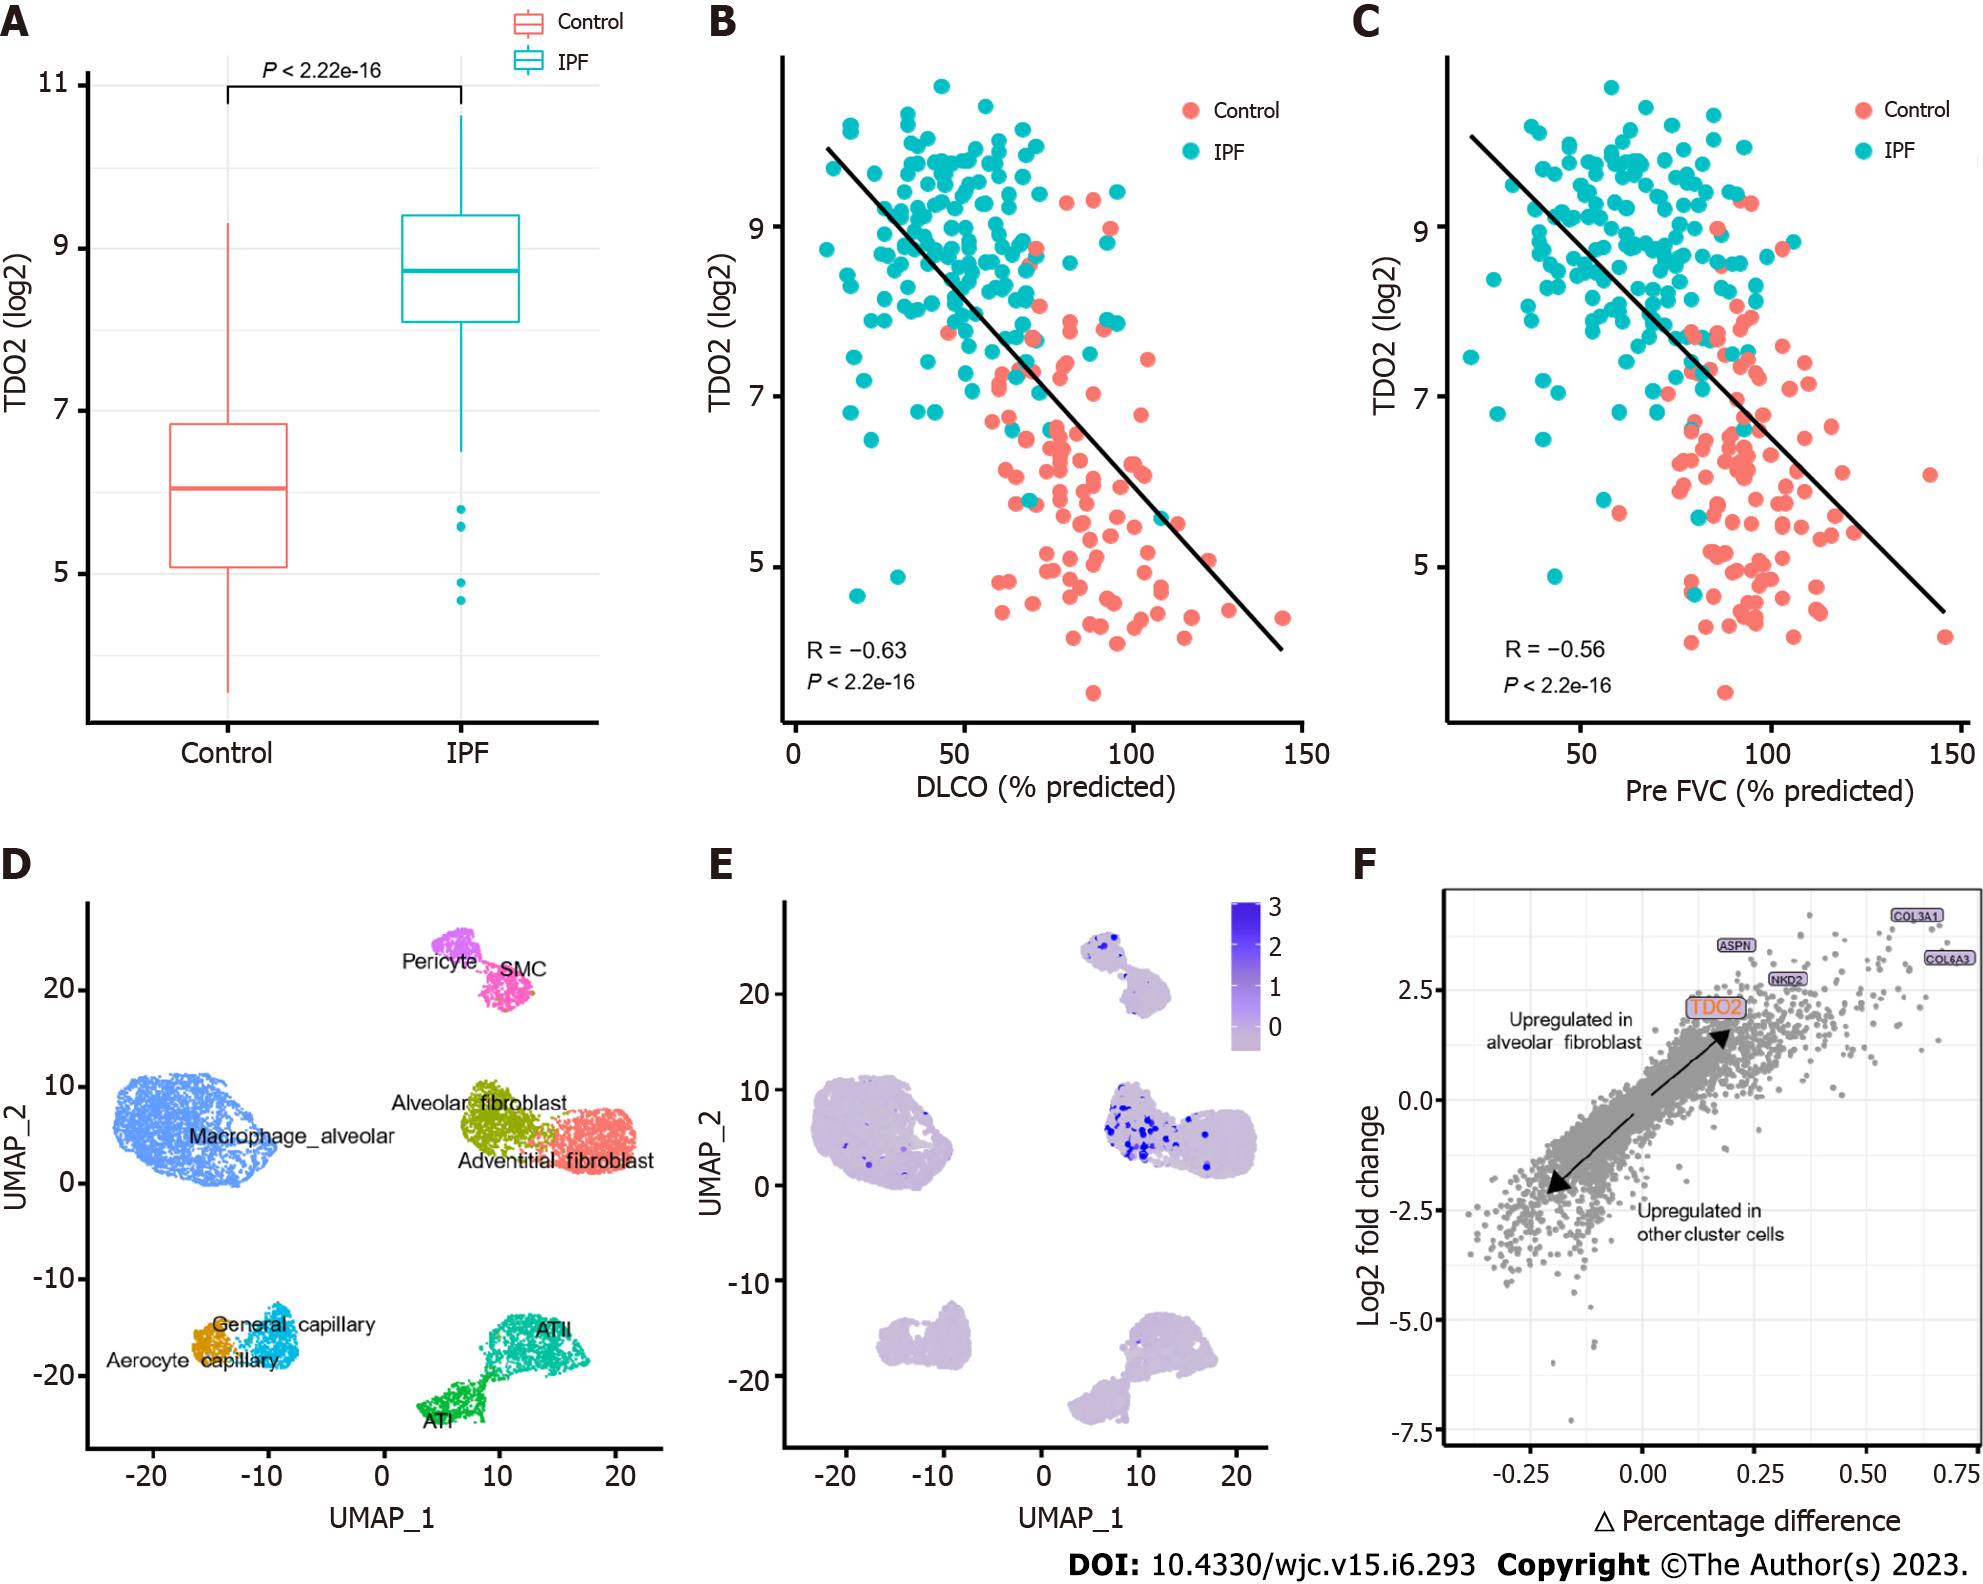
Figure 7 TDO2 increased in Idiopathic pulmonary fibrosis and was validated in scRNA-seq data.
A: Upregulation of TDO2 in Idiopathic pulmonary fibrosis of trained data (e.g., in GSE47460). The statistical test used was the t test; B and C: Correlations between lung TDO2 expression and diffusing capacity of carbon monoxide (B) and forced vital capacity (C) in GSE47460. The Pearson correlation metric was computed by using the ‘stat_cor’ function in R; D: UMAP of 8,942 randomly selected resident lung parenchymal cells from GSE136831; E: UMAP with cells labelled by normalized TDO2 expression; F: Differential gene expression analysis using the log-fold change expression vs the difference in the percentage of cells expressing the gene comparing alveolar fibroblast cluster vs other cluster cells (Δ Percentage Difference). Labelled genes have a log2-fold change > 1, Δ Percentage Difference > 20% and adjusted P value from Wilcoxon rank sum test < 0.05. DLCO: Diffusing capacity of carbon monoxide; IPF: Idiopathic pulmonary fibrosis; FVC: Forced vital capacity.
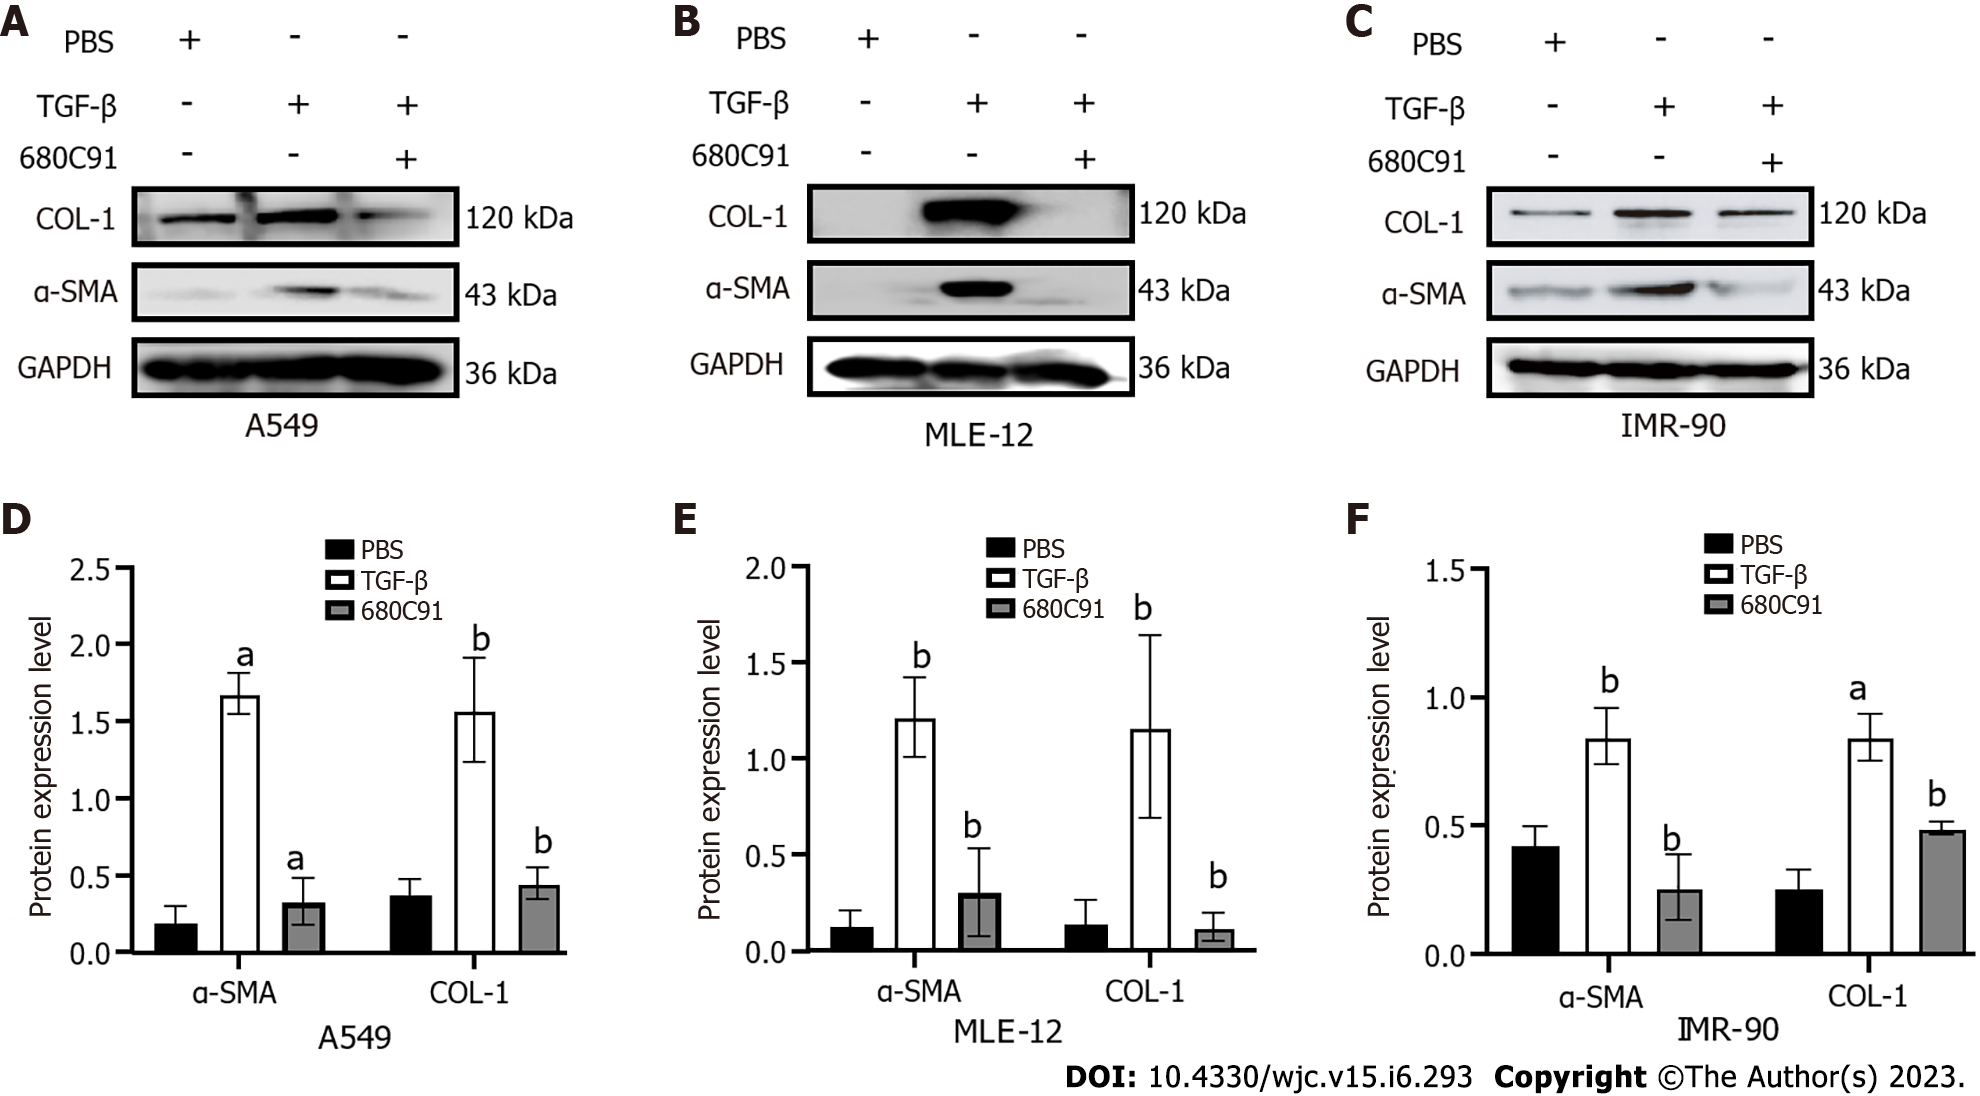
Figure 8 Western blot analysis of α-smooth muscle actin and COL-1 in A549, MLE-12, and IMR-90 cells.
Western blot quantification results in A549, MLE-12 and IMR-90 cells. A and D: A549; B and E: MLE-12; C and F: IMR-90. In line with the homogeneity of variance, the least significance difference method was used when assuming homogeneity of variance. aP < 0.01 vs phosphate-buffered saline; bP < 0.05 vs transforming growth factor-β. PBS: Phosphate-buffered saline; α-SMA: α-smooth muscle actin; TGF-β: Transforming growth factor-β.
- Citation: Wang R, Yang YM. Identification of potential biomarkers for idiopathic pulmonary fibrosis and validation of TDO2 as a potential therapeutic target. World J Cardiol 2023; 15(6): 293-308
- URL: https://www.wjgnet.com/1949-8462/full/v15/i6/293.htm
- DOI: https://dx.doi.org/10.4330/wjc.v15.i6.293


