Copyright
©The Author(s) 2023.
World J Cardiol. Nov 26, 2023; 15(11): 599-608
Published online Nov 26, 2023. doi: 10.4330/wjc.v15.i11.599
Published online Nov 26, 2023. doi: 10.4330/wjc.v15.i11.599
Figure 1 Portal vein flow in the control and heart failure groups.
A and B: Representative portal vein (PV) flow waveform in the control (A) and heart failure (HF) (B) groups at admission. Patients with HF had a pulsatile PV flow waveform. Patients in the control group had a continuous PV flow waveform with a significantly higher minimum PV velocity; C: Representative PV flow waveform in a patient with HF at discharge. At discharge, the waveform turned into a continuous pattern. HF: Heart failure; PVPR: Portal vein pulsatility ratio.
Figure 2 Changes in the portal vein pulsatility ratio from admission to discharge in patients with heart failure.
The portal vein (PV) pulsatility ratio (PVPR) was significantly decreased after the improvement in heart failure (HF) due to the significant increase in minimum PV velocity. Some patients with HF (14%) did not demonstrate an improvement in the PVPR at discharge. aP < 0.05. Solid line: PVPR decreased at discharge. Dotted line: PVPR increased at discharge. PVPR: Portal vein pulsatility ratio.
Figure 3 Kaplan–Meier curve for prognosis in patients with heart failure.
Patients with heart failure were divided into three groups according to the portal vein pulsatility ratio (PVPR) at discharge (PVPR-T1: 0 ≤ PVPR ≤ 0.08, PVPR-T2: 0.08 < PVPR ≤ 0.21, PVPR-T3: PVPR > 0.21). PVPR-T3 had a worse prognosis than the lower PVPR tertiles (log-rank test: aP < 0.05 vs PVPR-T1). PVPR: Portal vein pulsatility ratio.
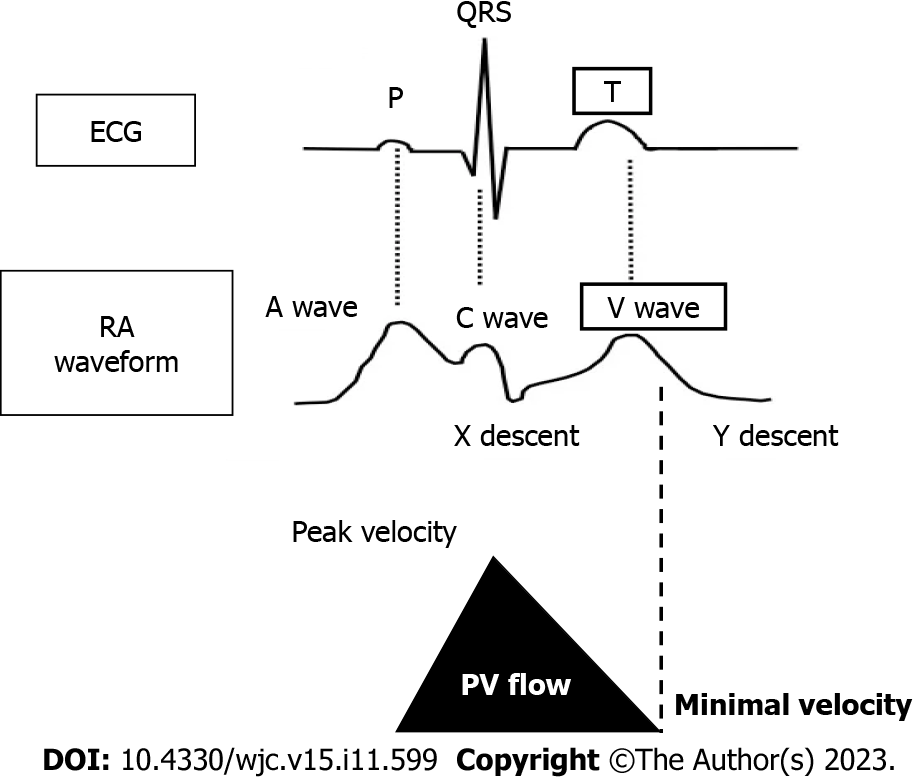
Figure 4 Relationship between electrocardiography, right atrium waveform, and portal vein flow.
The timing of minimum portal vein velocity was synchronized with the V-wave in the right atrium. ECG: Electrocardiography; RA: Right atrium; PV: Portal vein.
Figure 5 Summary of the study.
HF: Heart failure; PVPR: Portal vein pulsatility ratio.
- Citation: Kuwahara N, Honjo T, Sone N, Imanishi J, Nakayama K, Kamemura K, Iwahashi M, Ohta S, Kaihotsu K. Clinical impact of portal vein pulsatility on the prognosis of hospitalized patients with acute heart failure. World J Cardiol 2023; 15(11): 599-608
- URL: https://www.wjgnet.com/1949-8462/full/v15/i11/599.htm
- DOI: https://dx.doi.org/10.4330/wjc.v15.i11.599


