Copyright
©The Author(s) 2023.
World J Cardiol. Oct 26, 2023; 15(10): 508-517
Published online Oct 26, 2023. doi: 10.4330/wjc.v15.i10.508
Published online Oct 26, 2023. doi: 10.4330/wjc.v15.i10.508
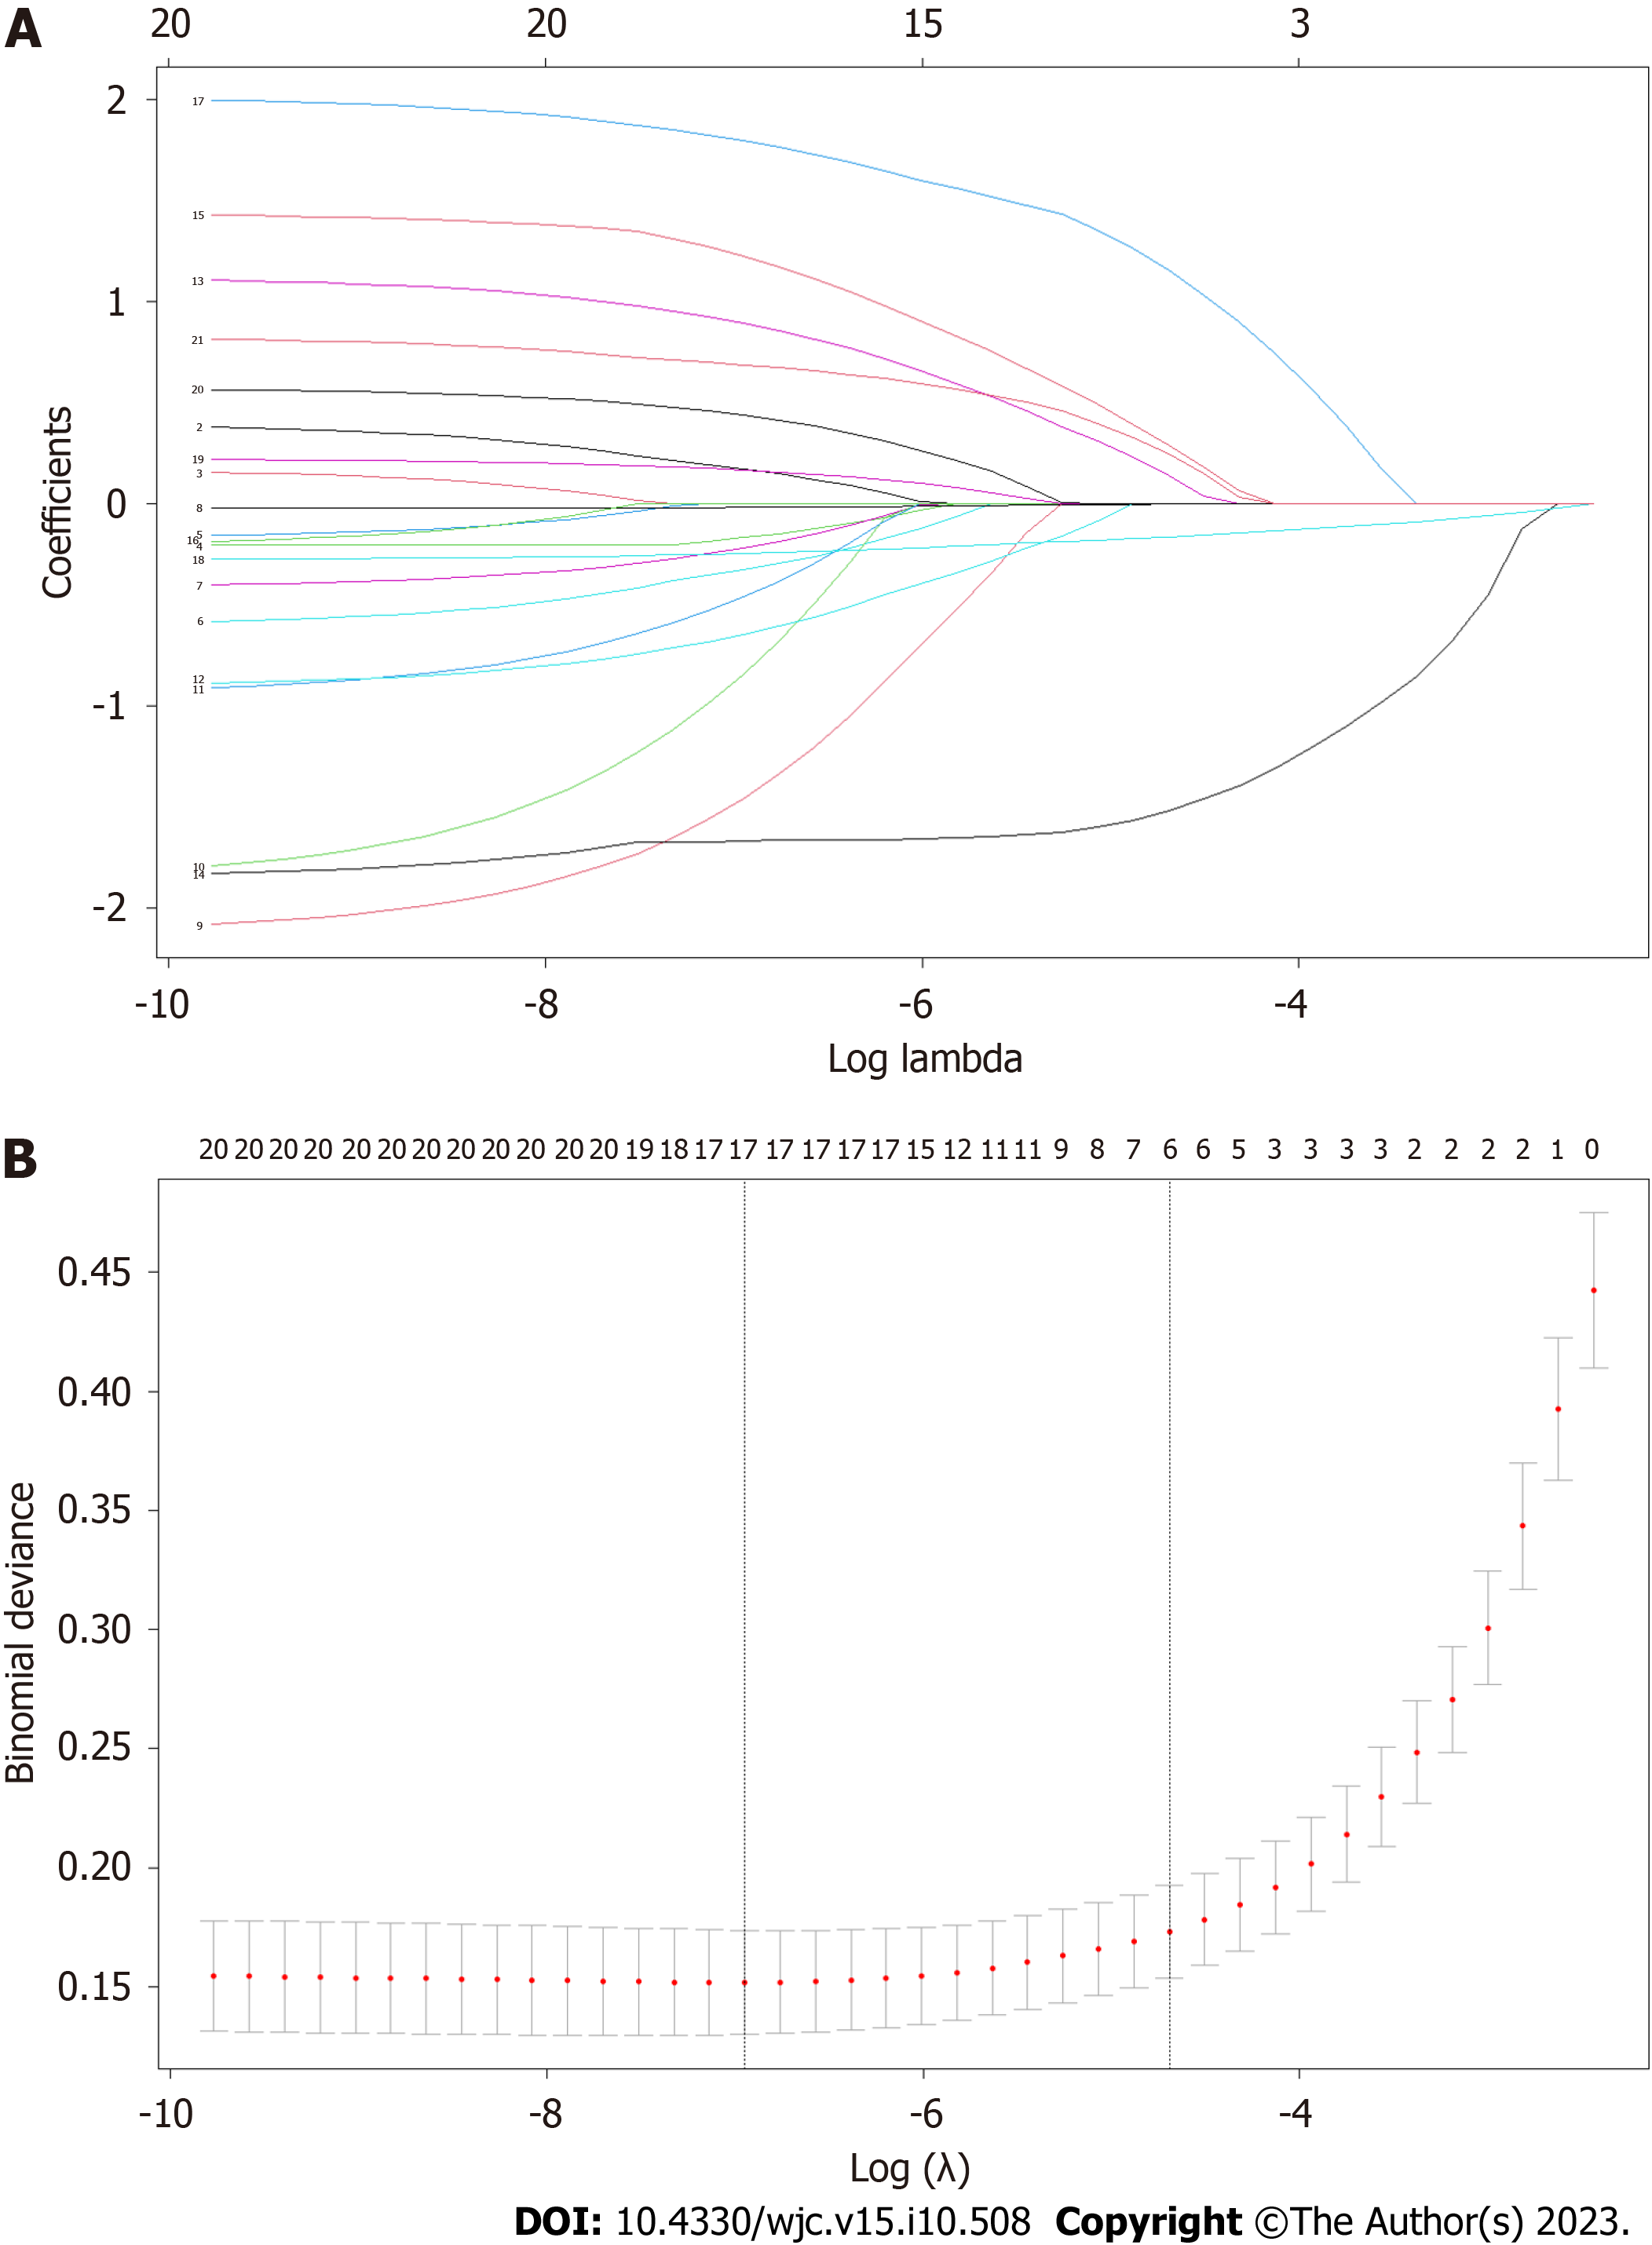
Figure 1 Factor selection of prehospital return of spontaneous circulation via least absolute shrinkage and selection operator regression.
A: Least absolute shrinkage and selection operator coefficient profiles of the 17 features. A coefficient profile plot was conducted against the log (lambda, λ) sequence; B: Through 10-fold cross-validation, and the optimal parameter (lambda, λ) selection via the minimum criteria. A partial likelihood deviance (binomial deviance) curve was plotted versus log λ. The dotted vertical line on the right was drawn at lambda.1se and four features were selected.
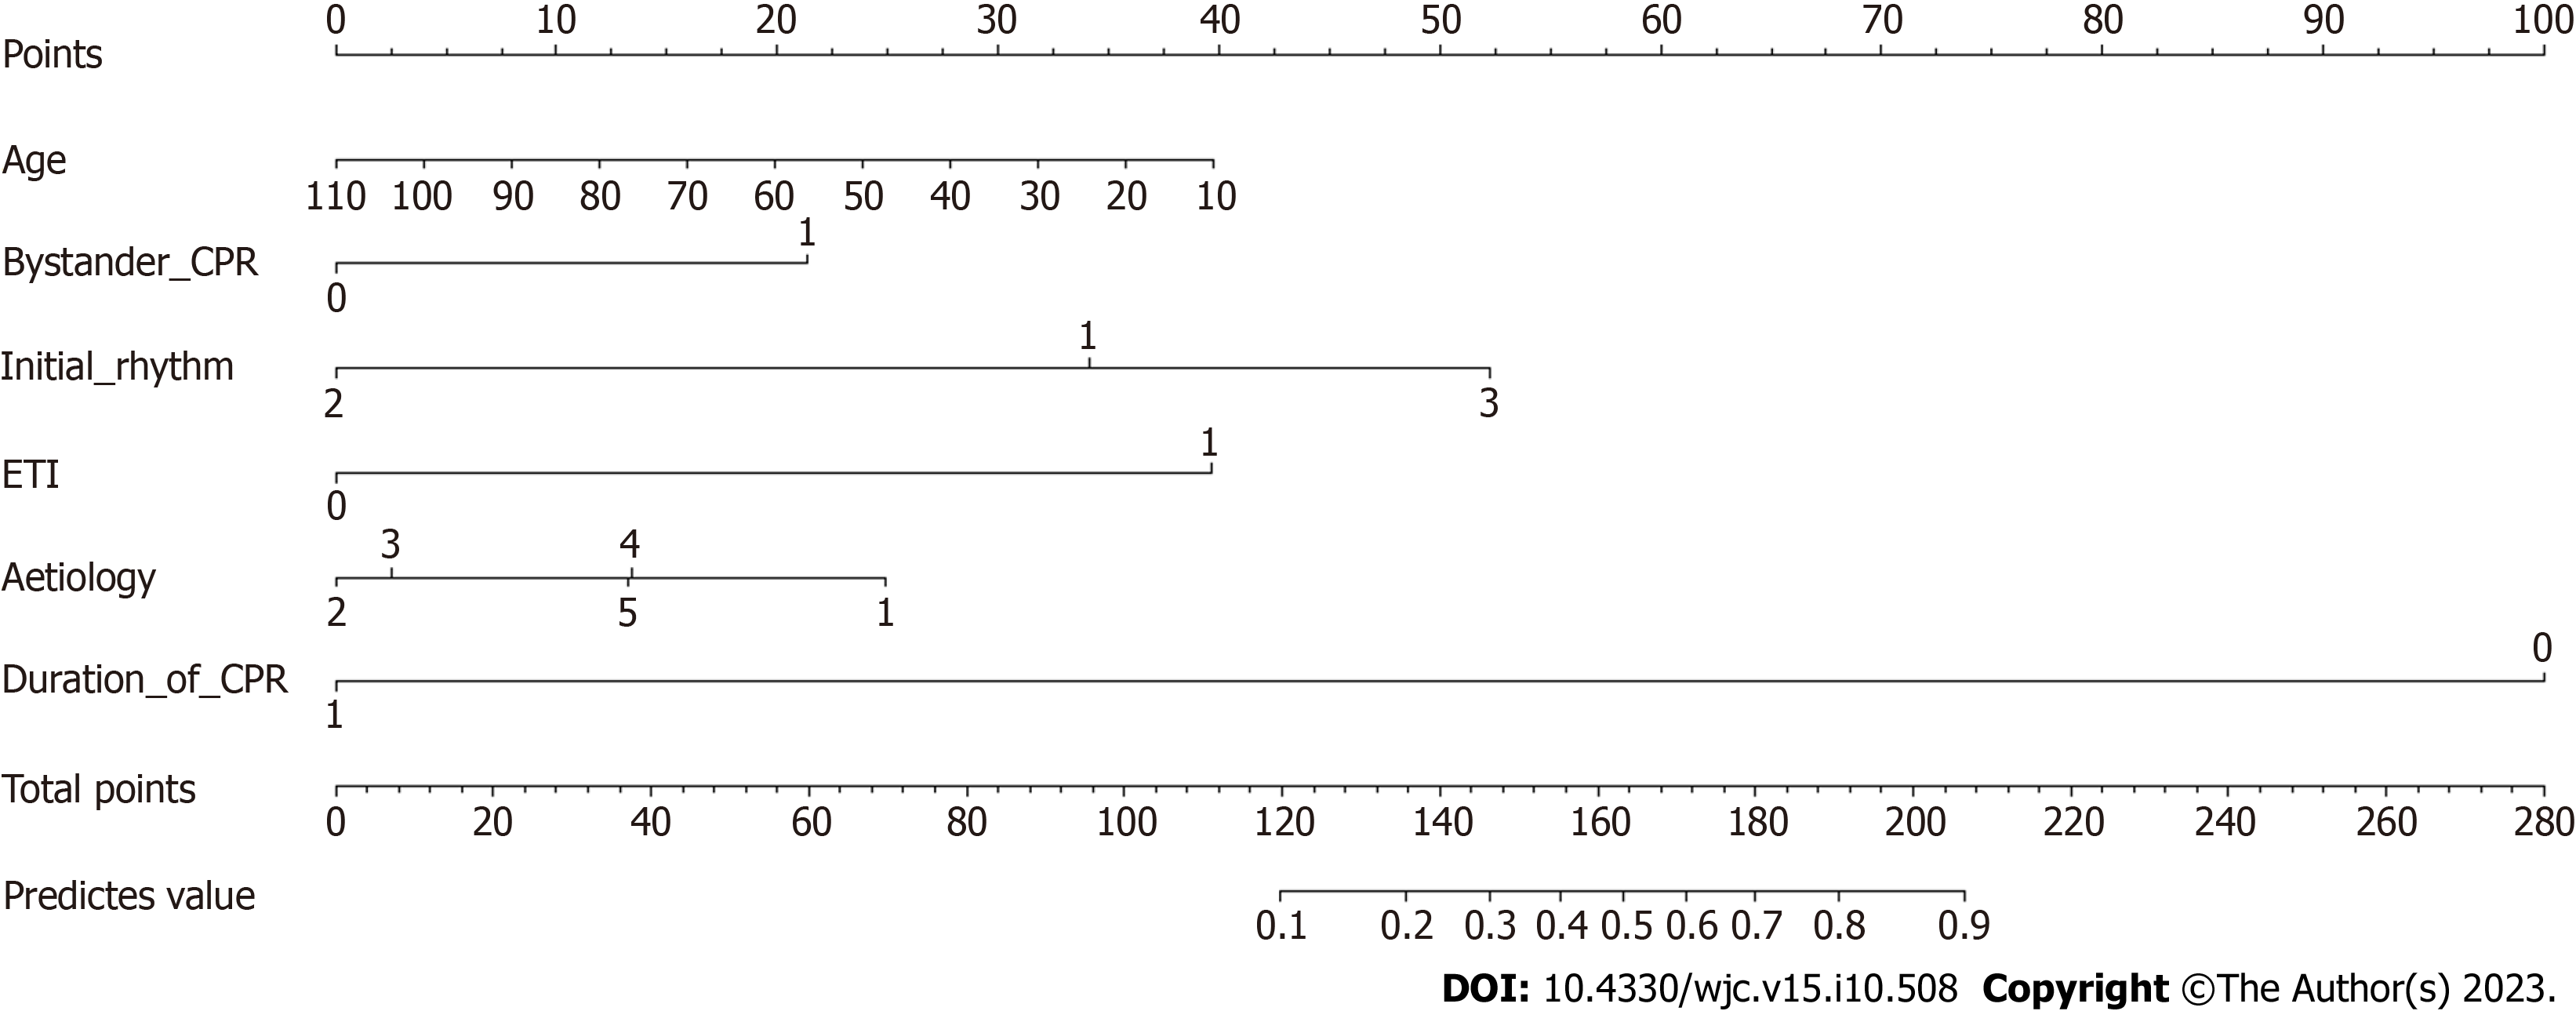
Figure 2 Nomogram prediction model of prehospital return of spontaneous circulation.
Six predictors were included: Age, bystander cardiopulmonary resuscitation (CPR), initial rhythm, CPR duration, ventilation mode, and etiology. Each variable was assigned a score on a point-scale axis. The total score was easily calculated by adding each single score. The probability of prehospital return of spontaneous circulation is estimated by projecting the total score to the lower total-point scale.
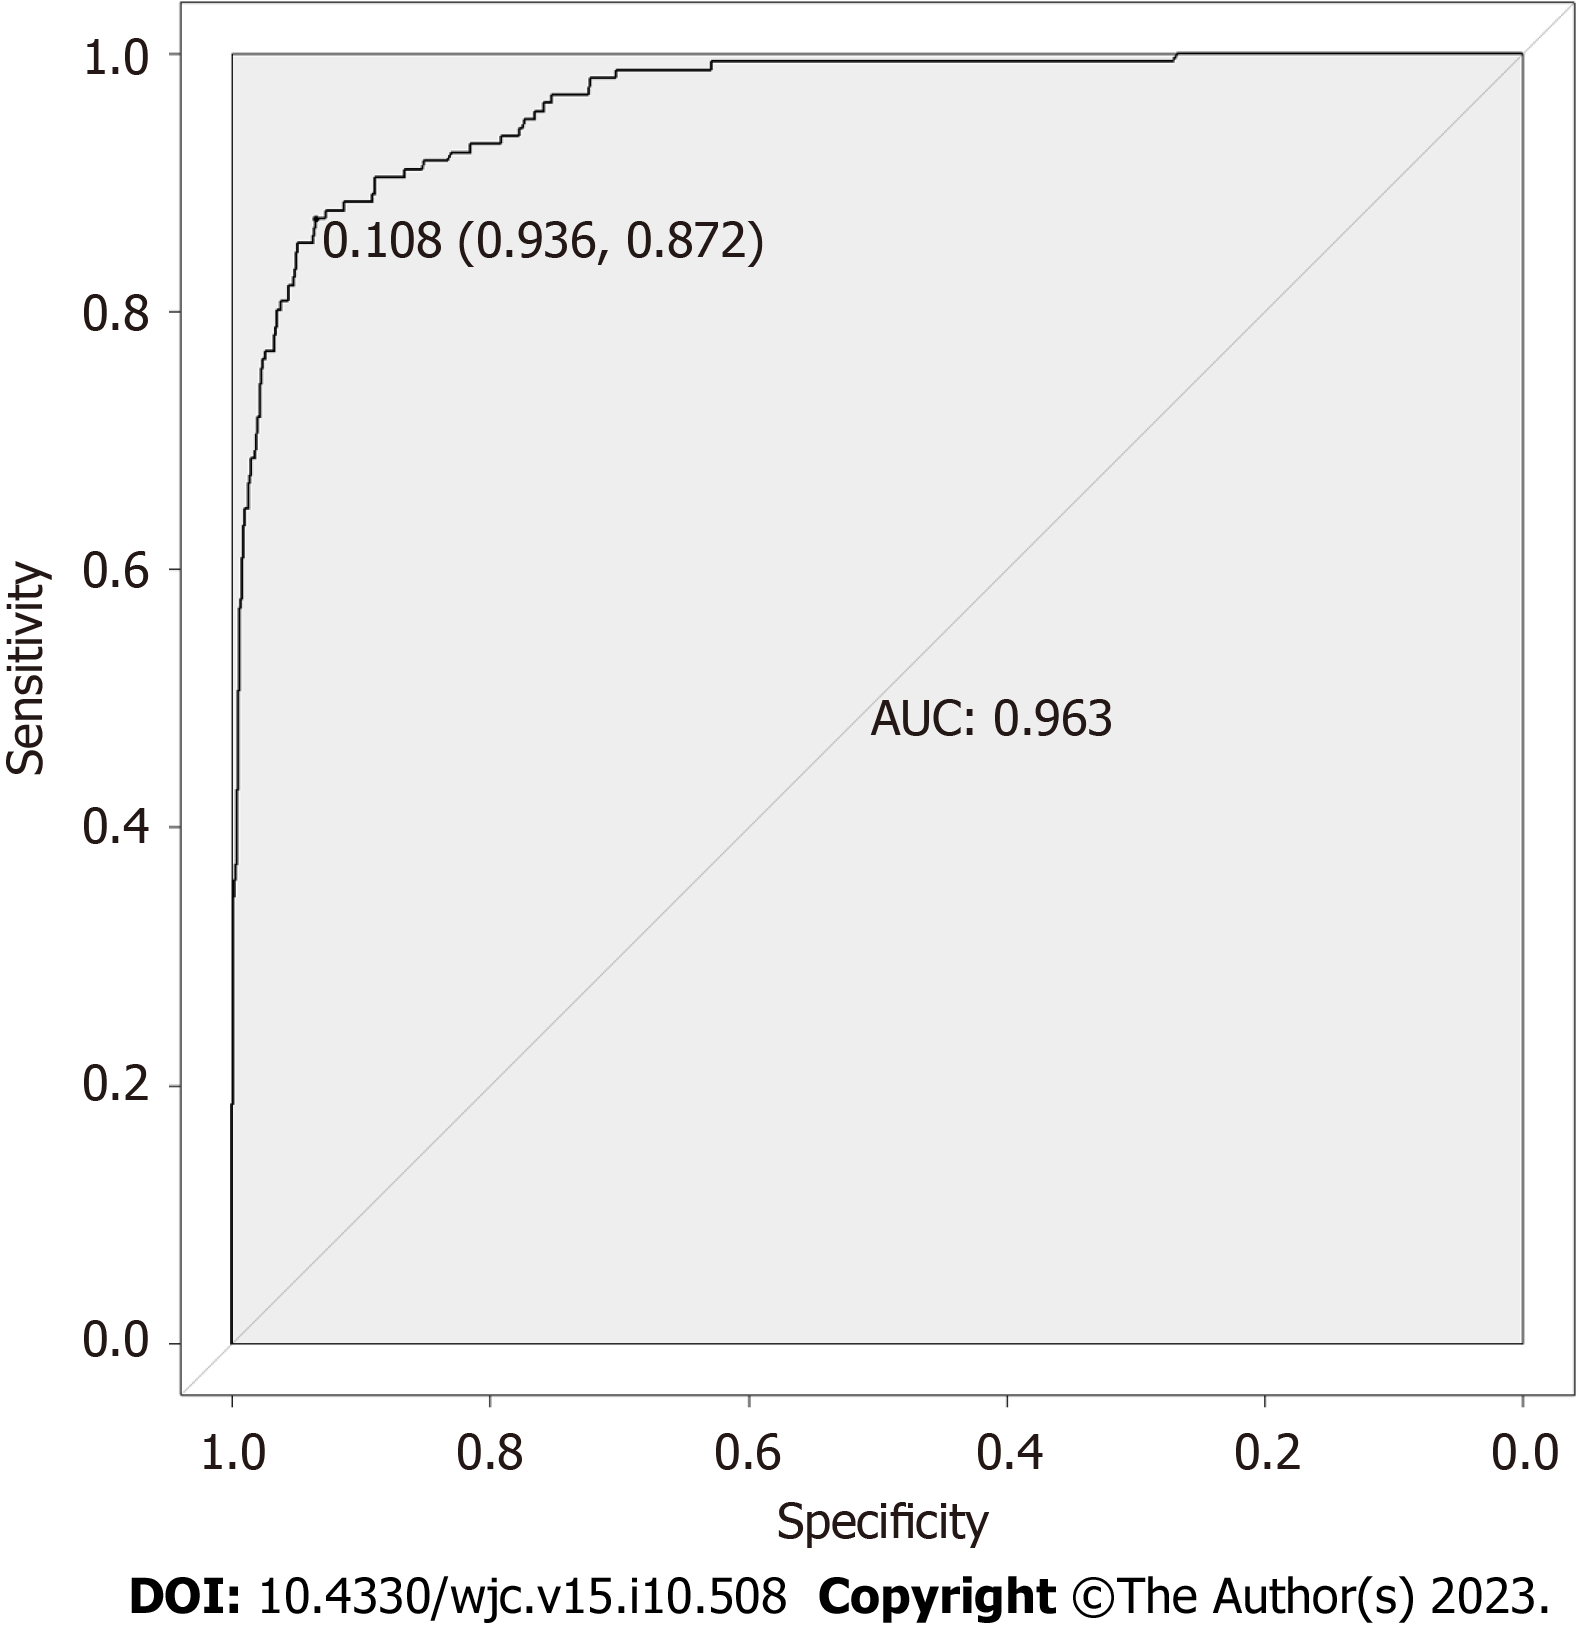
Figure 3 Receiver operating characteristic curves of prehospital return of spontaneous circulation model.
The area under the receiver operating characteristic curve of the prehospital return of spontaneous circulation prediction model was 0.9627 (95%: 0.9485-0.9769).
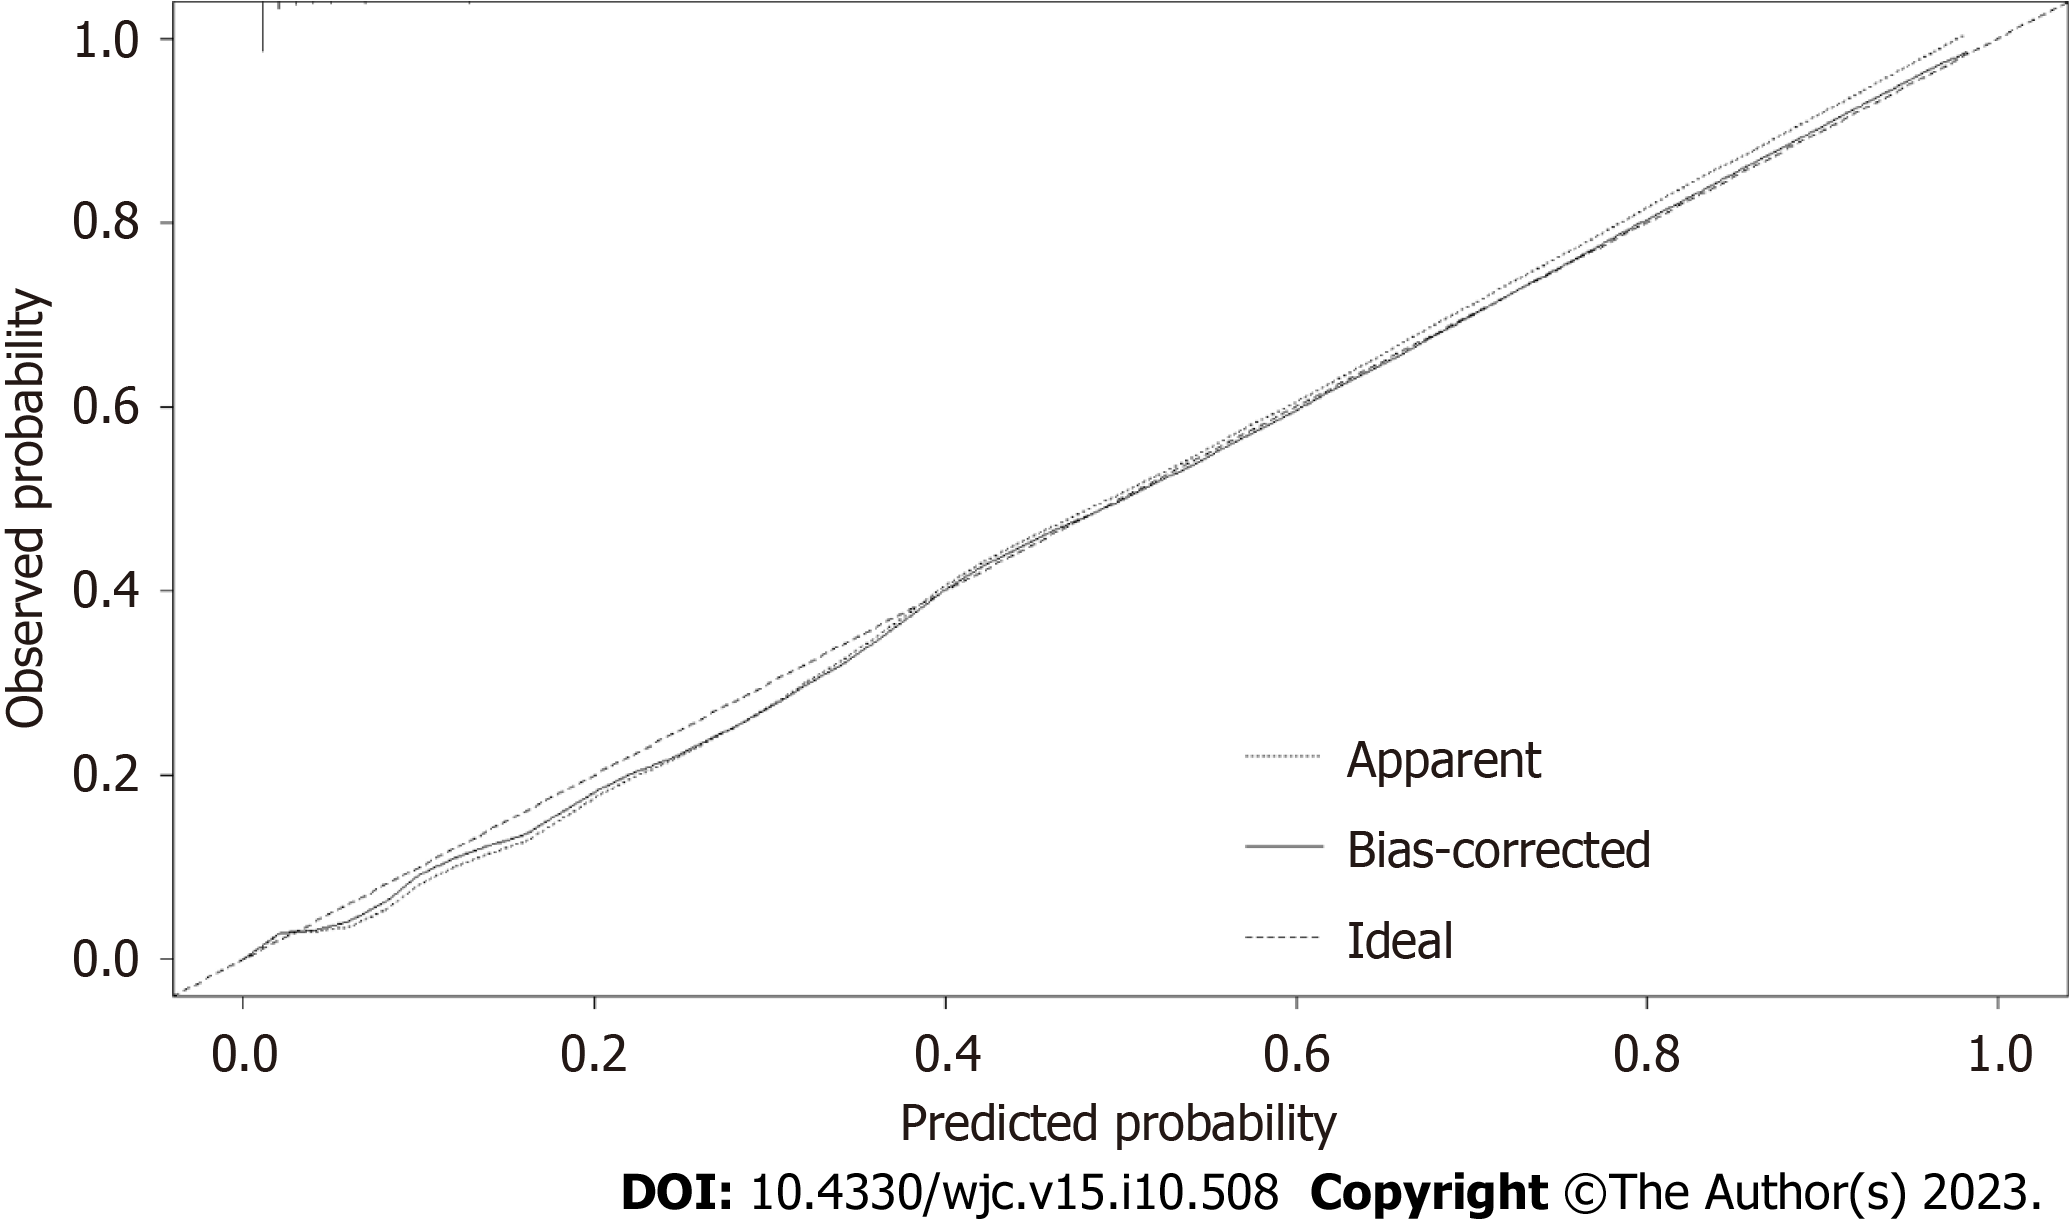
Figure 4 Calibration curves of the prehospital return of spontaneous circulation model.
The dotted line represents the apparent model, while the solid line is bias-corrected by strengthening bootstrapping.
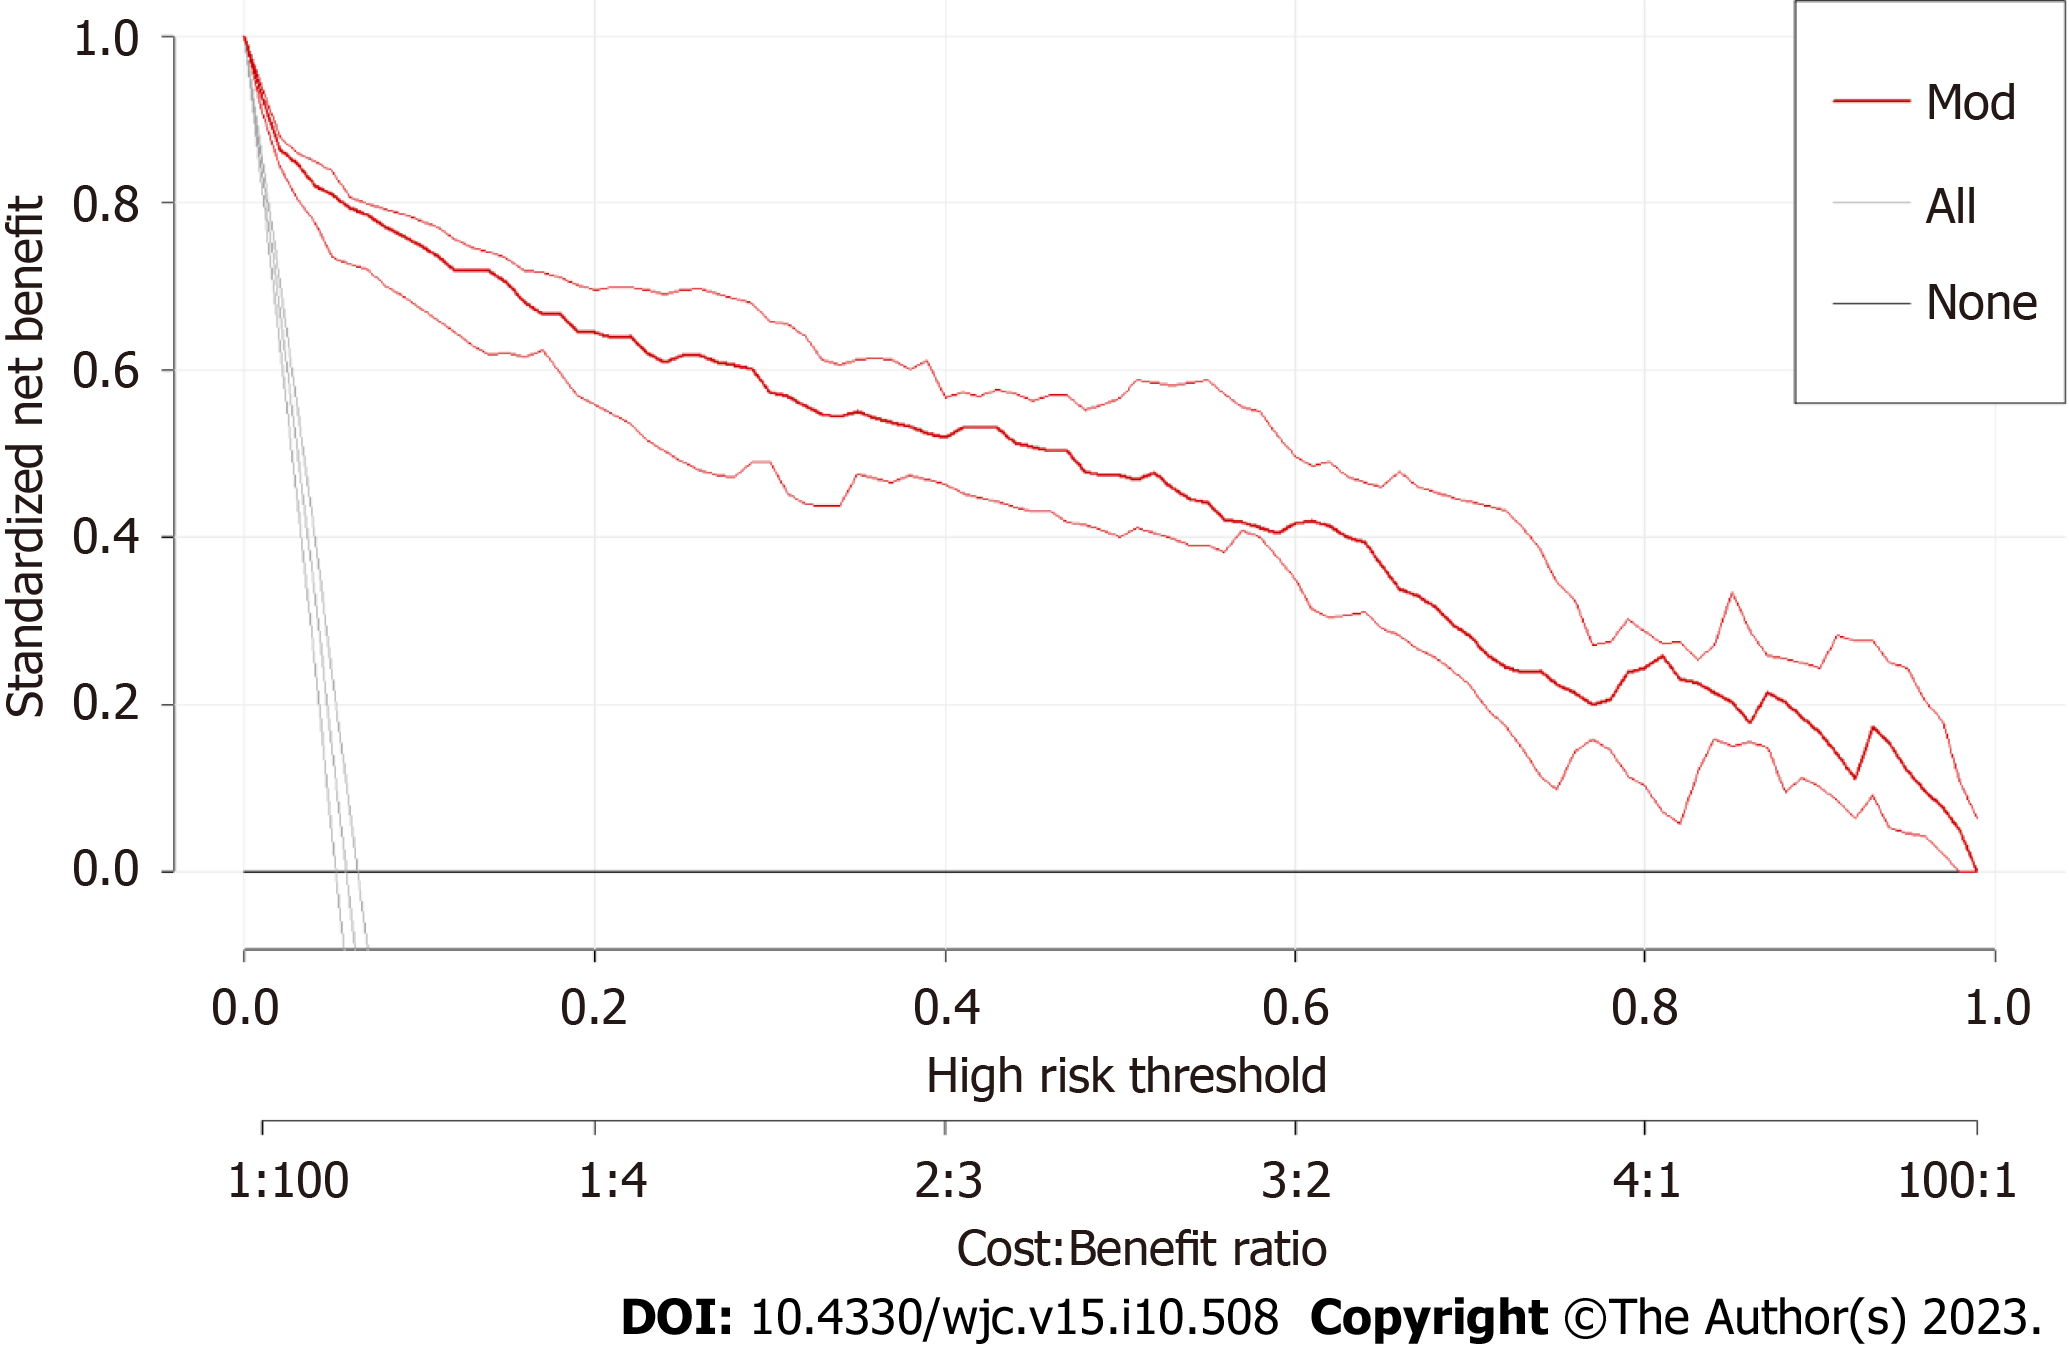
Figure 5 Decision curve analysis of the prehospital return of spontaneous circulation model.
The X- and Y-axes show the threshold probabilities and net benefits, respectively. The solid red line indicates the prehospital return of spontaneous circulation model. The “All” and “None” lines represent interventions for all or none of the patients, respectively.
- Citation: Wang JJ, Zhou Q, Huang ZH, Han Y, Qin CZ, Chen ZQ, Xiao XY, Deng Z. Establishment of a prediction model for prehospital return of spontaneous circulation in out-of-hospital patients with cardiac arrest. World J Cardiol 2023; 15(10): 508-517
- URL: https://www.wjgnet.com/1949-8462/full/v15/i10/508.htm
- DOI: https://dx.doi.org/10.4330/wjc.v15.i10.508


