Copyright
©The Author(s) 2022.
World J Cardiol. Nov 26, 2022; 14(11): 576-598
Published online Nov 26, 2022. doi: 10.4330/wjc.v14.i11.576
Published online Nov 26, 2022. doi: 10.4330/wjc.v14.i11.576
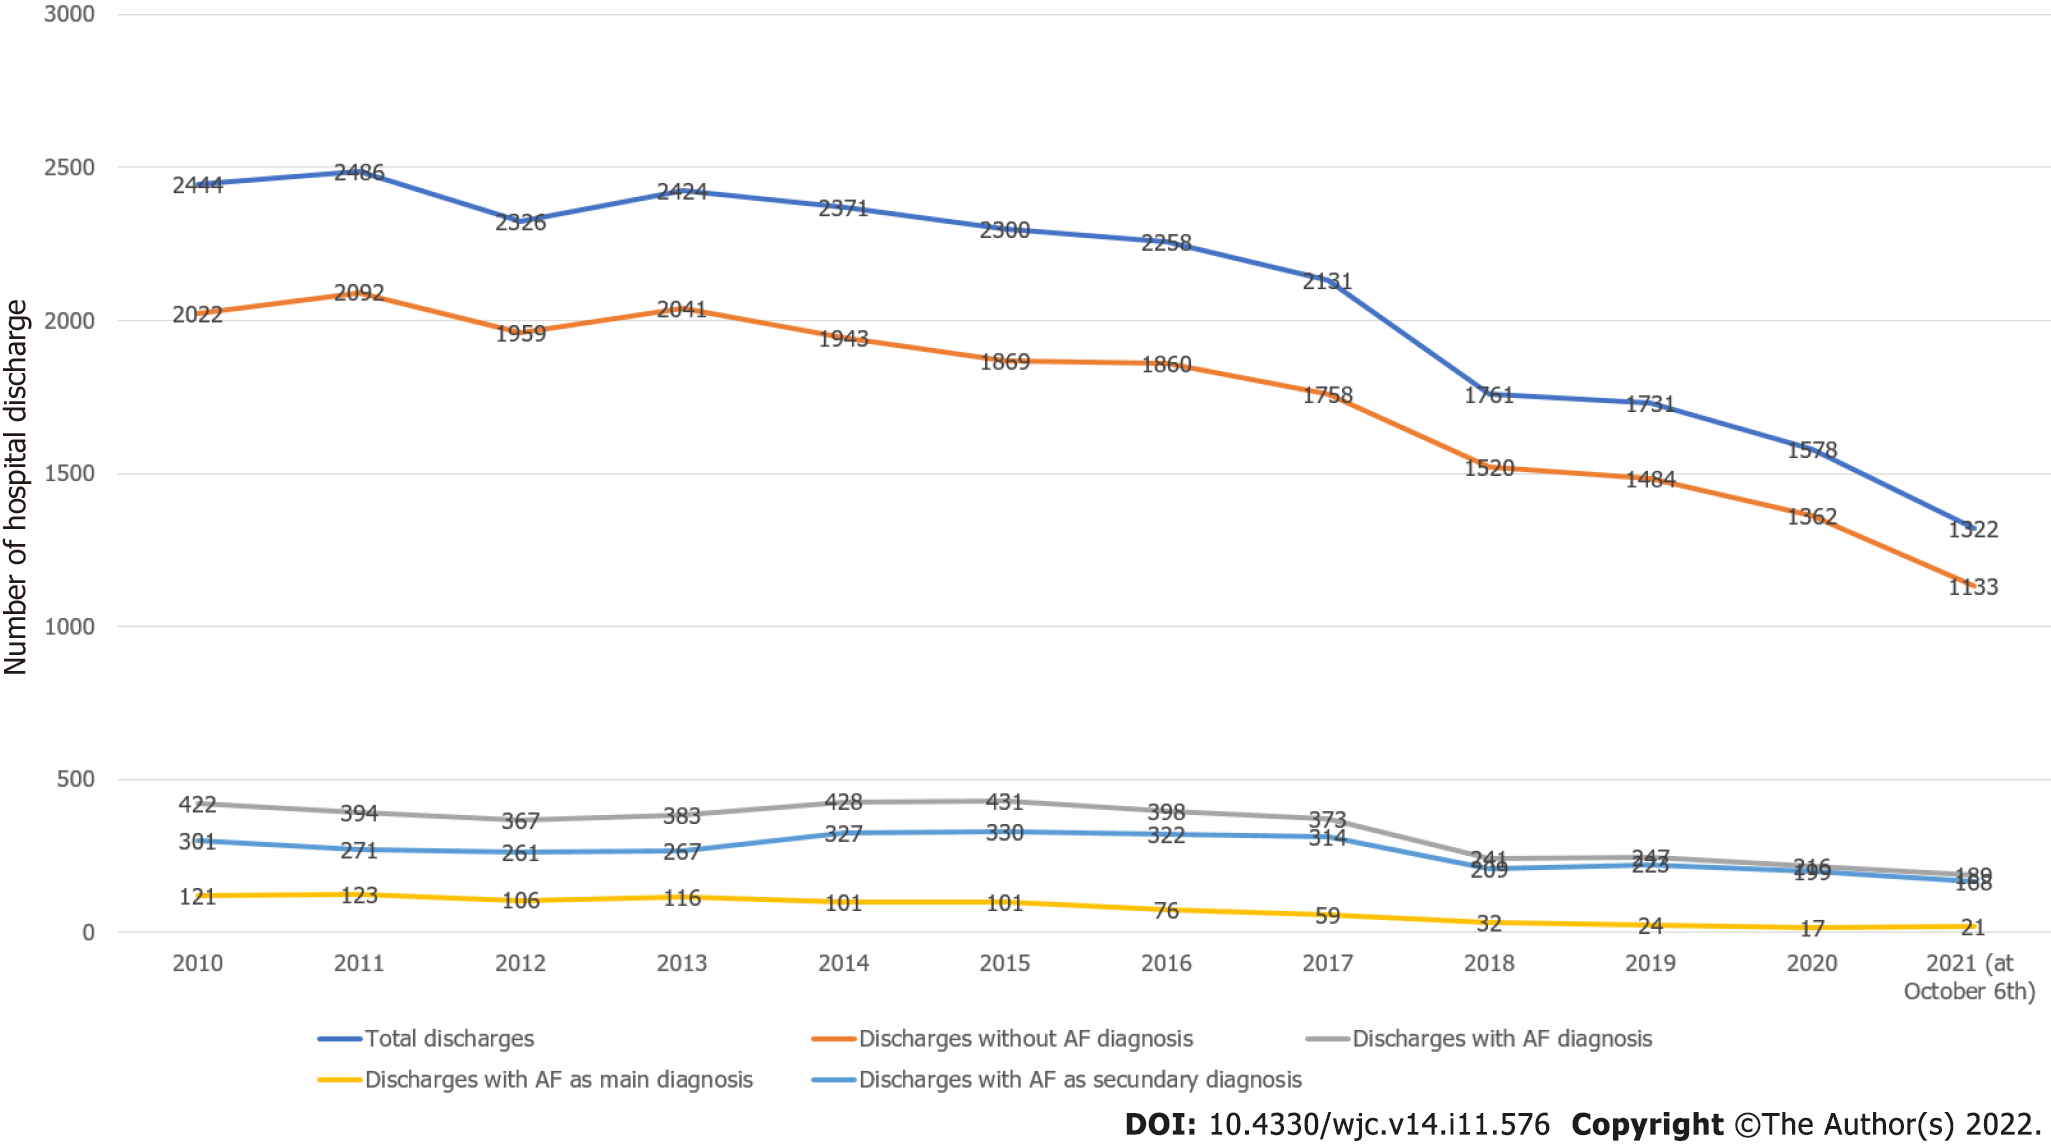
Figure 1 Time trends in the number of hospital discharges (total, with and without atrial fibrillation diagnosis); discharges with atrial fibrillation were further divided into the main or secondary diagnosis.
AF: Atrial fibrillation.
Figure 2
Study flowchart.
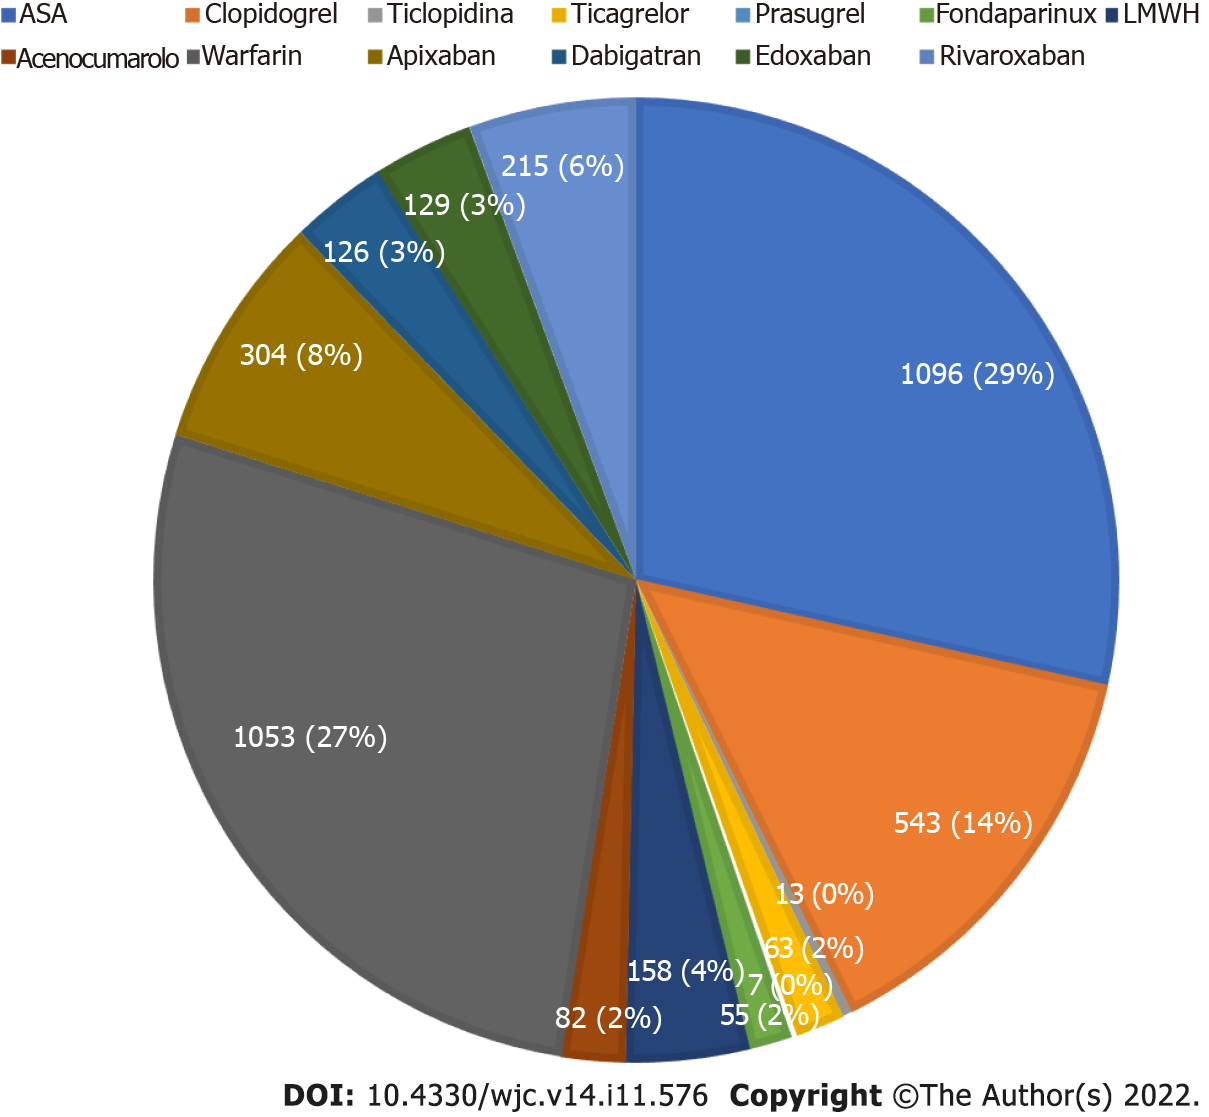
Figure 3 Prevalence of different antithrombotic treatments as a percentage of total antithrombotic treatments.
ASA: Acetylsalicylic acid; LMWH: Low molecular weight heparin.
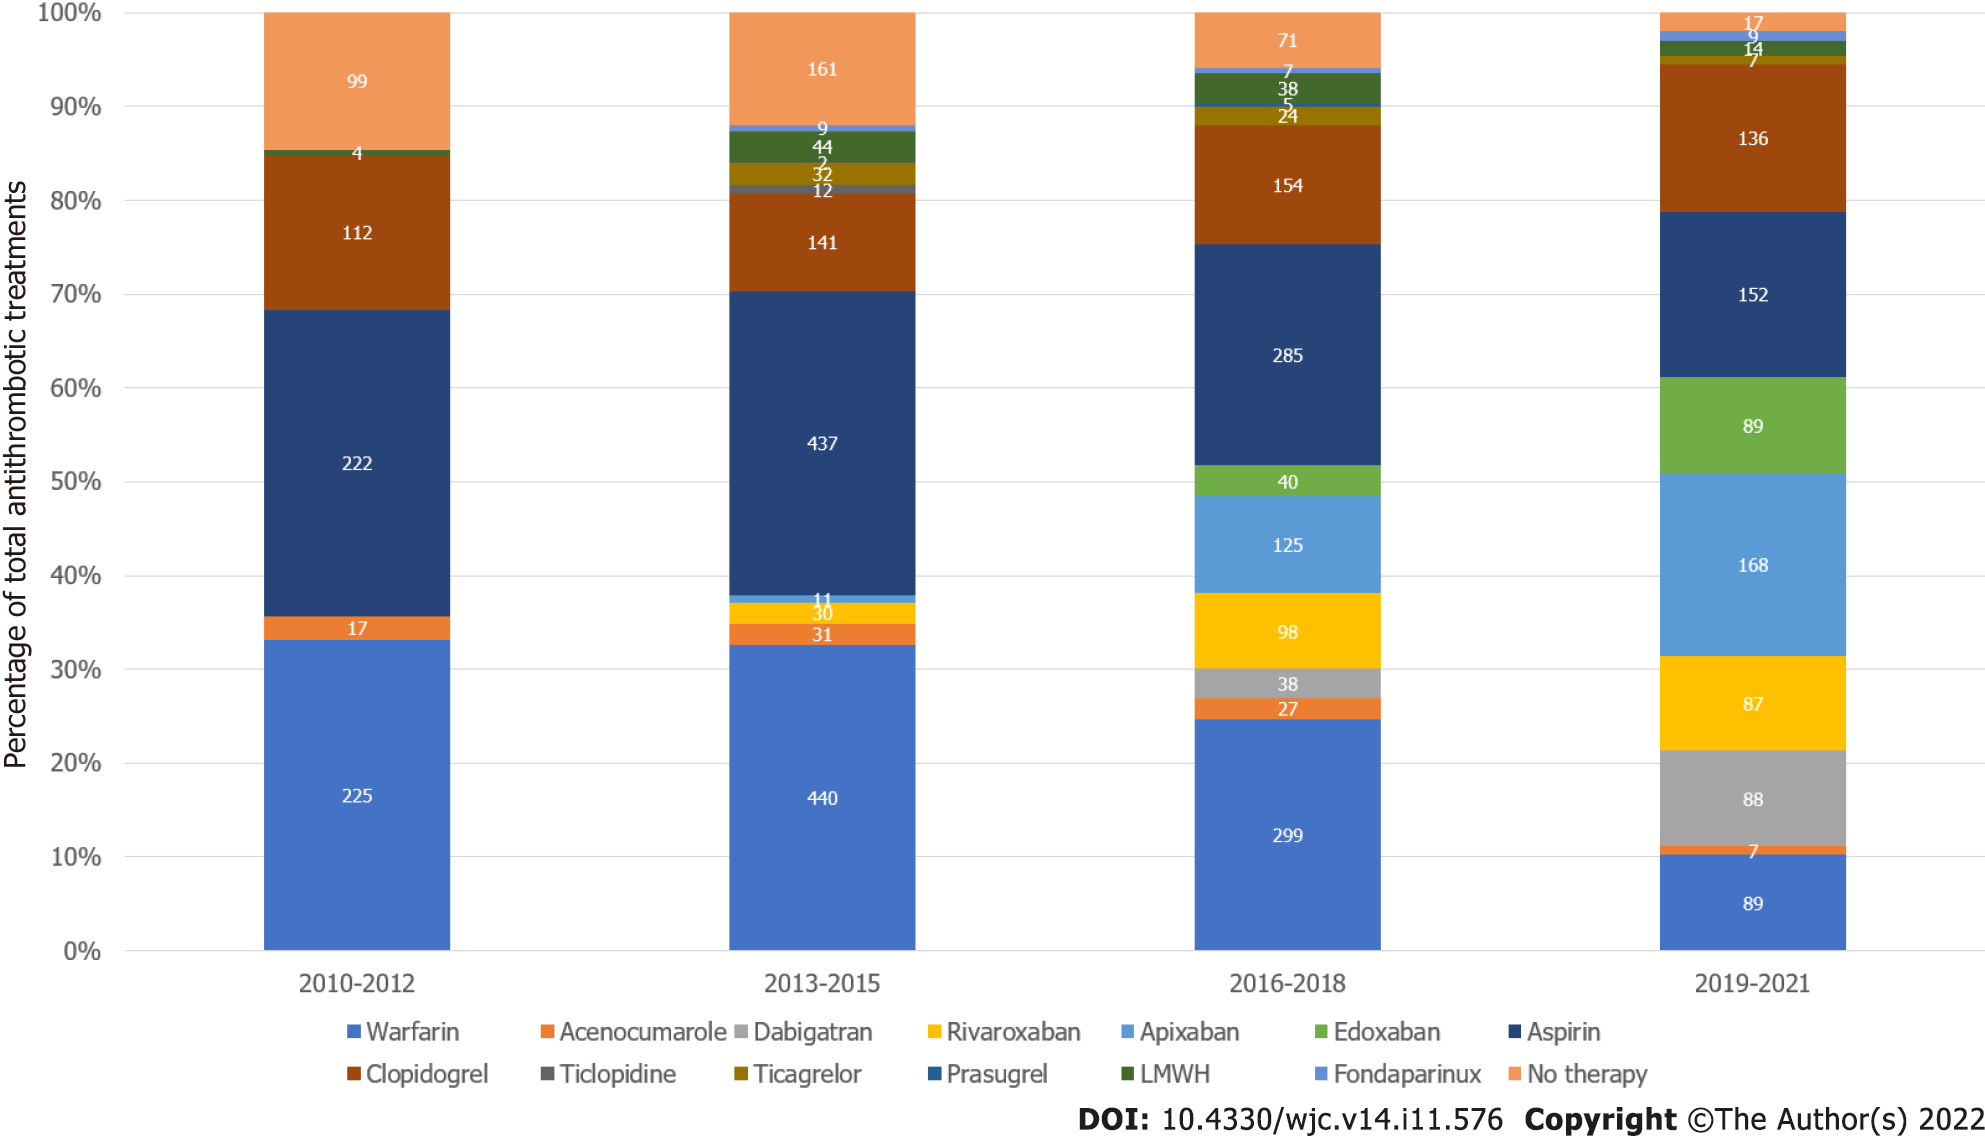
Figure 4 Time trends over three-year periods (from 2010-2012 to 2019-2021) of the prevalence of different antithrombotic treatments as a percentage of total antithrombotic treatments.
LMWH: Low molecular weight heparin.
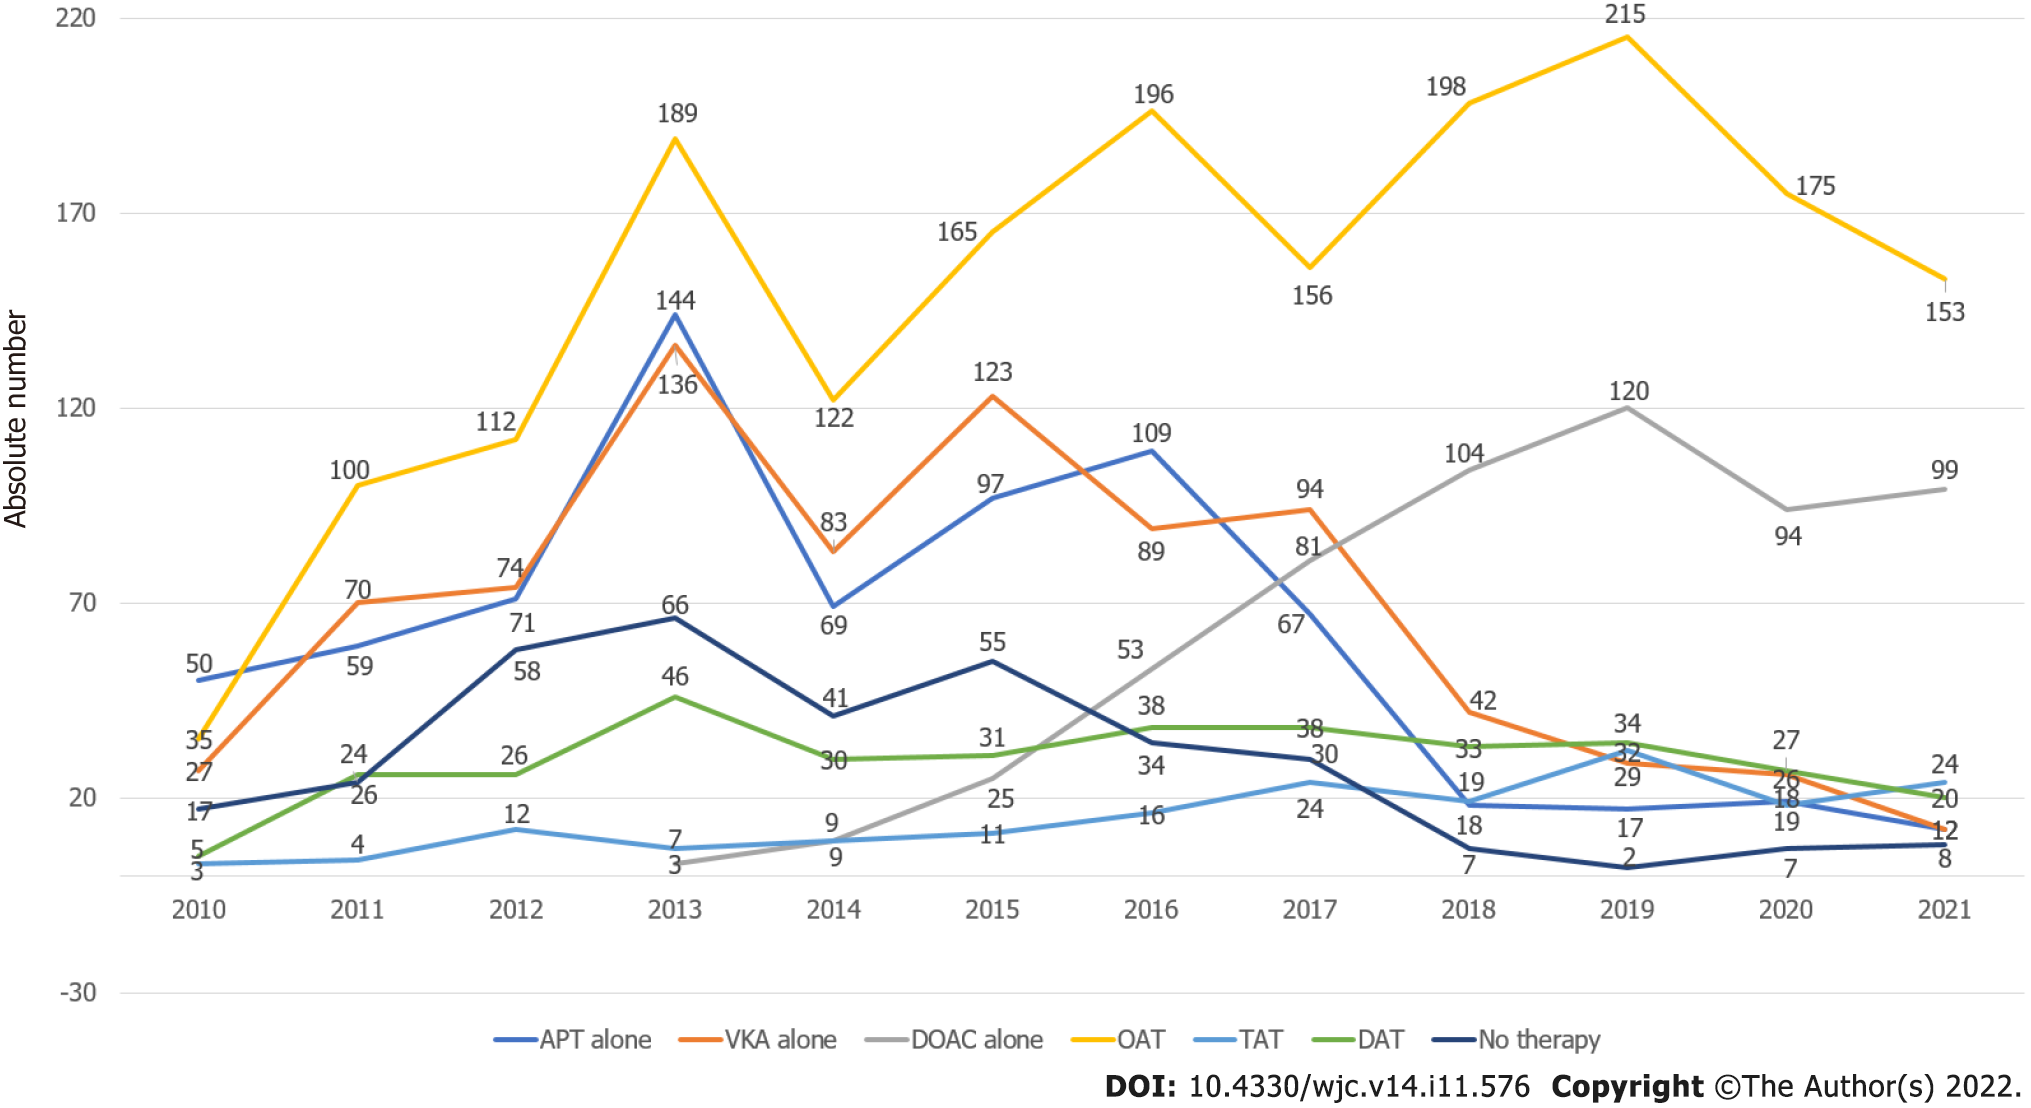
Figure 5 Time trends by year (from 2010 to 2021) in prescription of different antithrombotic treatments (absolute number).
APT: Antiplatelet treatment; VKA: vitamin K antagonist; DOAC: Direct oral anticoagulant; OAT: Oral antithrombotic therapy; TAT: Triple antithrombotic therapy; DAT: Double antithrombotic therapy.
Figure 6 Time trends by year (from 2010 to 2021) in prescription of different antithrombotic treatments (as a percentage of total patients).
APT: Antiplatelet treatment; VKA: vitamin K antagonist; DOAC: Direct oral anticoagulant; OAT: Oral antithrombotic therapy; TAT: Triple antithrombotic therapy; DAT: Double antithrombotic therapy.
- Citation: Abrignani MG, Lombardo A, Braschi A, Renda N, Abrignani V, Lombardo RM. Time trends in antithrombotic therapy prescription patterns: Real-world monocentric study in hospitalized patients with atrial fibrillation. World J Cardiol 2022; 14(11): 576-598
- URL: https://www.wjgnet.com/1949-8462/full/v14/i11/576.htm
- DOI: https://dx.doi.org/10.4330/wjc.v14.i11.576


