Copyright
©The Author(s) 2021.
World J Cardiol. Jul 26, 2021; 13(7): 230-236
Published online Jul 26, 2021. doi: 10.4330/wjc.v13.i7.230
Published online Jul 26, 2021. doi: 10.4330/wjc.v13.i7.230
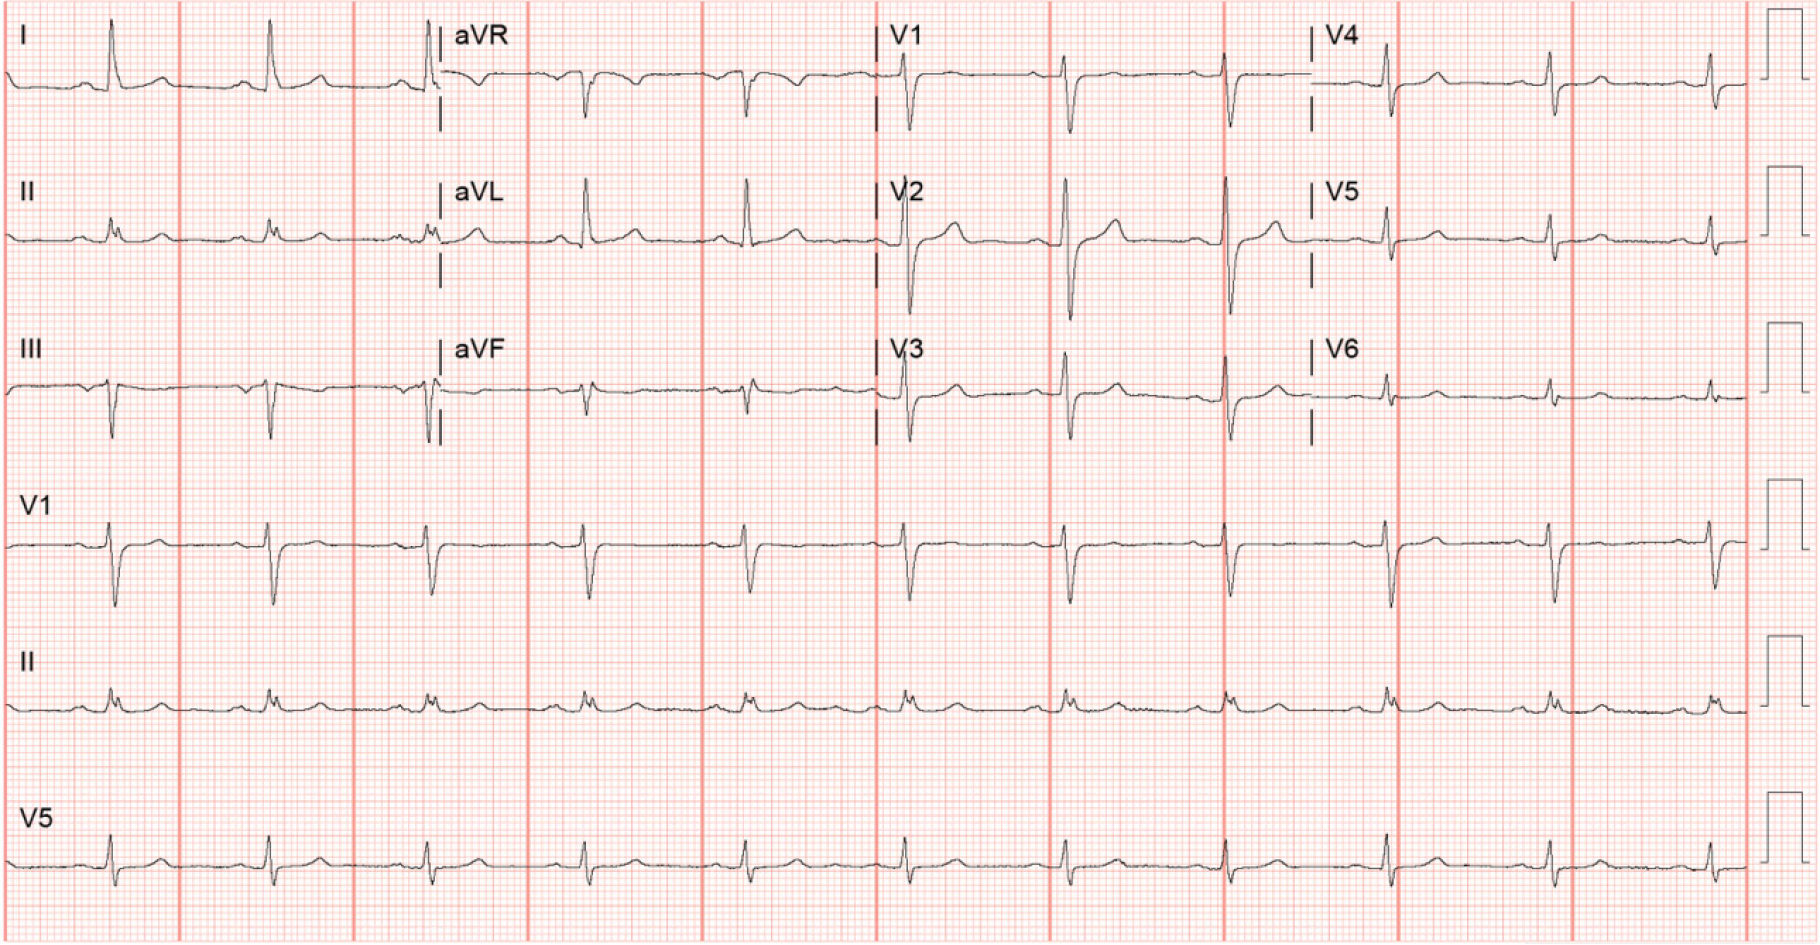
Figure 1 Electrocardiogram on admission.
Twelve lead electrocardiogram without any hyperkalemic manifestations.
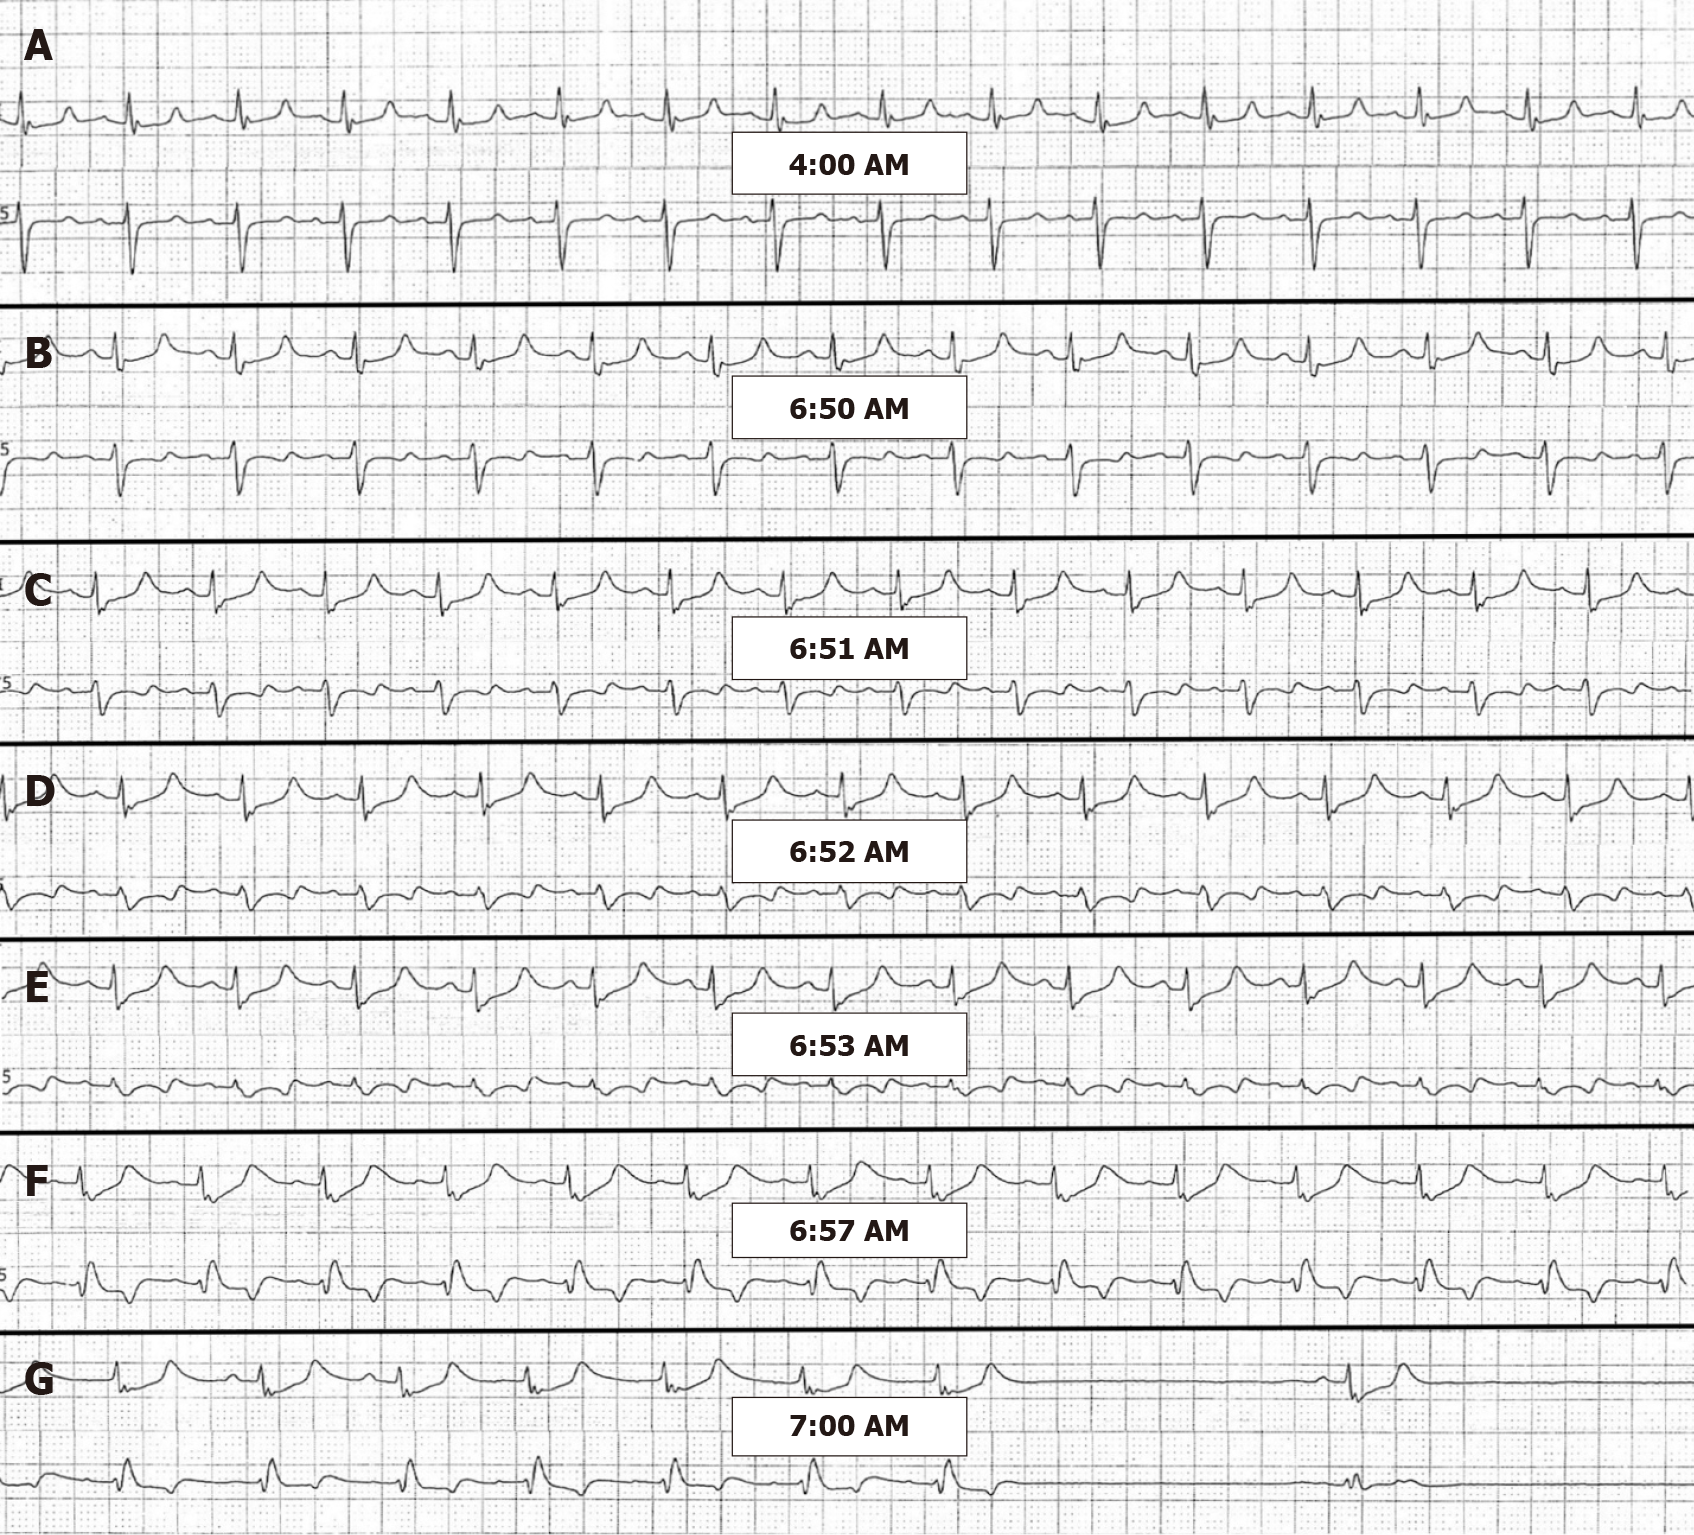
Figure 2 Telemetry strips (rate 25 mm/s).
The upper rhythm is lead II and lower rhythm is lead V5. A: At 4:00 AM. when potassium level started rising. T wave amplitude measuring 2-2.5 mm in lead II. PR interval 0.16-0.20 s. QRS 0.1-0.12 s. QT prolongation from hypocalcemia; B: At 6:50 AM. T waves in lead II seems to be slightly taller, maybe about 0.5 mm (half small square) than Figure 2. Similar measurements for PR interval and QRS. Non-specific T waves changes in V5; C: At 6:51 AM. ST and T waves changes more pronounced in V5. ST depression by 0.5-1 mm in V5. QRS slightly widened beyond 0.12 s in both lead II and V5; D: At 6:52 AM. QRS widened more with further ST depression. Transitioning into sine wave, more obvious in lead V5; E: At 6:53 AM. Complete loss of original QRS morphology in lead V5 and transforming into sine waves. P waves still visible with PR interval 0.16 s in lead II; F: At 6:57 AM. QRS morphology in lead II deformed with marked ST depression, transitioning into sine waves. QRS in V5 is showing left bundle branch block morphology at the similar heart rate; G: At 7:00 AM. Sinus pause over 2 s and pulseless electrical activity cardiac arrest.
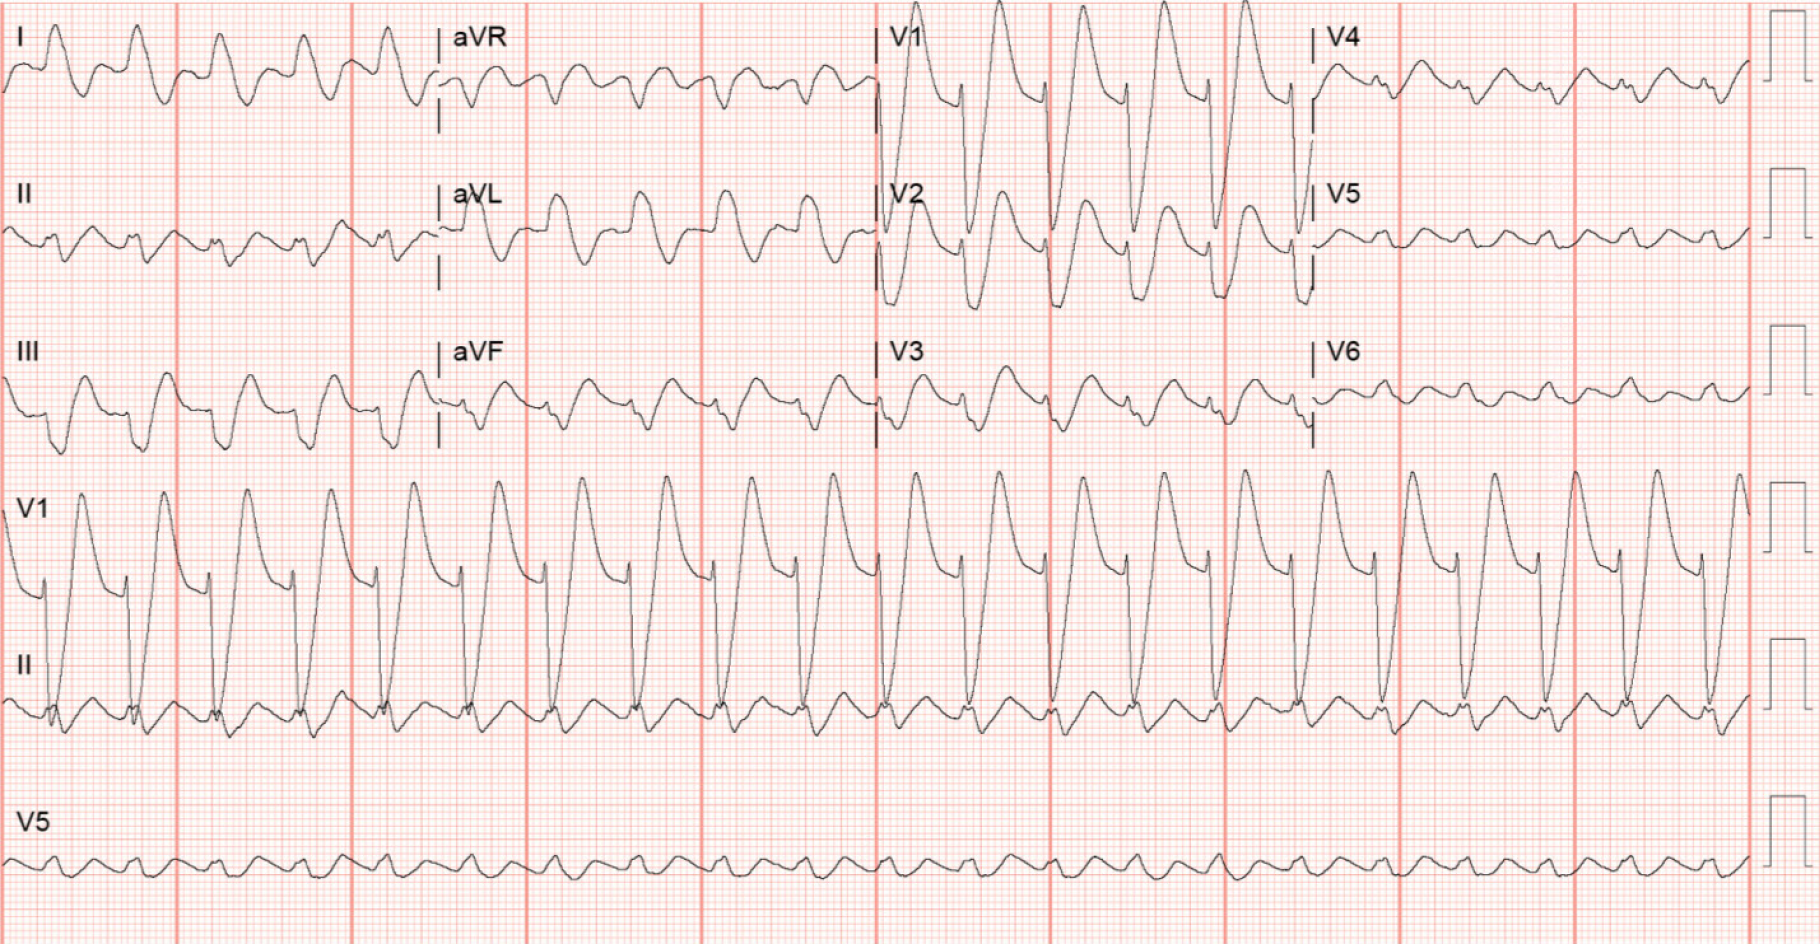
Figure 3 Electrocardiogram after resuscitation.
Twelve lead electrocardiogram showing classic description of hyperkalemic manifestations, peaked T waves in V1, V2, widened QRS complexes, P waves not seen and sine waves in V4, V5, V6.
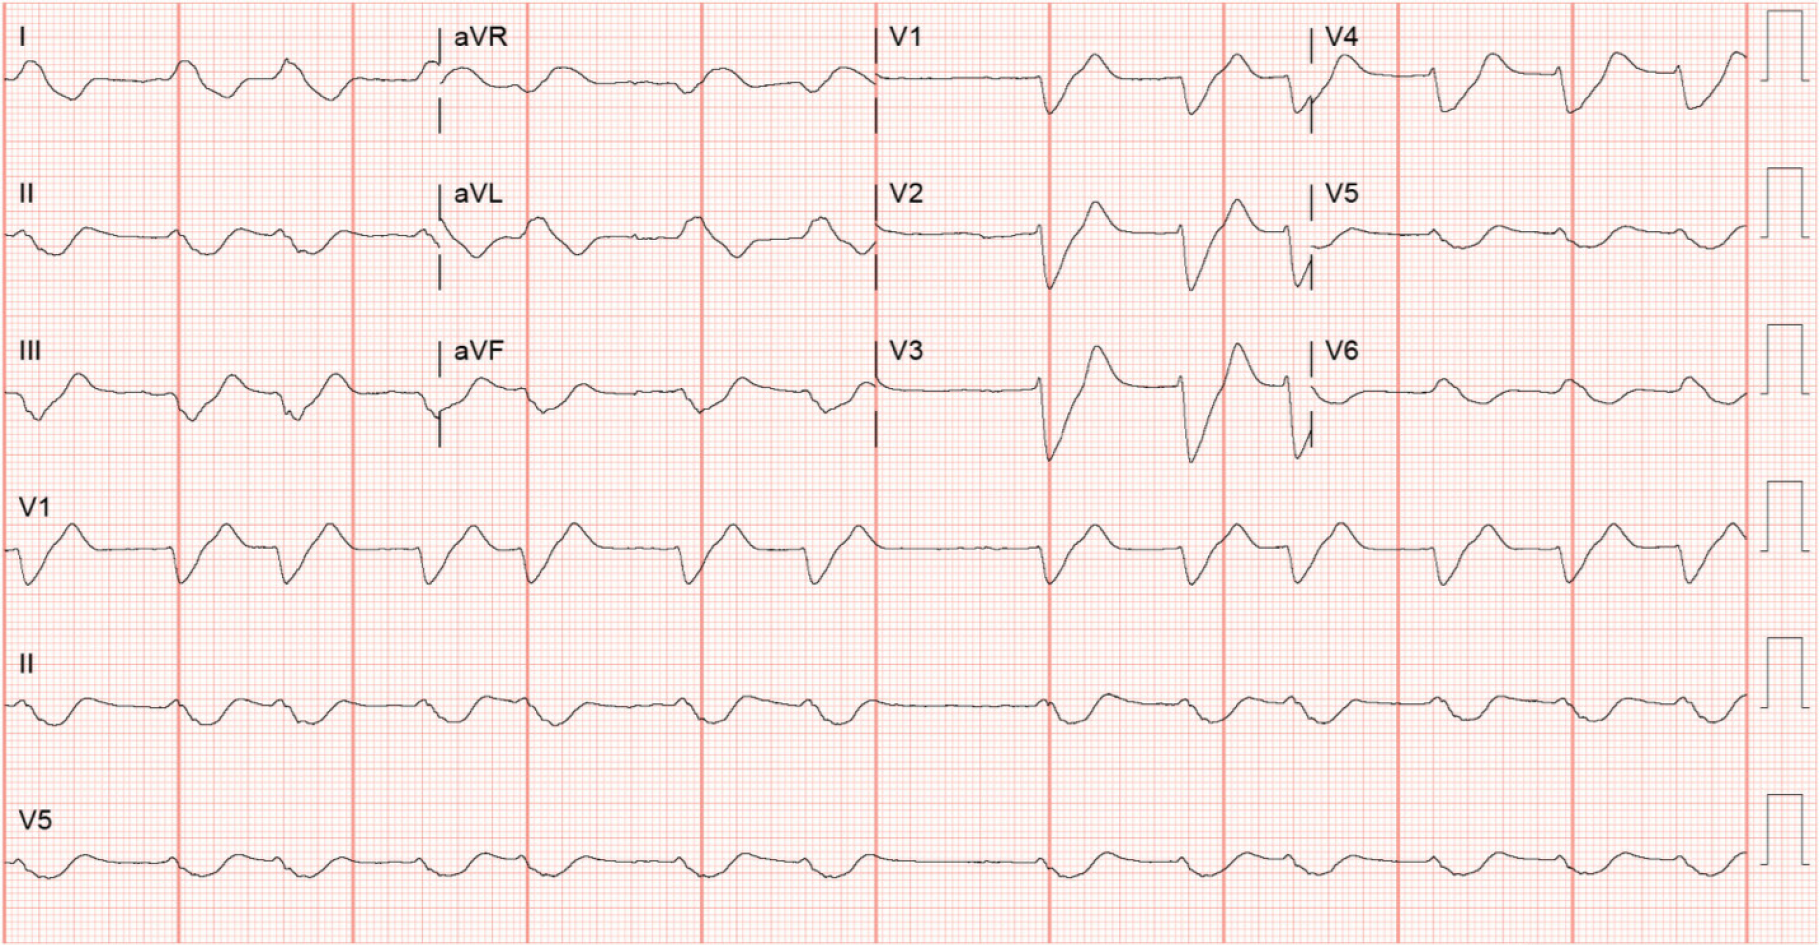
Figure 4 Electrocardiogram showing typical sine waves of hyperkalemia.
Findings include loss of P waves, severe widening of QRS complexes resulting in fusion of QRS complexes and T waves, decrease in amplitudes of QRS complexes and T waves.
- Citation: Soe KK, Seto AH. Sliding with the sines − fatal hyperkalemia: A case report. World J Cardiol 2021; 13(7): 230-236
- URL: https://www.wjgnet.com/1949-8462/full/v13/i7/230.htm
- DOI: https://dx.doi.org/10.4330/wjc.v13.i7.230


