Copyright
©The Author(s) 2021.
World J Cardiol. Oct 26, 2021; 13(10): 533-545
Published online Oct 26, 2021. doi: 10.4330/wjc.v13.i10.533
Published online Oct 26, 2021. doi: 10.4330/wjc.v13.i10.533
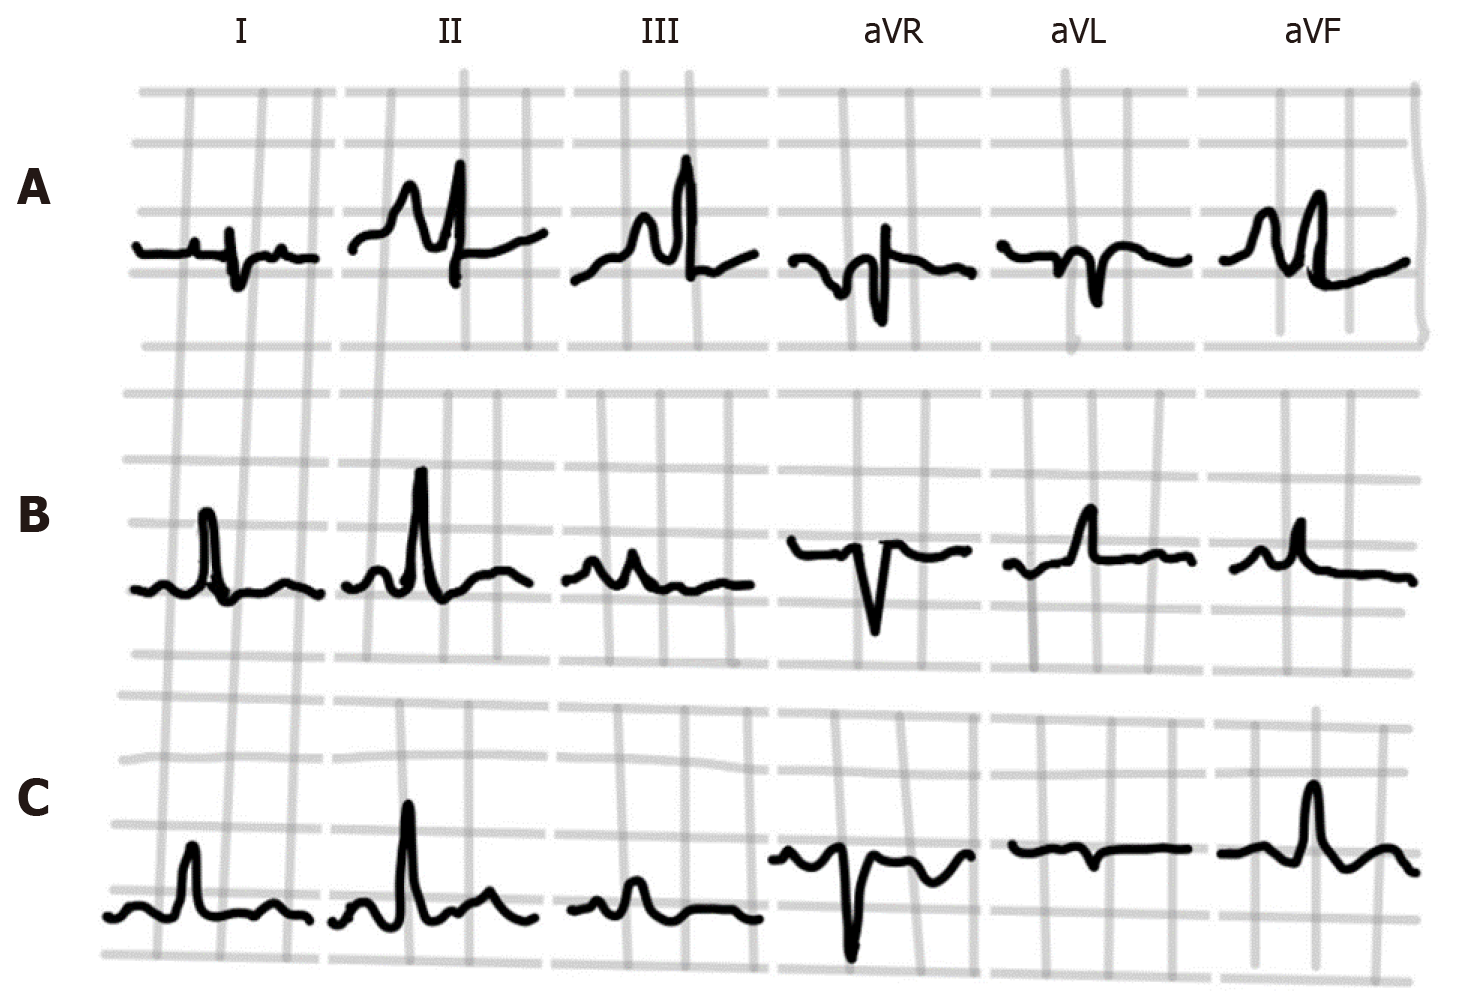
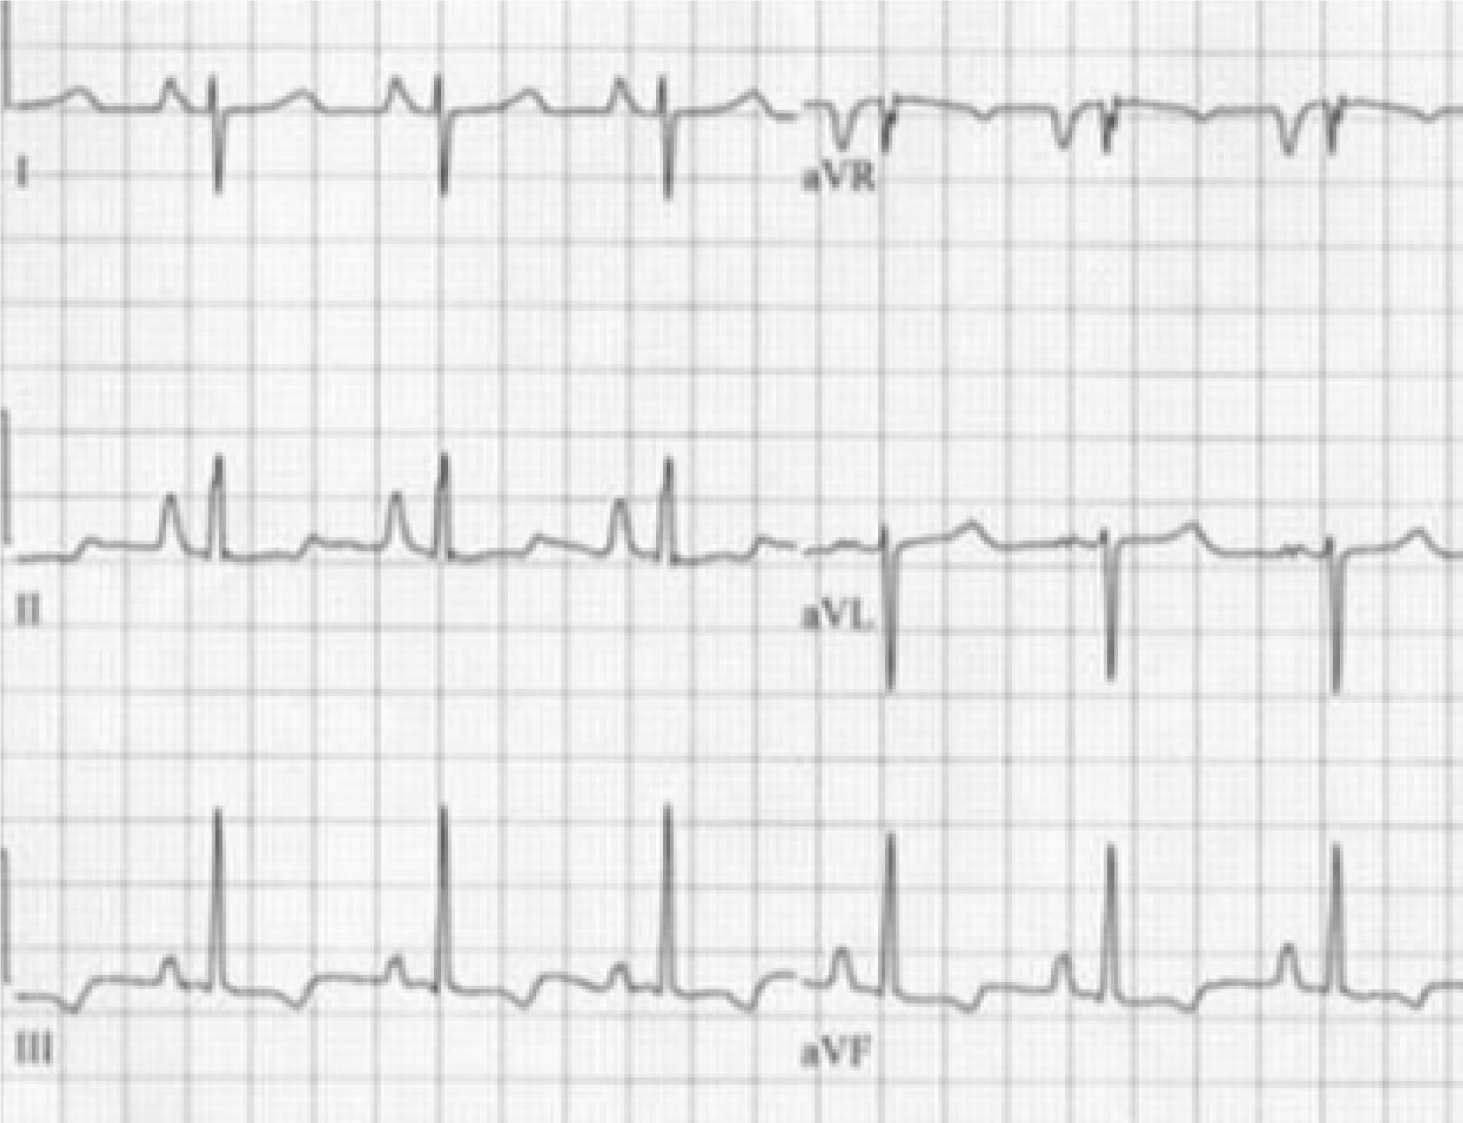
Figure 1 Electrocardiogram showing vertical P wave axis suggested by P wave amplitude in lead III greater than P wave in lead I and a negative P wave in lead aVL.
Adapted from Bajaj et al[13].
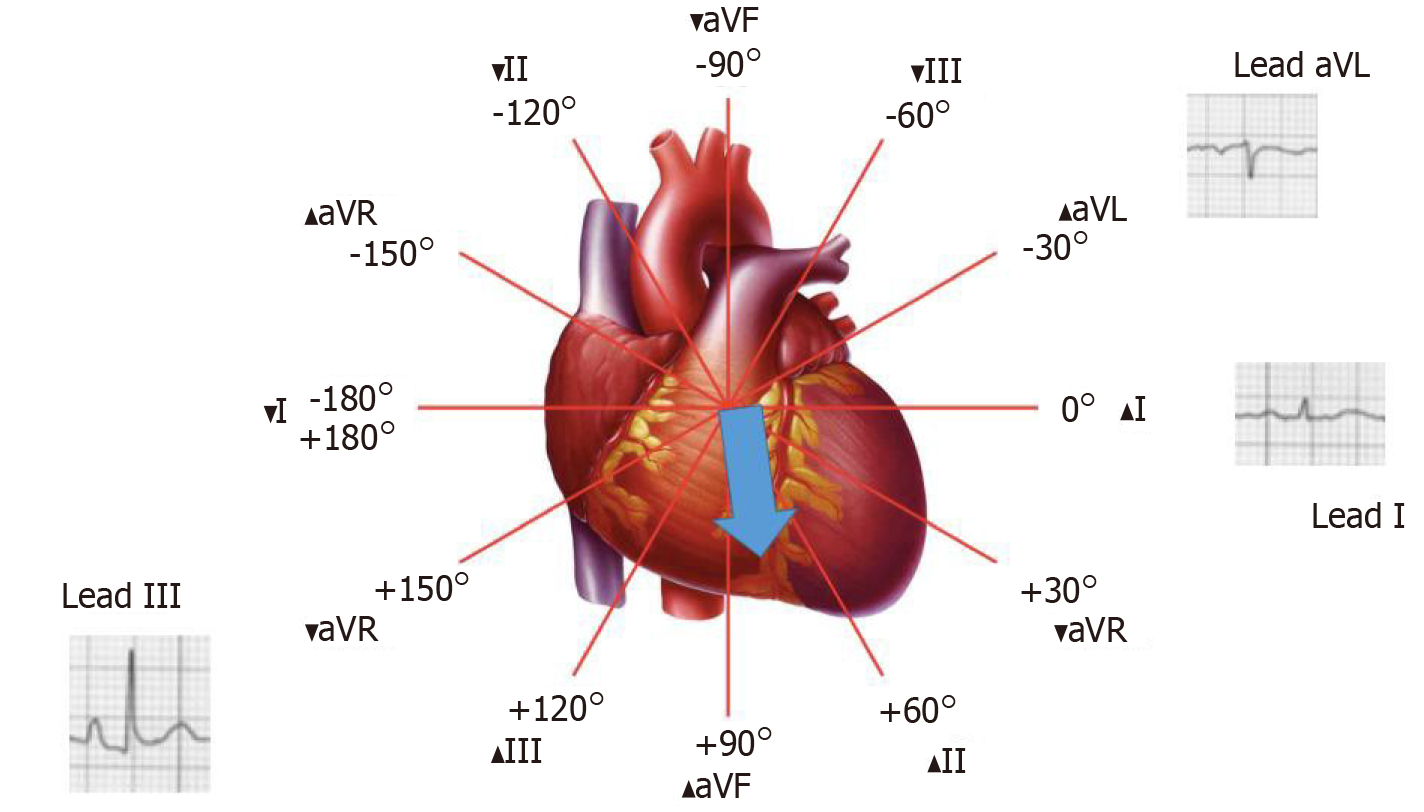
Figure 2 Depiction of vertical P axis in Hexaxial reference system.
Figure 3 A schematic illustration of “P-pulmonale” (A), “Gothic” P waves (B) and normal “Cupola” P wave (rounded in contour).
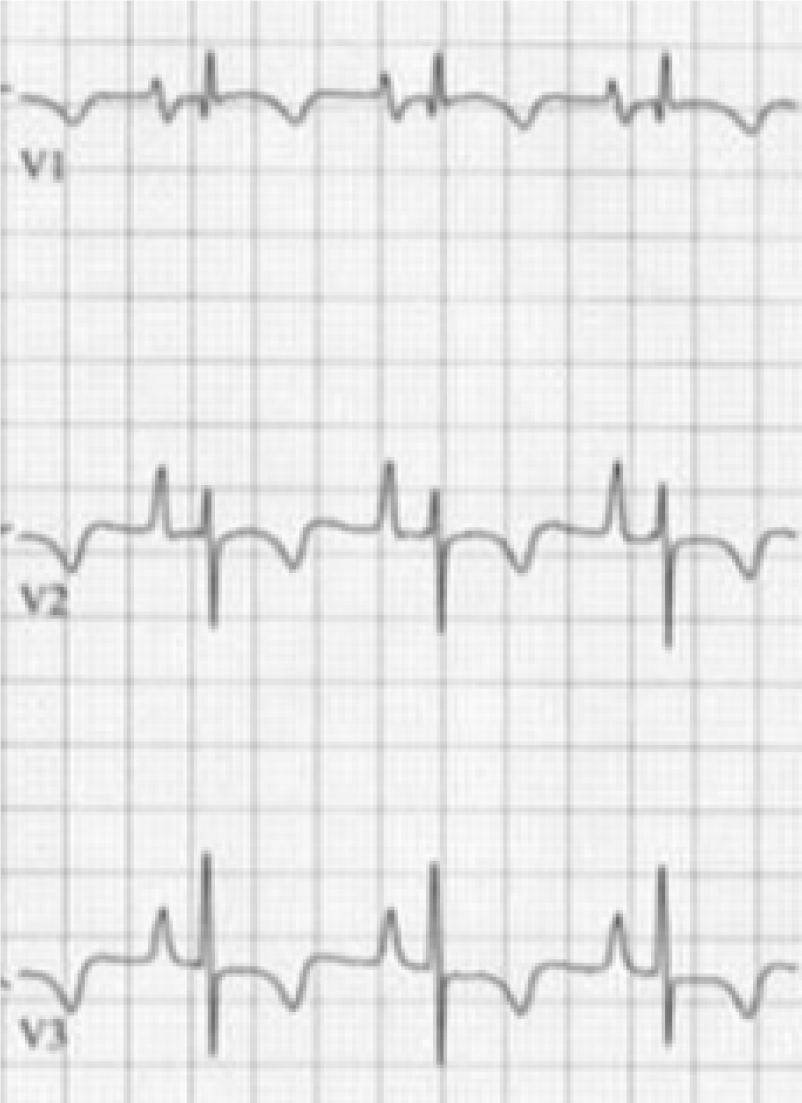
Figure 4 Note the presence of right ventricular hypertrophy, significant P-terminal force and negative T waves in right precordial leads in this patient with pulmonary hypertension.
Adapted from Yanowitz[39].
Figure 5 Right axis deviation of frontal plane QRS is noted along with P-pulmonale in a patient with pulmonary hypertension.
Adapted from Yanowitz[39].
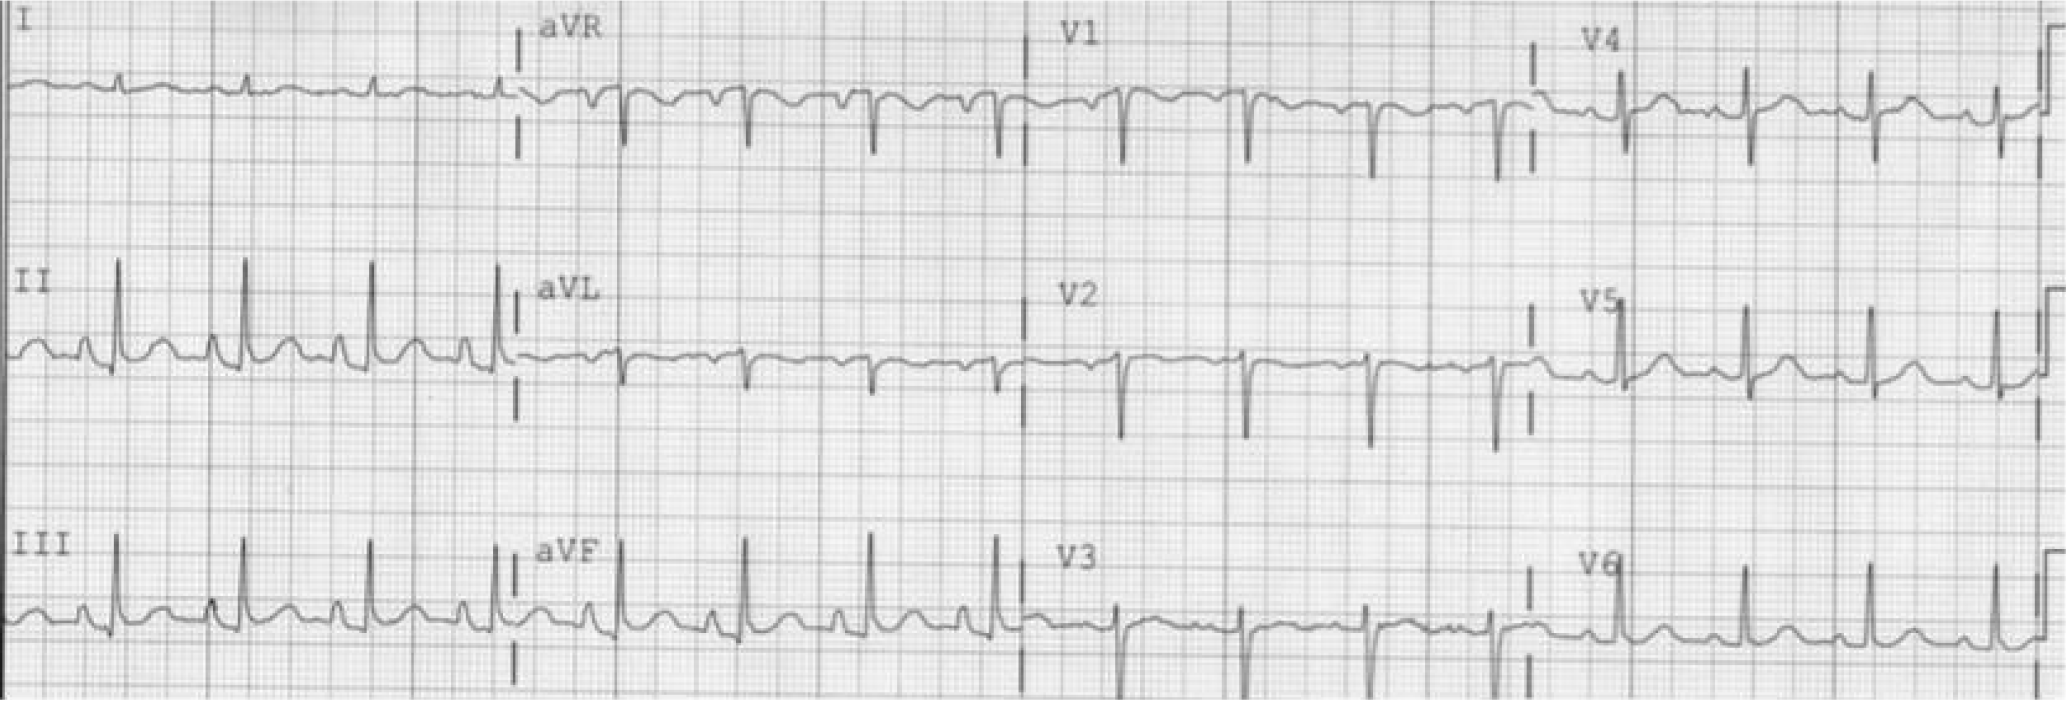
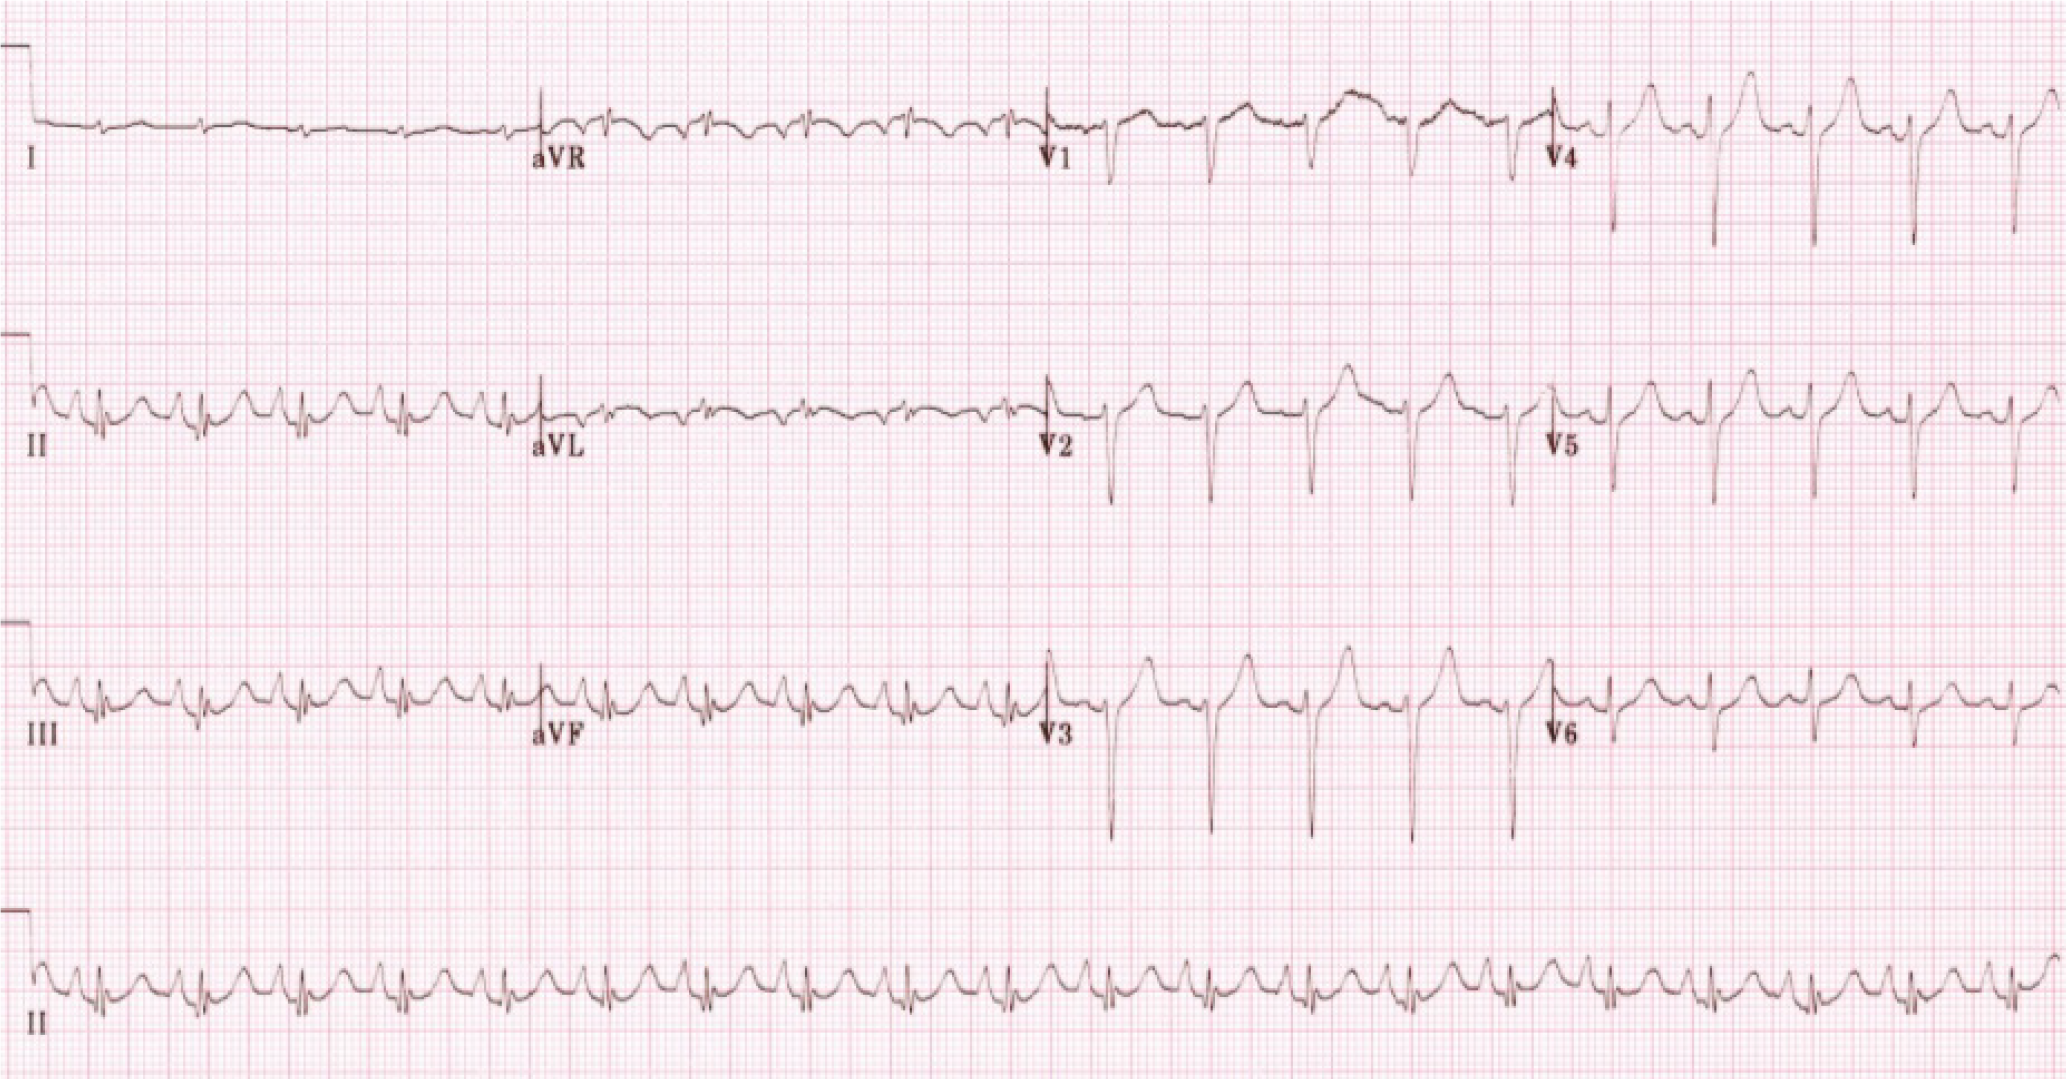
Figure 6 ECG of a patient with chronic lung disease showing precordial QRS changes suggestive of emphysema—poor R wave progression, R < 0.
5 mv in lead V6, R/S < 1 in lead V6 and S wave > 5 mm in leads V5-6. Also note—P-pulmonale, lead I sign and negative P in aVL. Adapted from Burns[40].
Figure 7 S1S2S3 pattern.
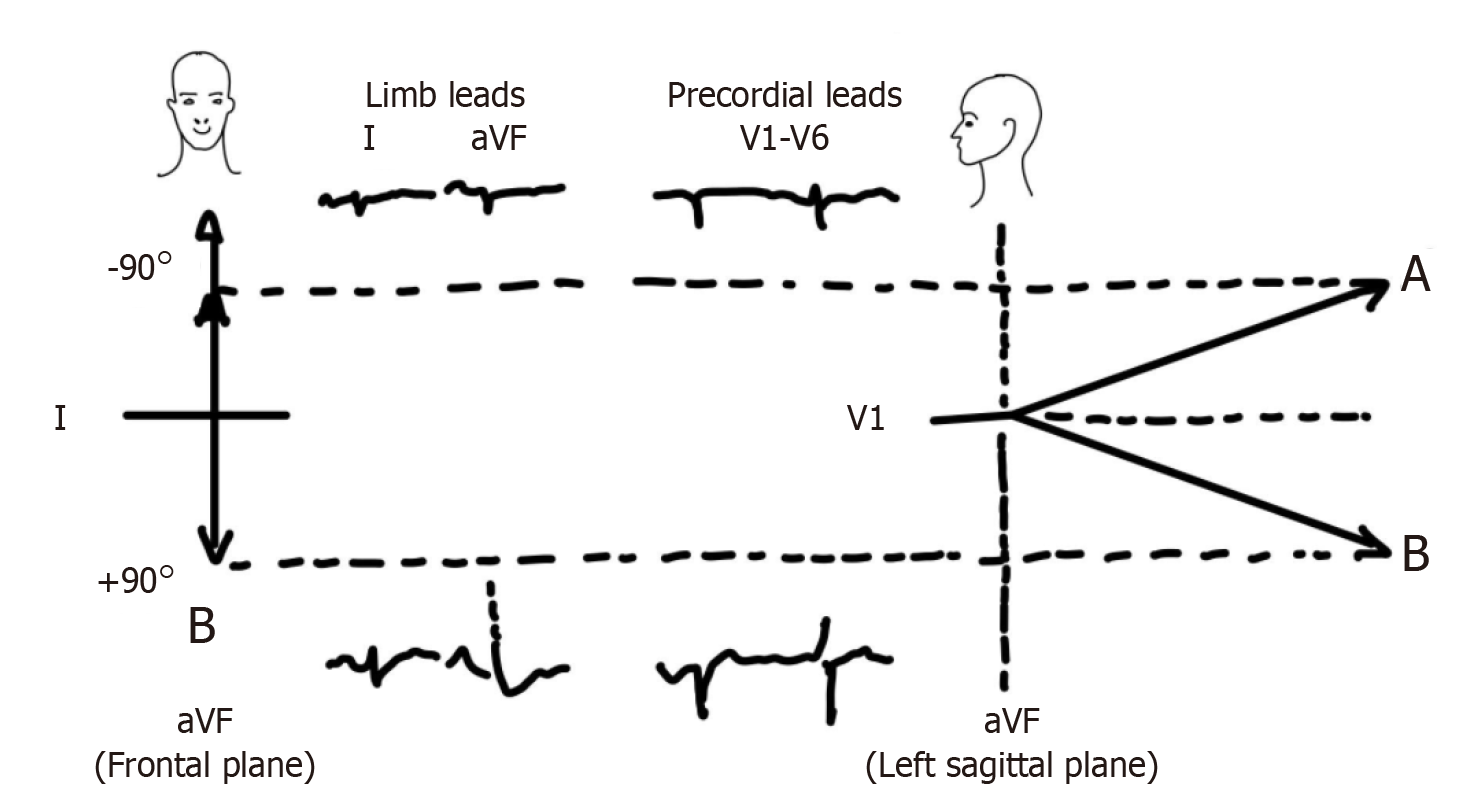
Figure 8 This is a schematic illustration of the axis-illusion phenomenon.
A and B are frontal mean QRS axes of -90° and +90° respectively, suggesting a 180° divergence. Their sagittal projections reveal that this is illusory since they are actually much closer in space. Concept adapted from David Spodick’s work.
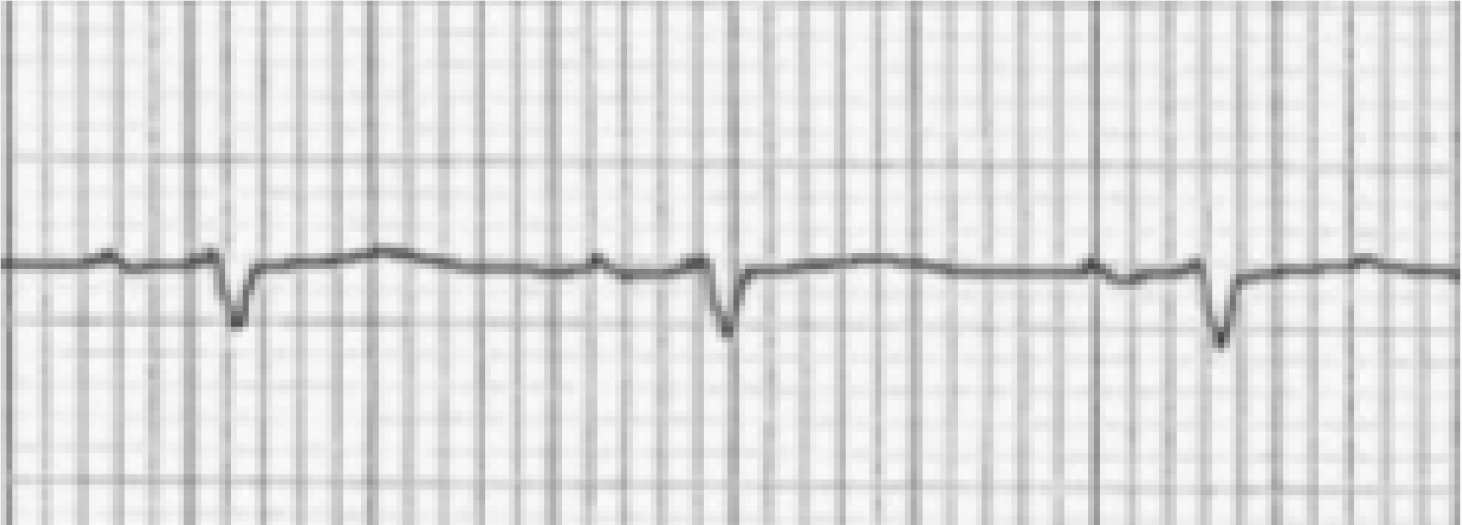
Figure 9 Schematic illustration of Lead I sign in emphysema.
- Citation: Gupta P, Jain H, Gill M, Bharaj G, Khalid N, Chaudhry W, Chhabra L. Electrocardiographic changes in Emphysema. World J Cardiol 2021; 13(10): 533-545
- URL: https://www.wjgnet.com/1949-8462/full/v13/i10/533.htm
- DOI: https://dx.doi.org/10.4330/wjc.v13.i10.533


