Copyright
©The Author(s) 2020.
World J Cardiol. Jul 26, 2020; 12(7): 351-361
Published online Jul 26, 2020. doi: 10.4330/wjc.v12.i7.351
Published online Jul 26, 2020. doi: 10.4330/wjc.v12.i7.351
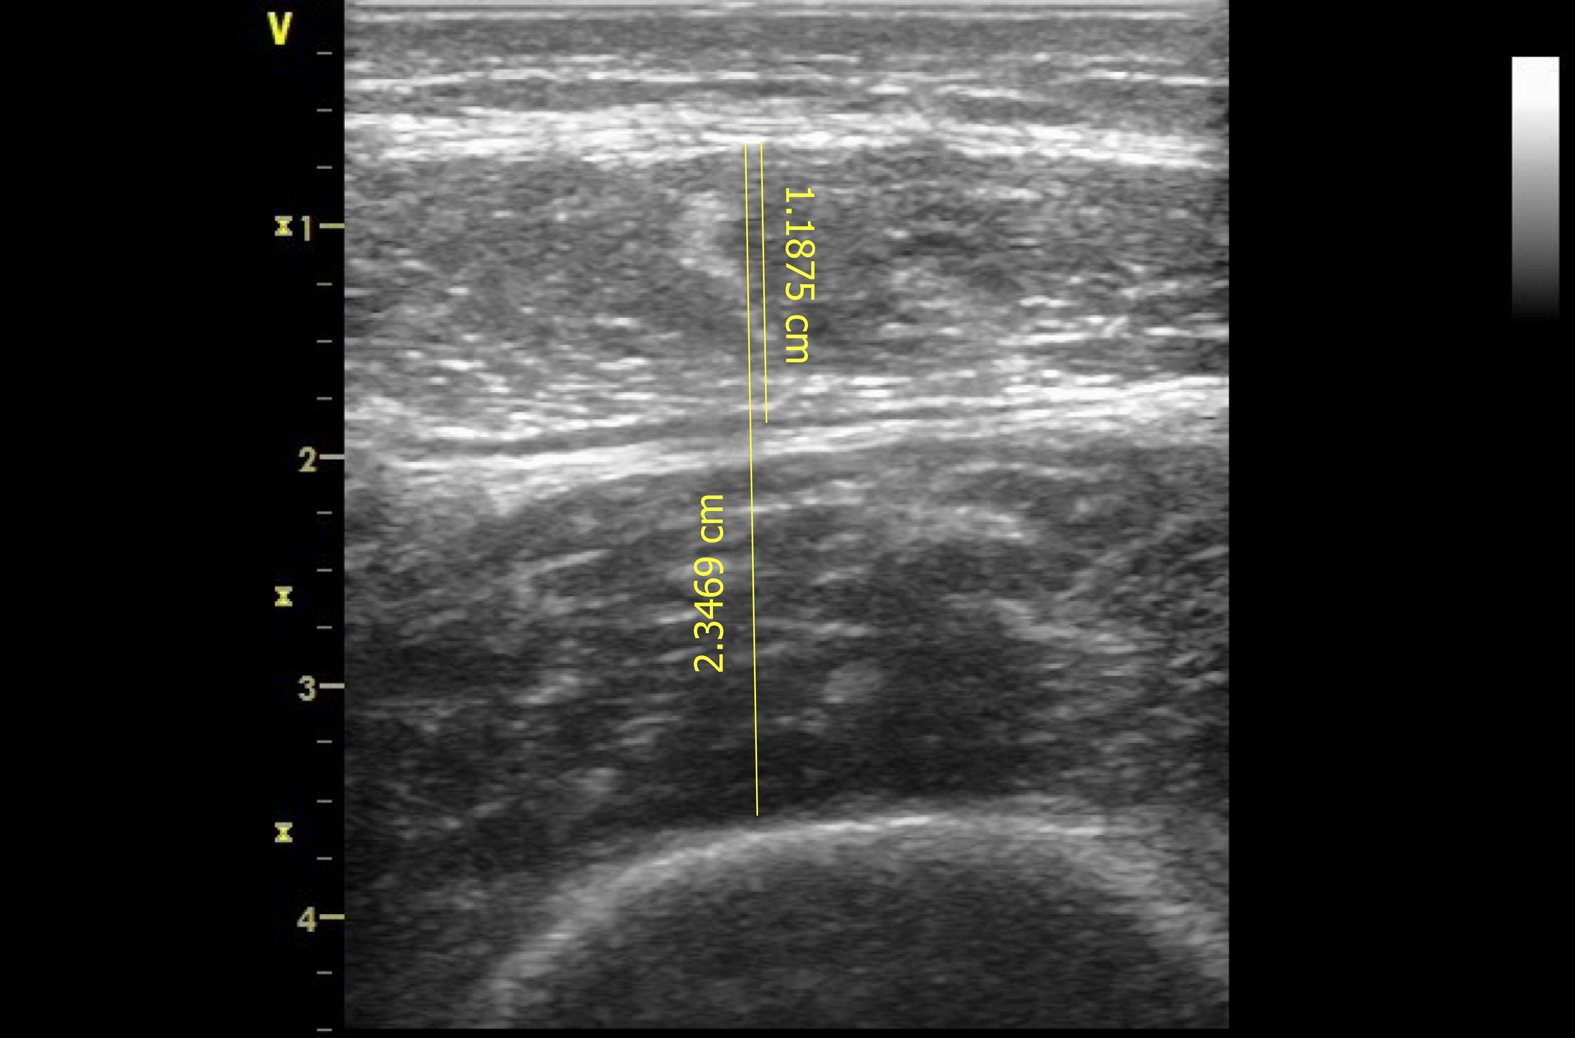
Figure 1 Illustration of sonographic imaging of rectus femoris and rectus femoris and vastus intermedius muscle thickness (1.
19 cm and 2.35 cm, respectively).
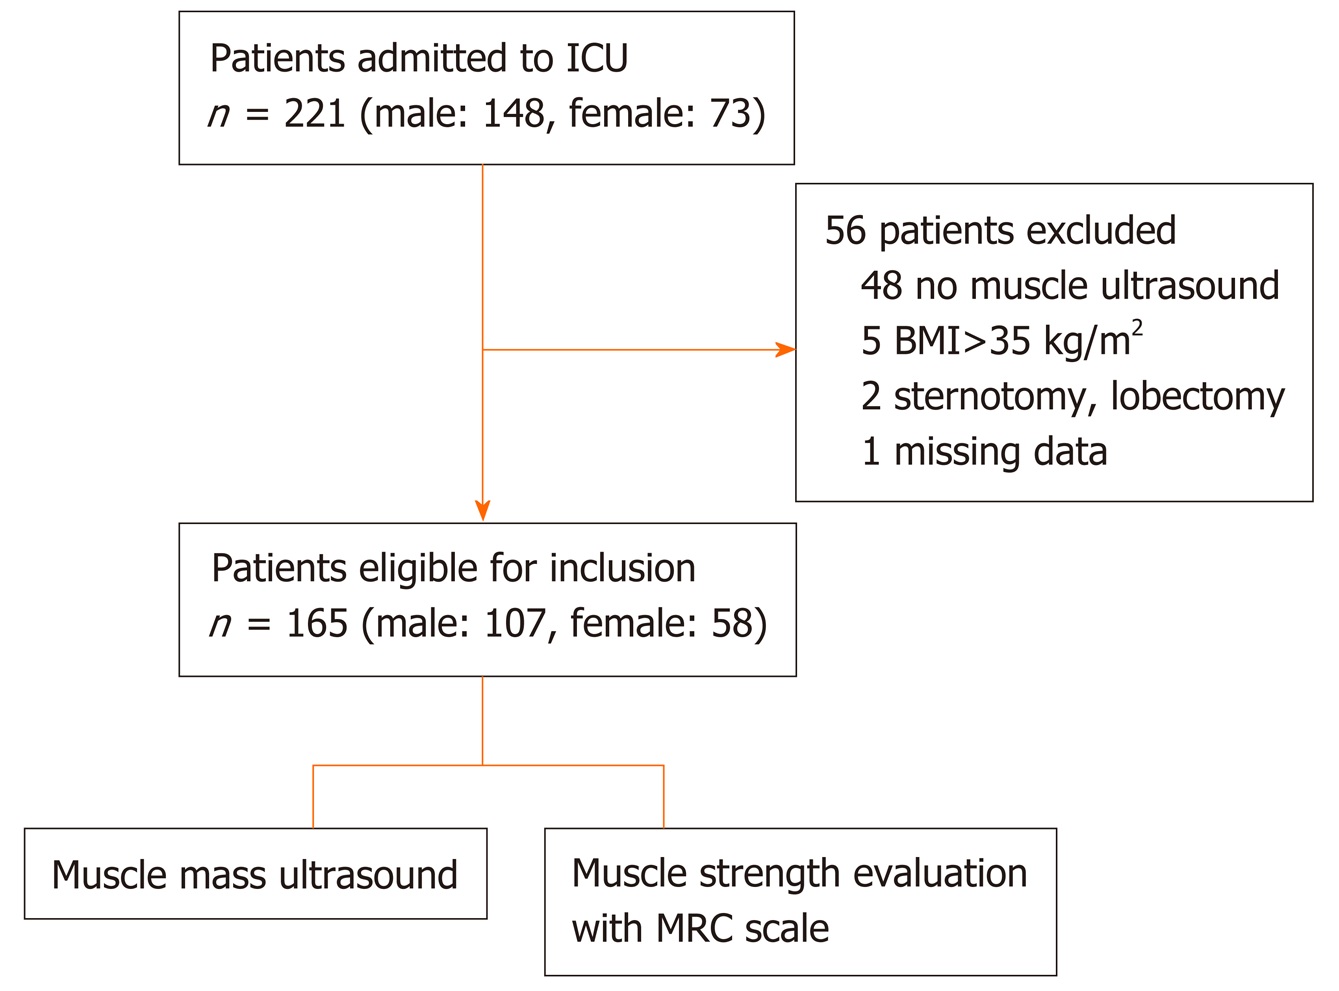
Figure 2 Flowchart of the intensive care unit patients enrolled for the study.
ICU: Intensive care unit; BMI: Body mass index; MRC: Medical Research Council.
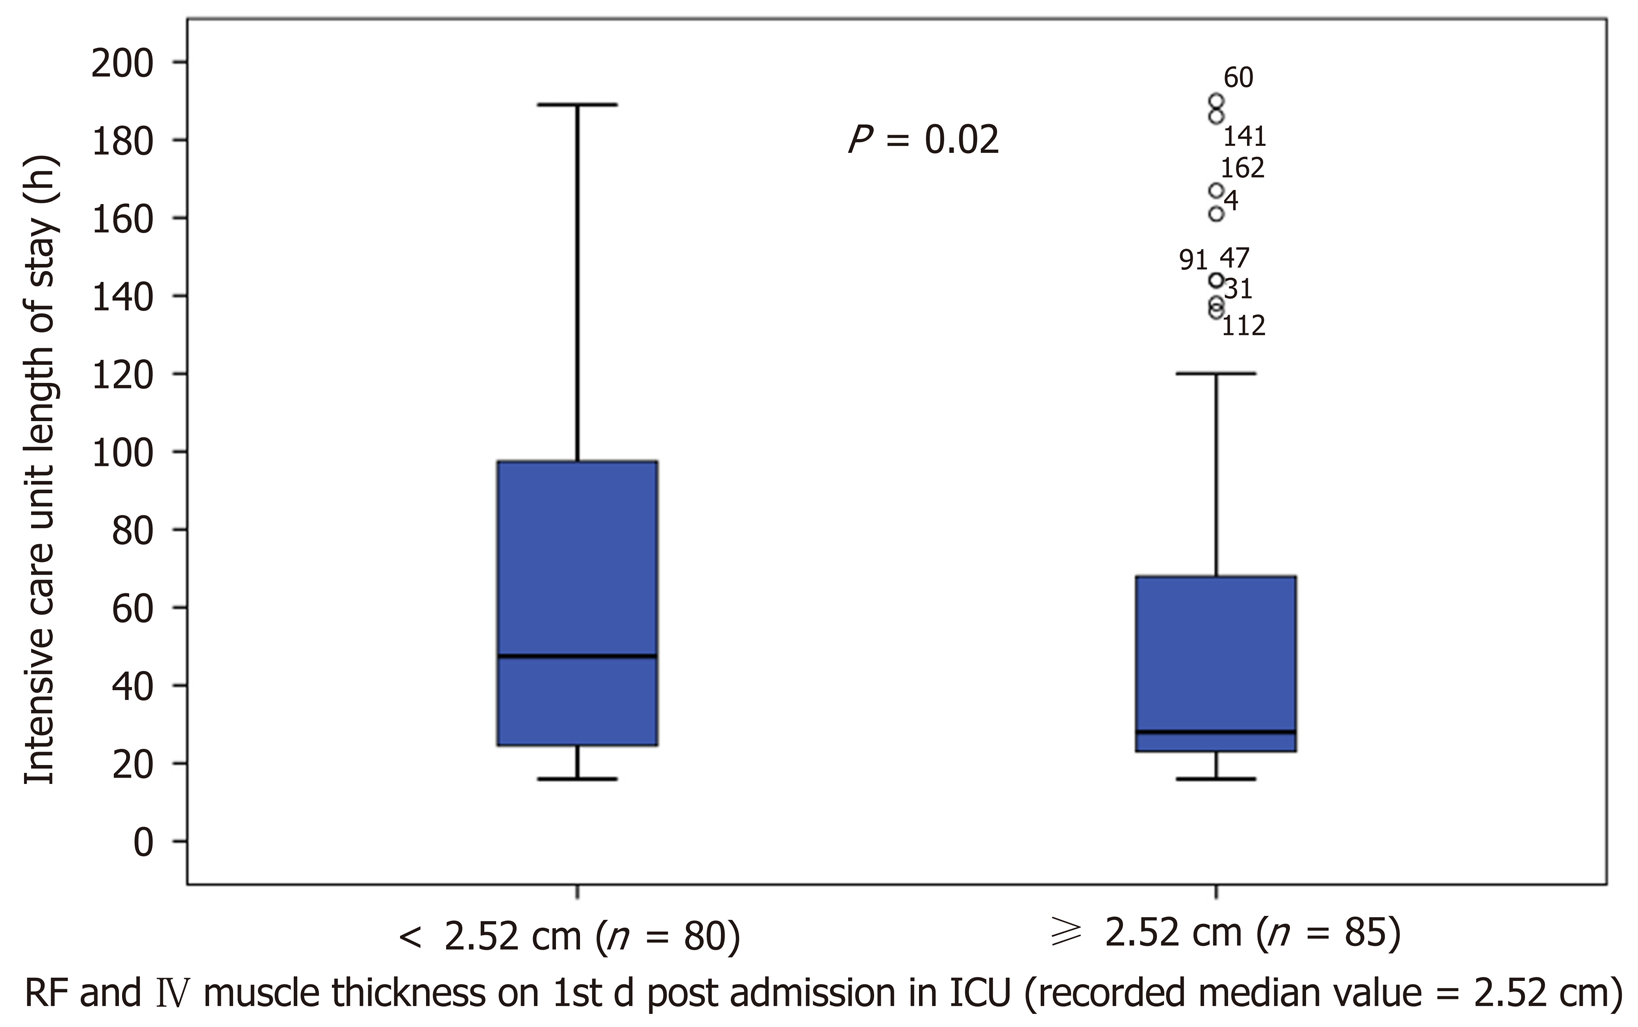
Figure 3 Intensive care unit length of stay of patients in which rectus femoris and vastus intermedius mass was below and above the recorded median values on day 1 post intensive care unit admission.
ICU: Intensive care unit; RF: Rectus femoris; VI: Vastus intermedius.
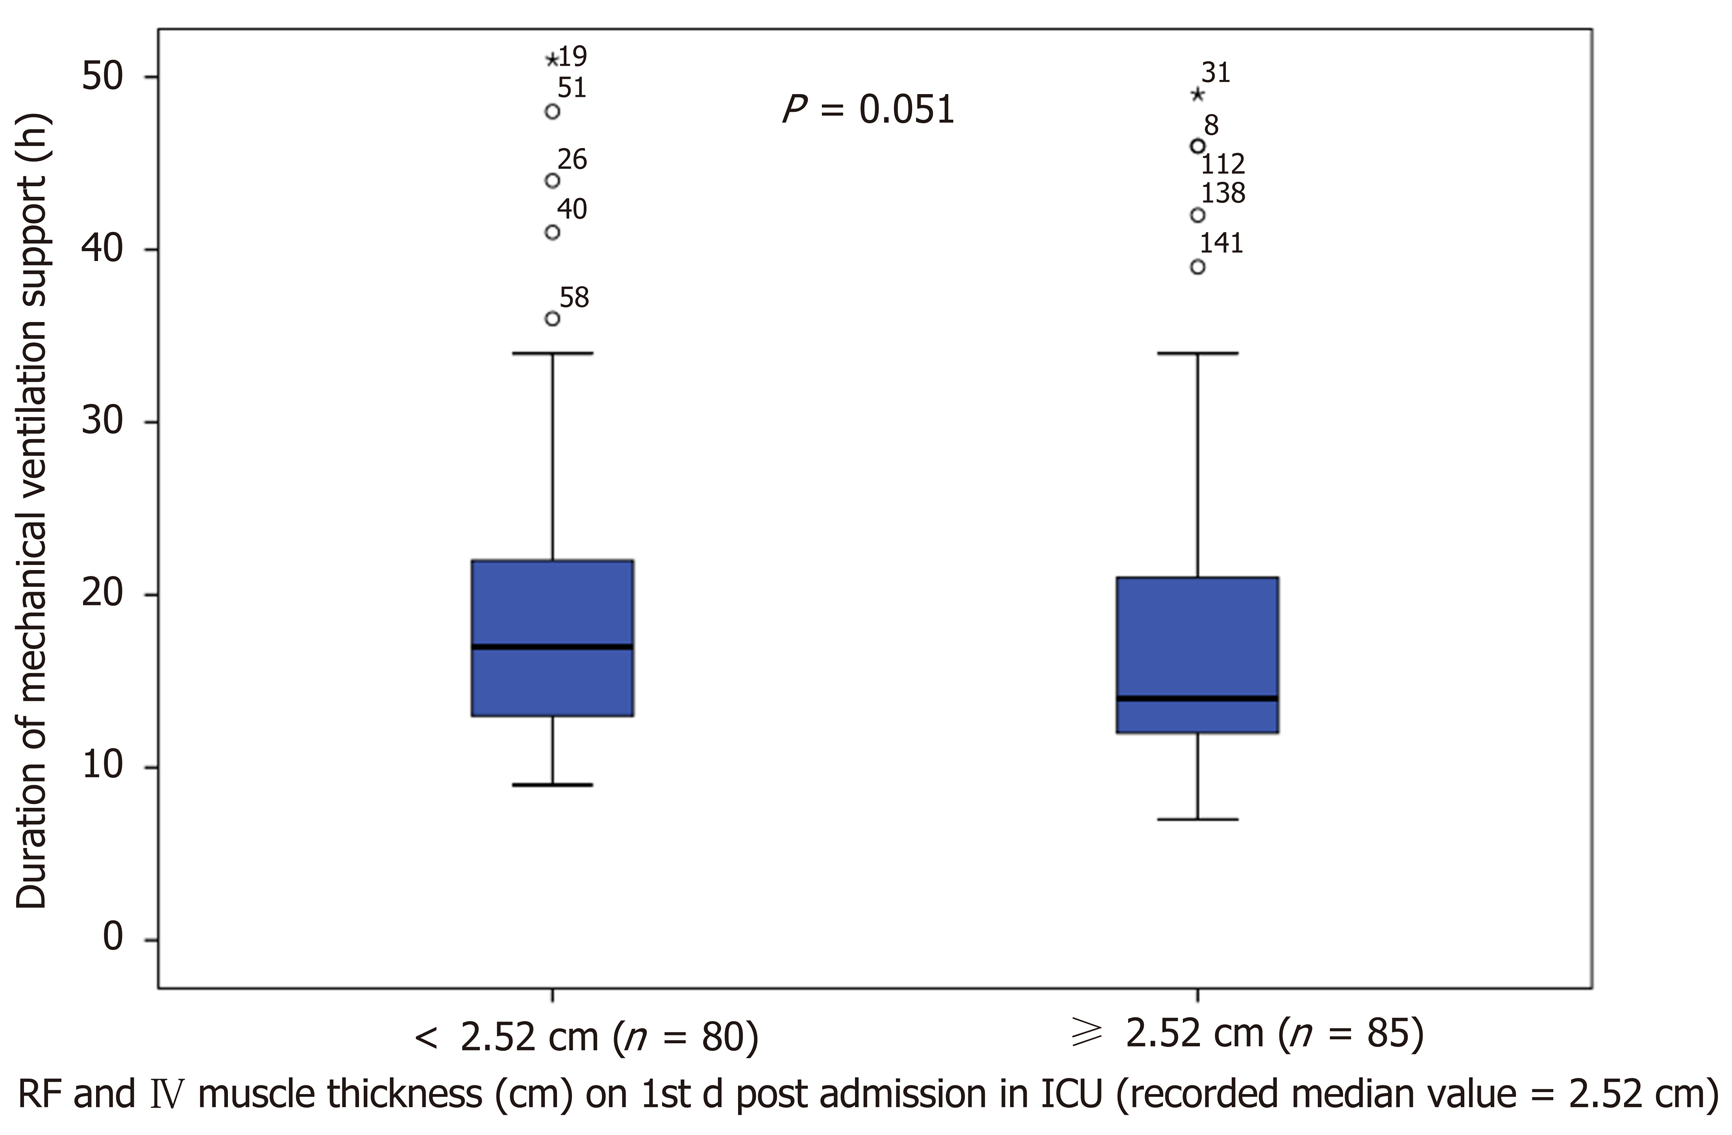
Figure 4 Duration of mechanical ventilation of patients’ rectus femoris and vastus intermedius mass was below and above the recorded median values on day 1 post ICU admission.
ICU: Intensive care unit; RF: Rectus femoris; VI: Vastus intermedius.
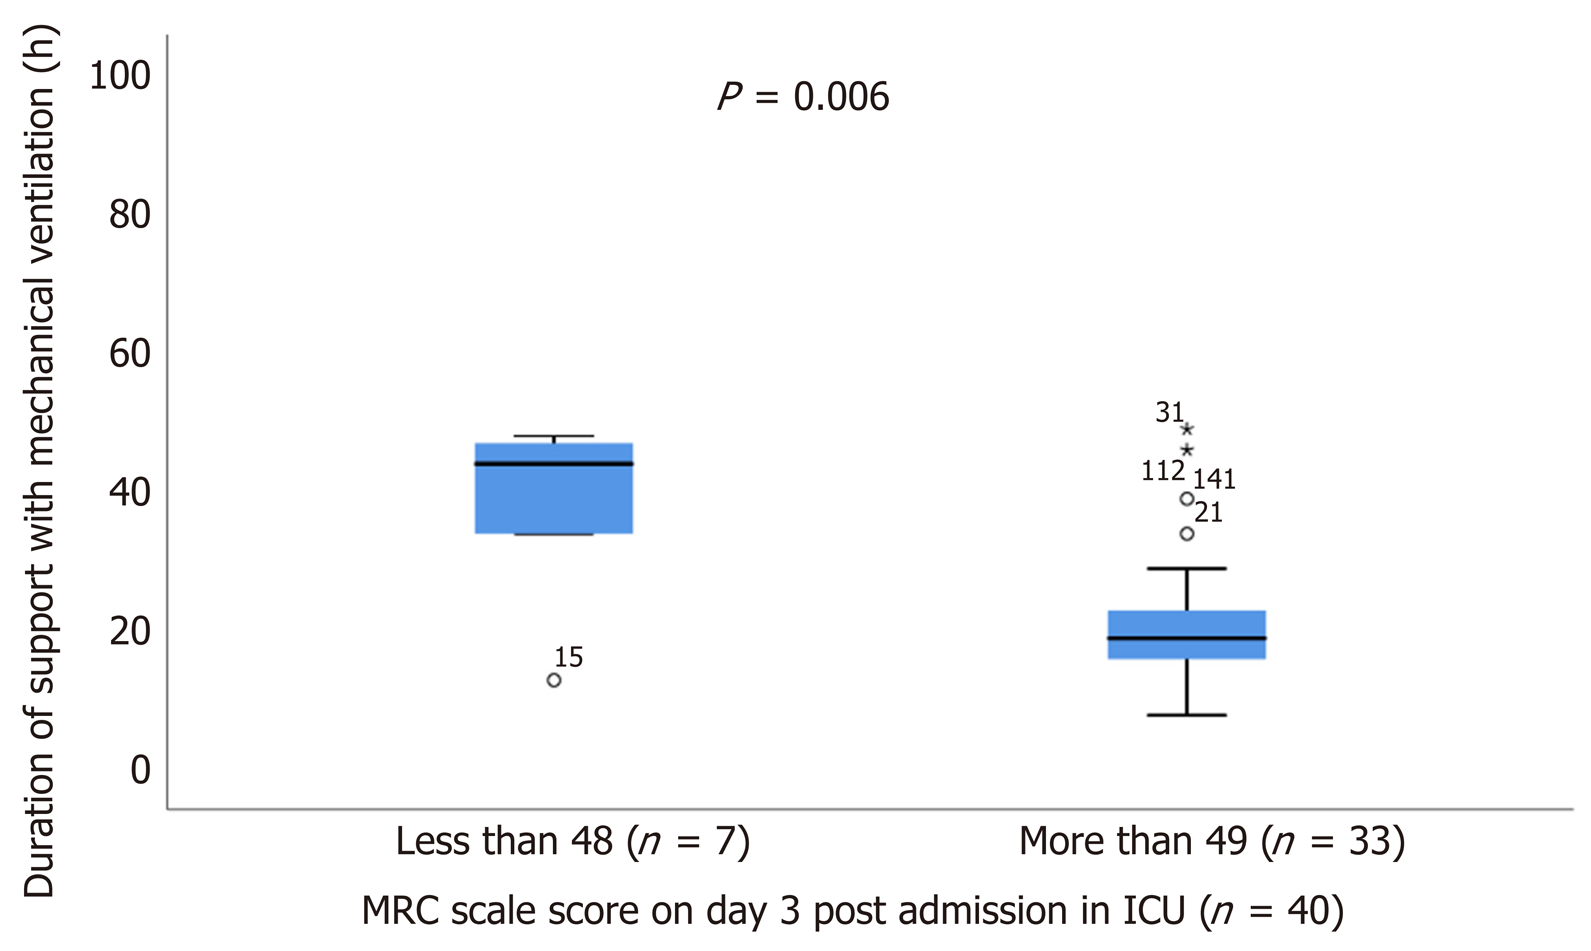
Figure 5 Duration of mechanical ventilation of patients with Medical Research Council scale score below and above 48 on day 3 post admission in intensive care unit.
MRC: Medical Research Council; ICU: Intensive care unit.
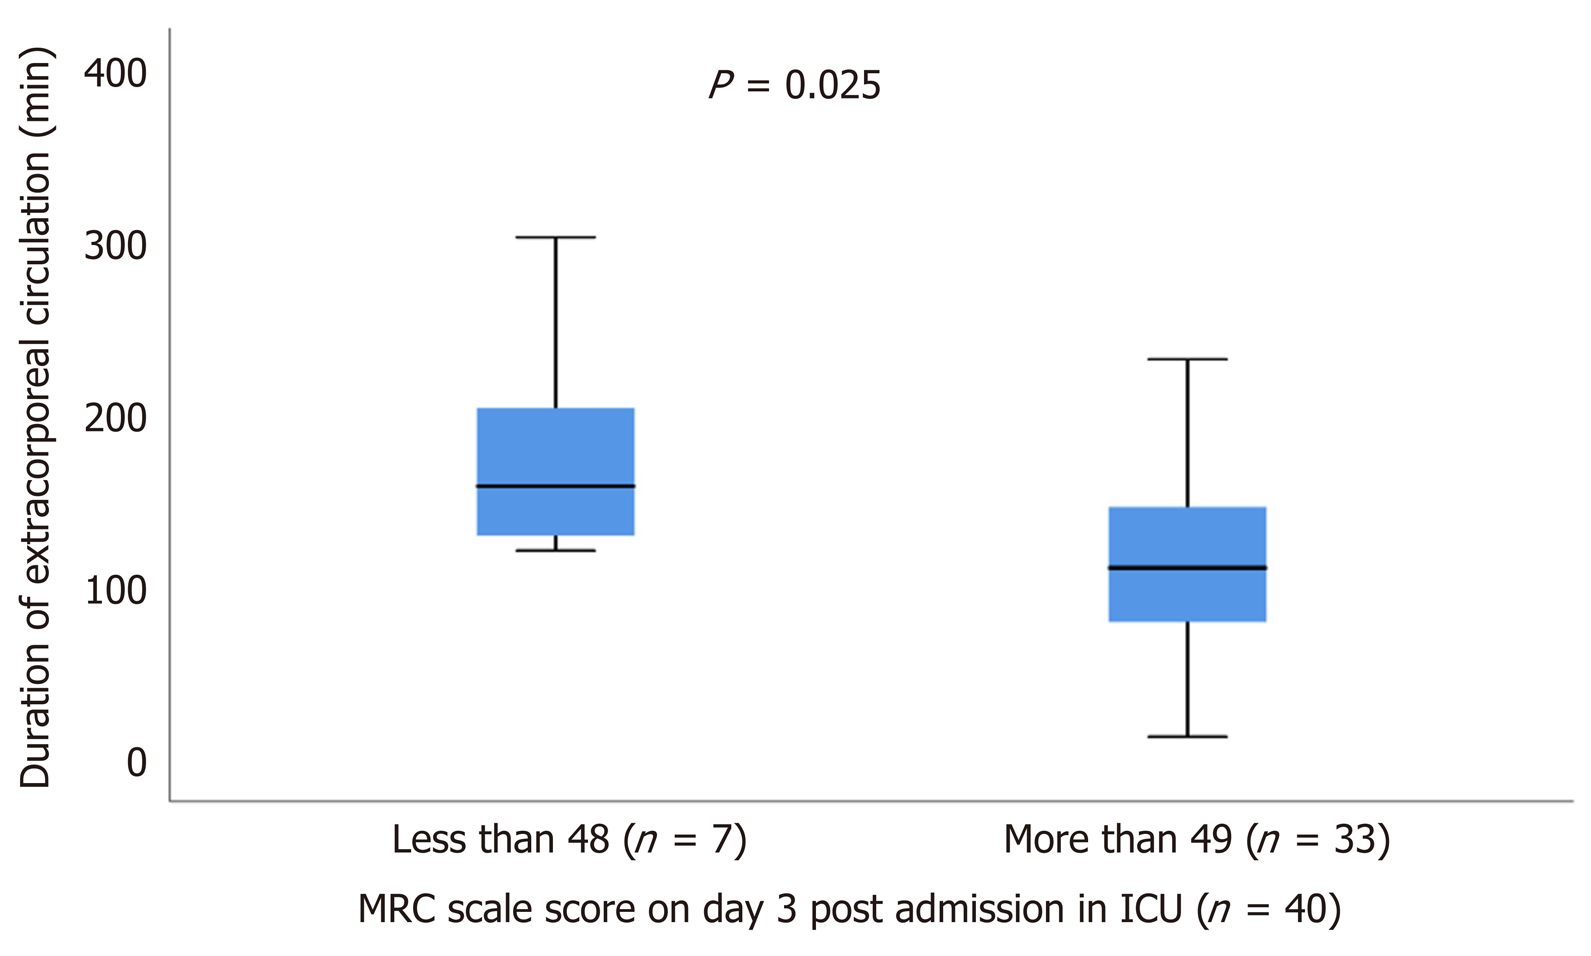
Figure 6 Duration of extracorporeal circulation of patients with Medical Research Council scale score below and above 48 on day 3 post admission in intensive care unit.
MRC: Medical Research Council; ICU: Intensive care unit.
- Citation: Dimopoulos S, Raidou V, Elaiopoulos D, Chatzivasiloglou F, Markantonaki D, Lyberopoulou E, Vasileiadis I, Marathias K, Nanas S, Karabinis A. Sonographic muscle mass assessment in patients after cardiac surgery. World J Cardiol 2020; 12(7): 351-361
- URL: https://www.wjgnet.com/1949-8462/full/v12/i7/351.htm
- DOI: https://dx.doi.org/10.4330/wjc.v12.i7.351


