Copyright
©The Author(s) 2020.
World J Cardiol. May 26, 2020; 12(5): 220-227
Published online May 26, 2020. doi: 10.4330/wjc.v12.i5.220
Published online May 26, 2020. doi: 10.4330/wjc.v12.i5.220
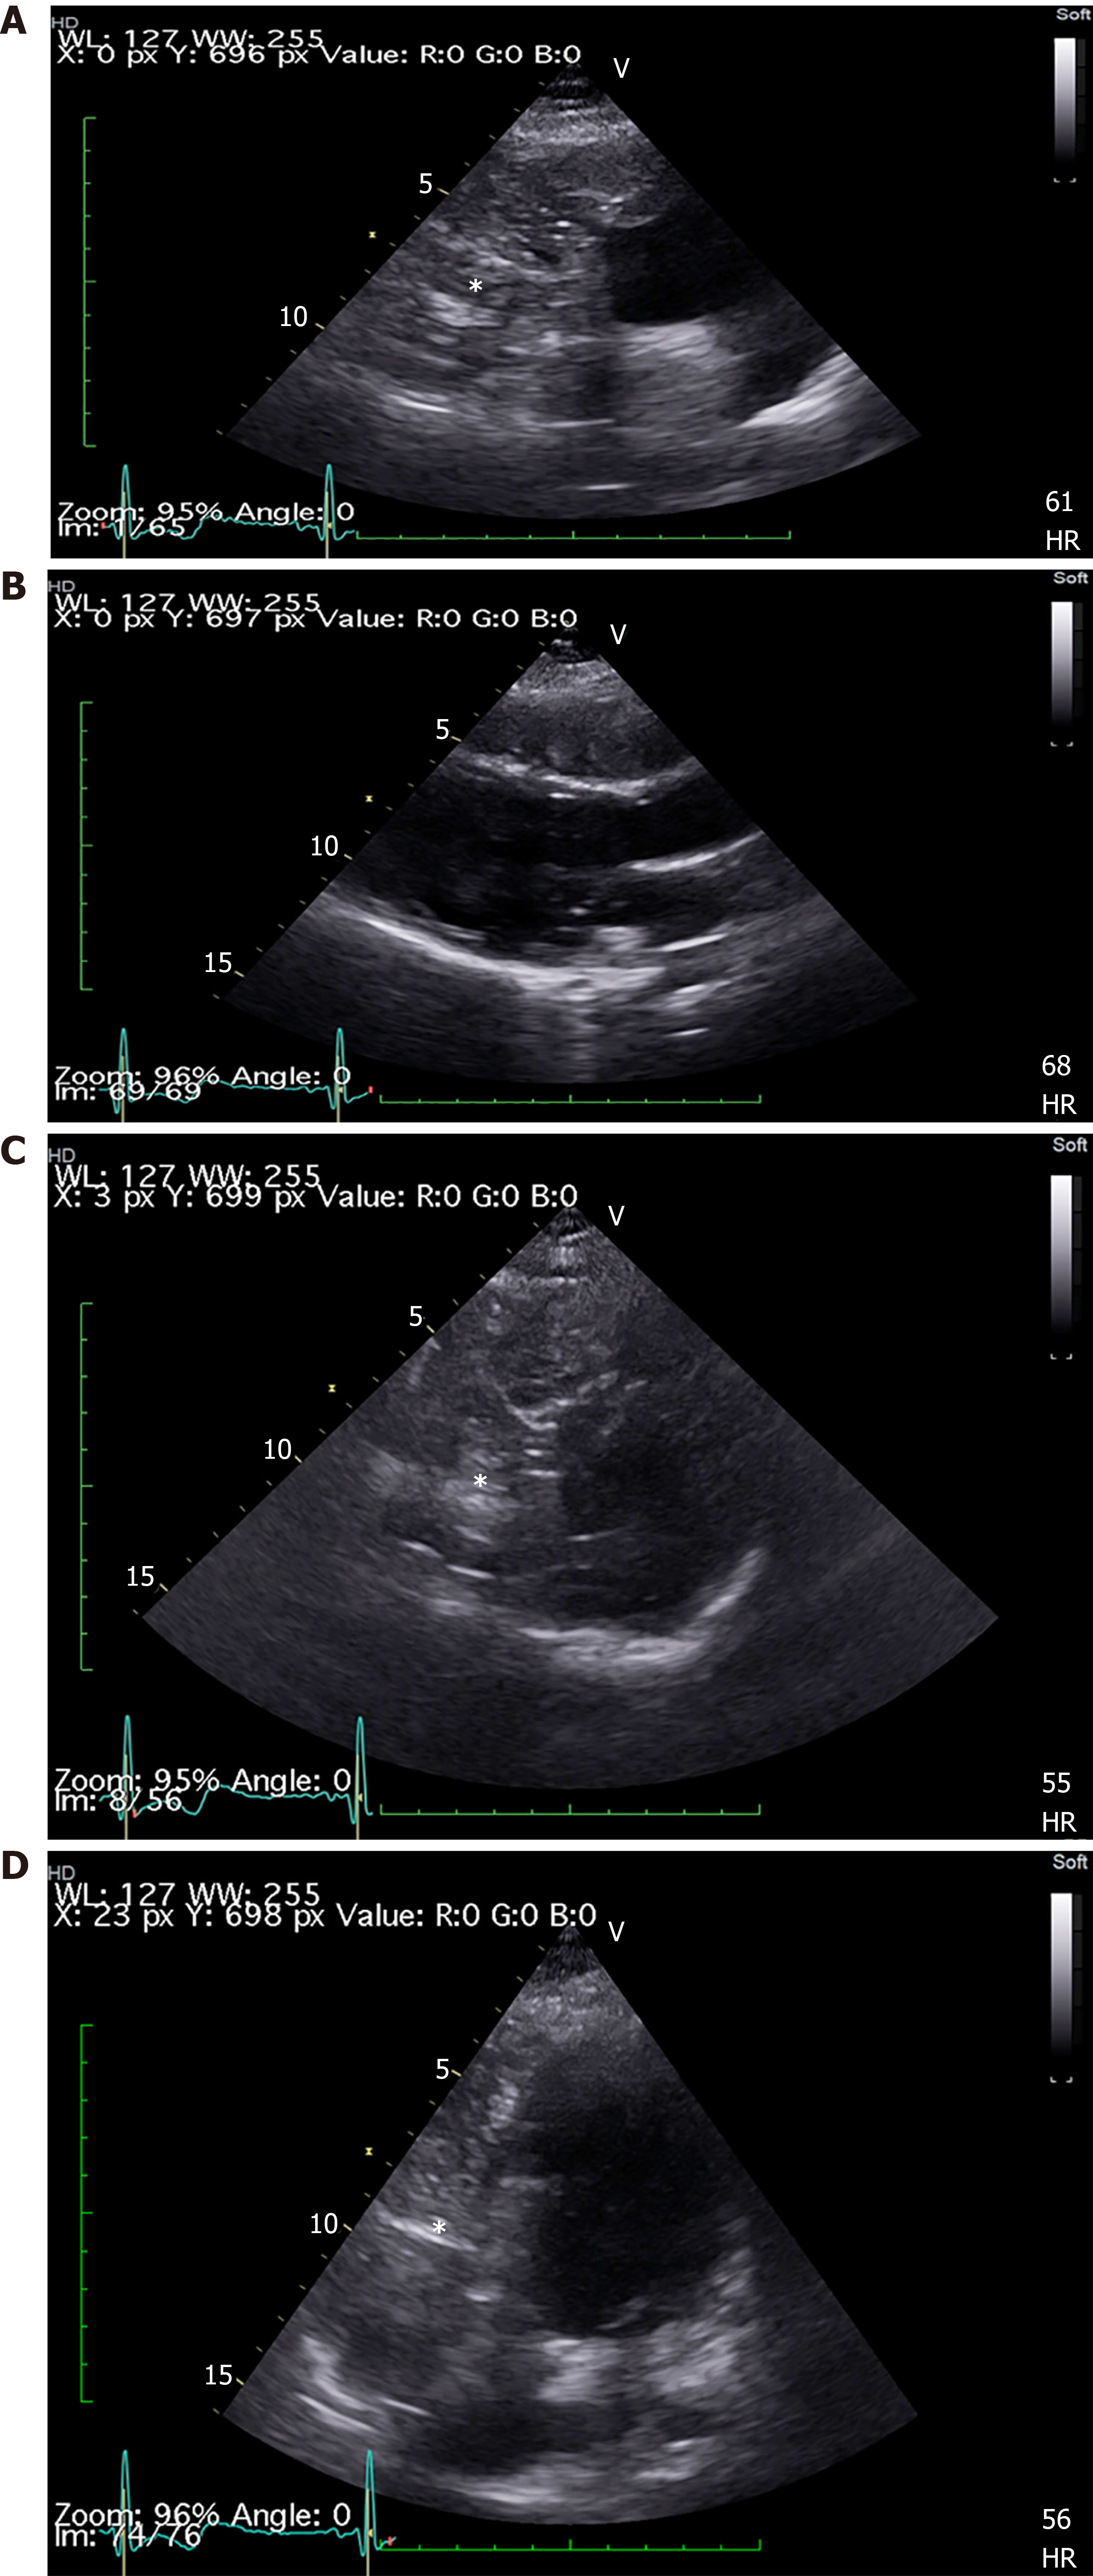
Figure 1 Transthoracic echocardiogram.
A, C: Right ventricular mass (star) in short axis view; B: No mass in long axis view; D: Four-chamber view.
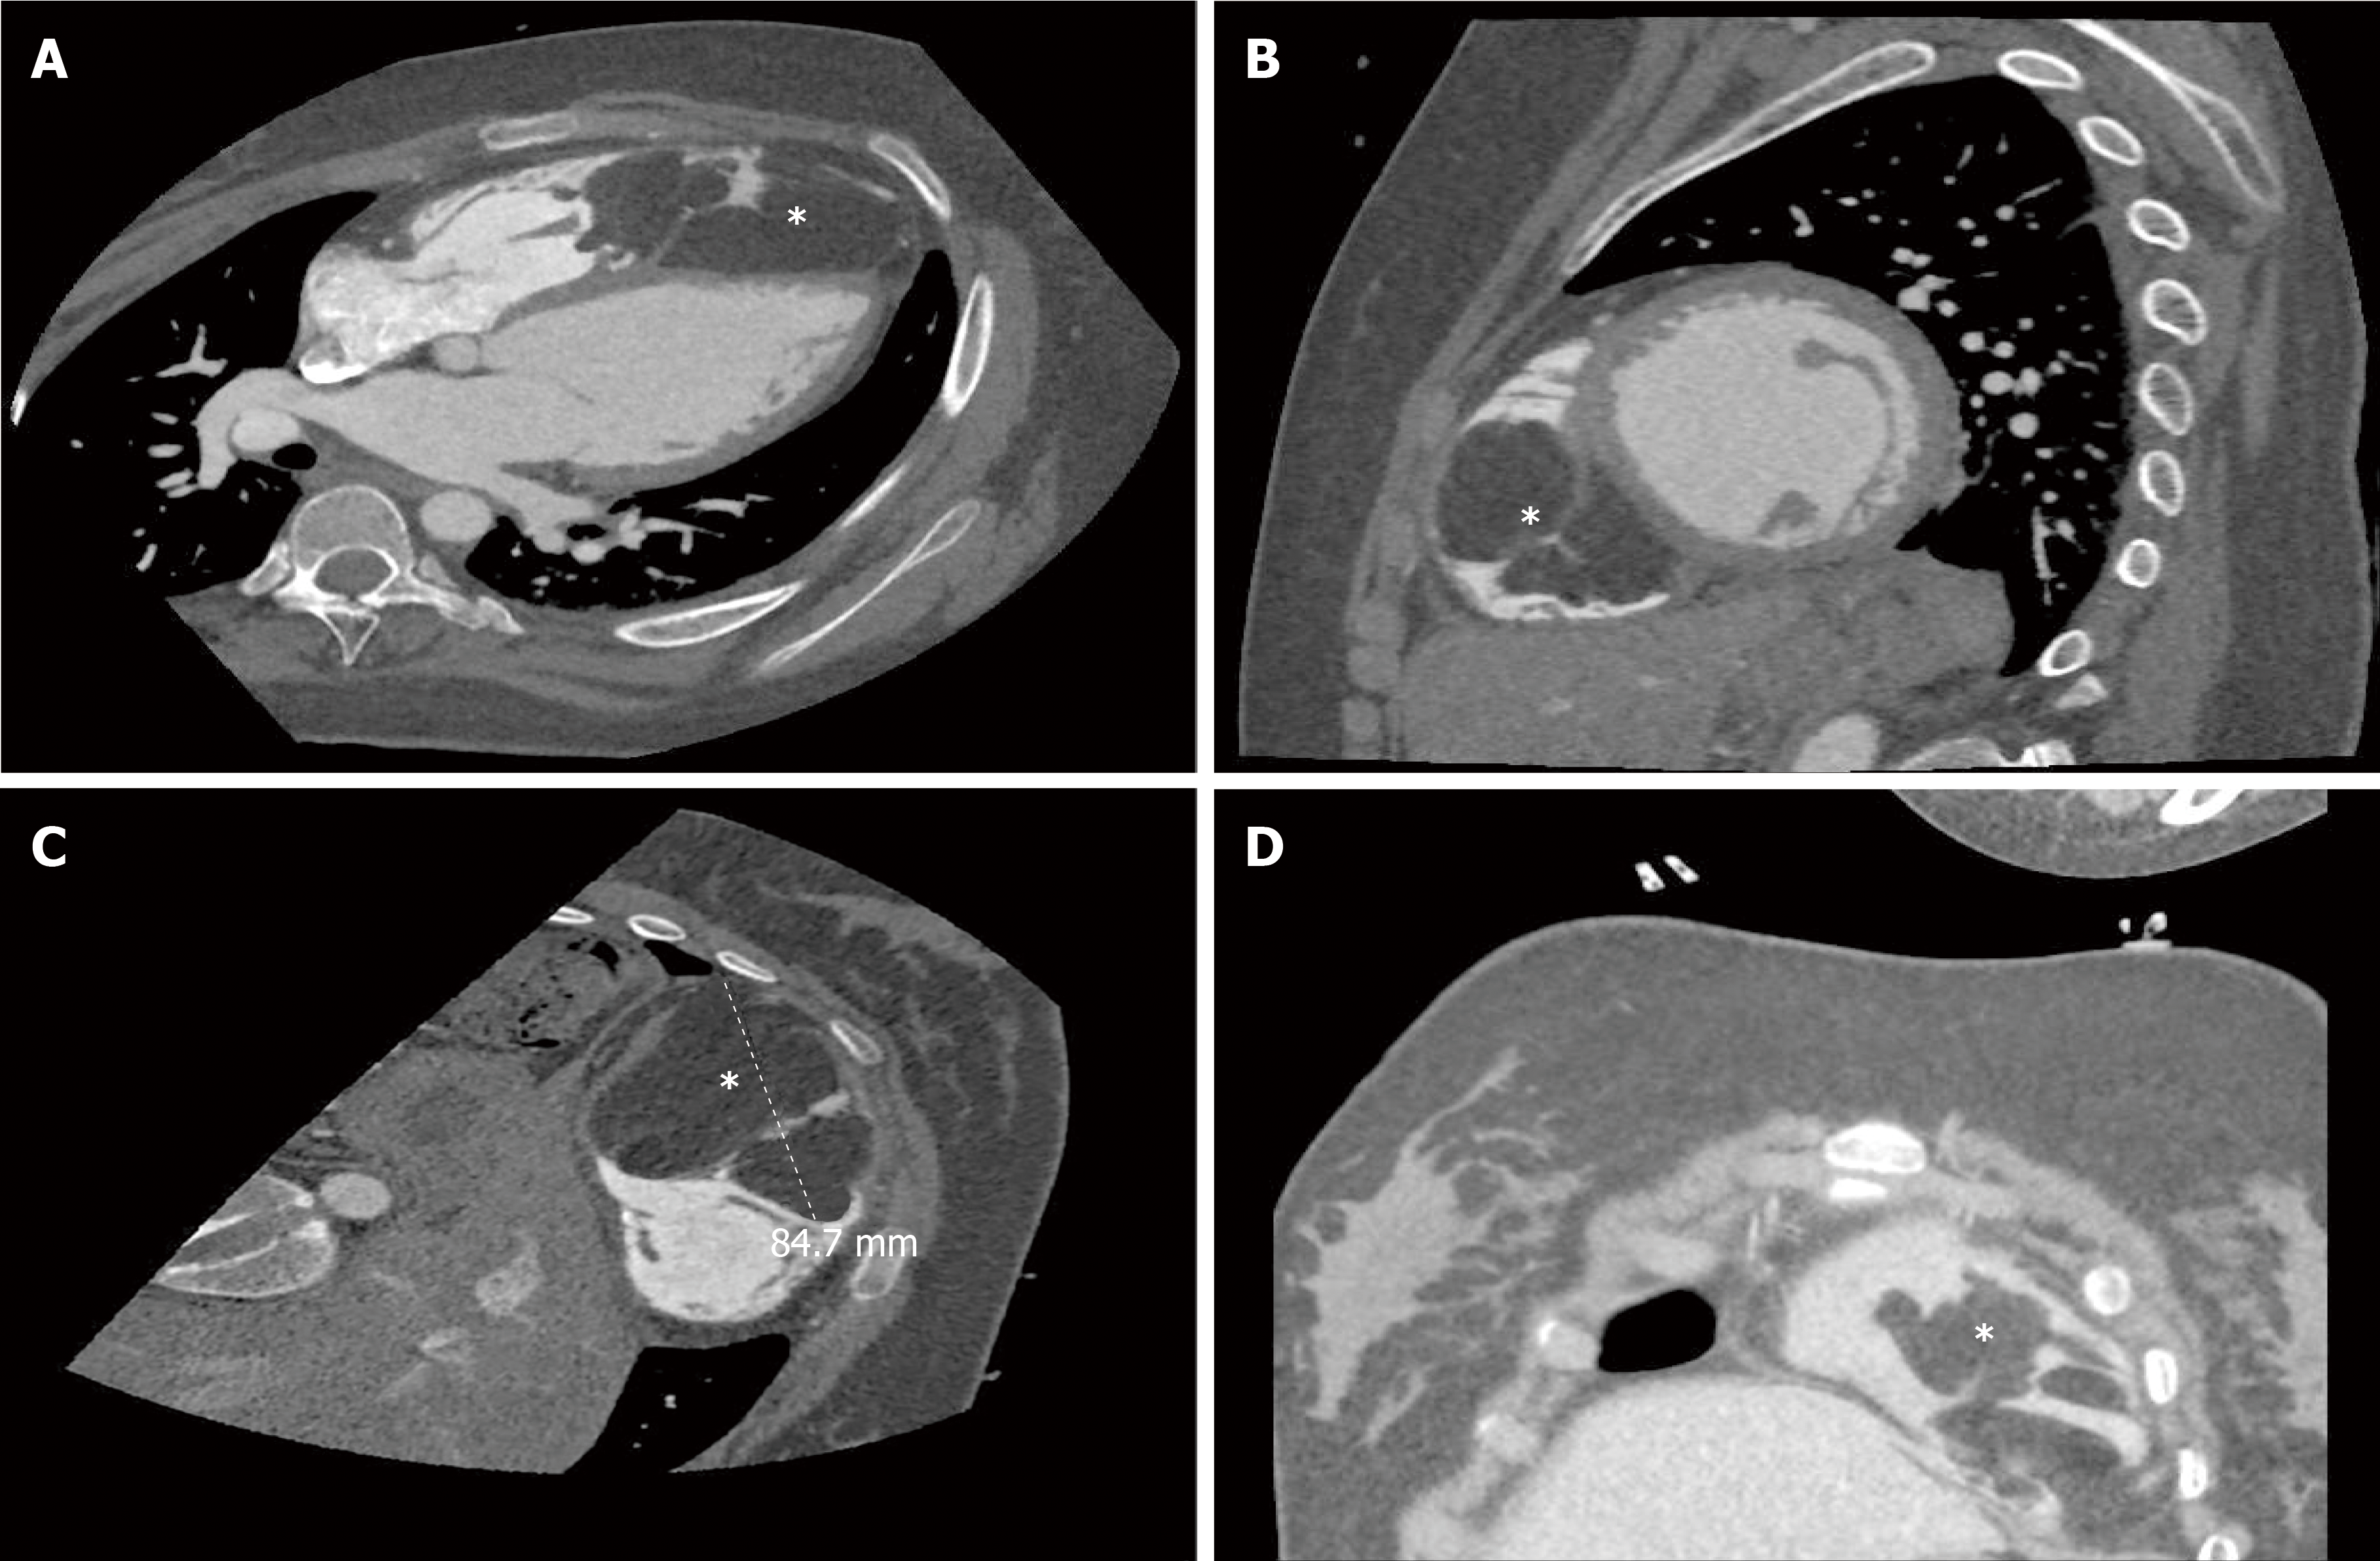
Figure 2 Computed tomography scan.
A, B: A mass (star) occupying the right ventricle in axial plane (A), sagittal plane (B); C, D: Atypical plane maximal diameter 84 mm (star).
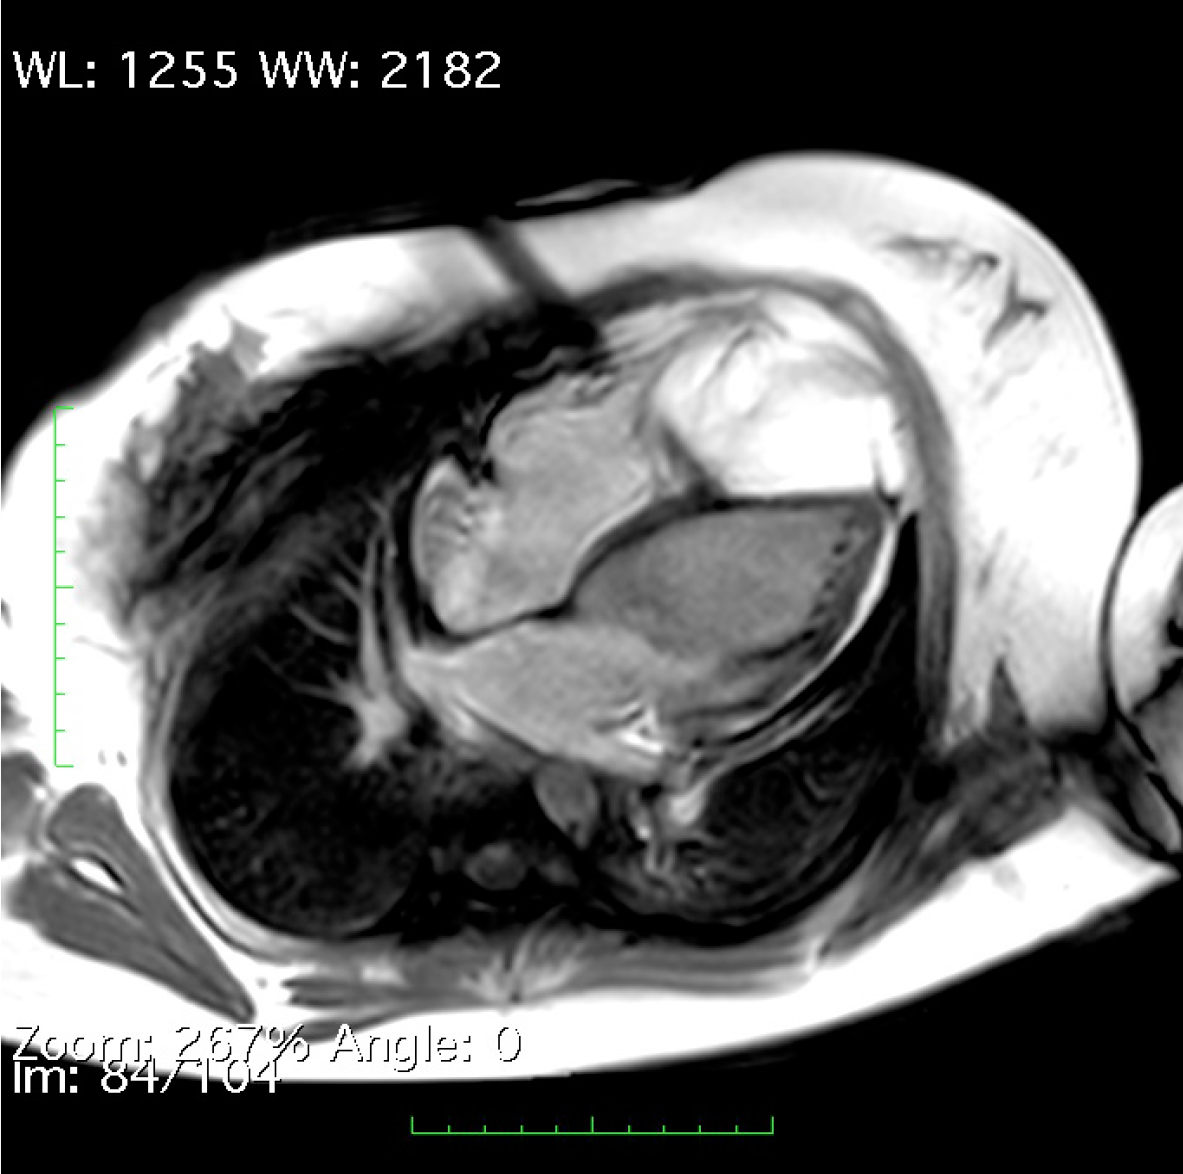
Figure 3 Cine-cardiac magnetic resonance imaging.
An encapsulated mass (star) occupying the apical right ventricle. A: Horizontal long axis; B: Vertical long axis; C: Short axis.
Figure 4 Cardiac magnetic resonance.
A: A right ventricular mass (star) appearing white in T1-weighted sequence; B: Dark (star) in T2-weighted sequence; C: A dark signal (star) dropout in T1-weighted fast spin-echo sequences.
Figure 5 Cardiac magnetic resonance shows no delayed gadolinium enhancement.
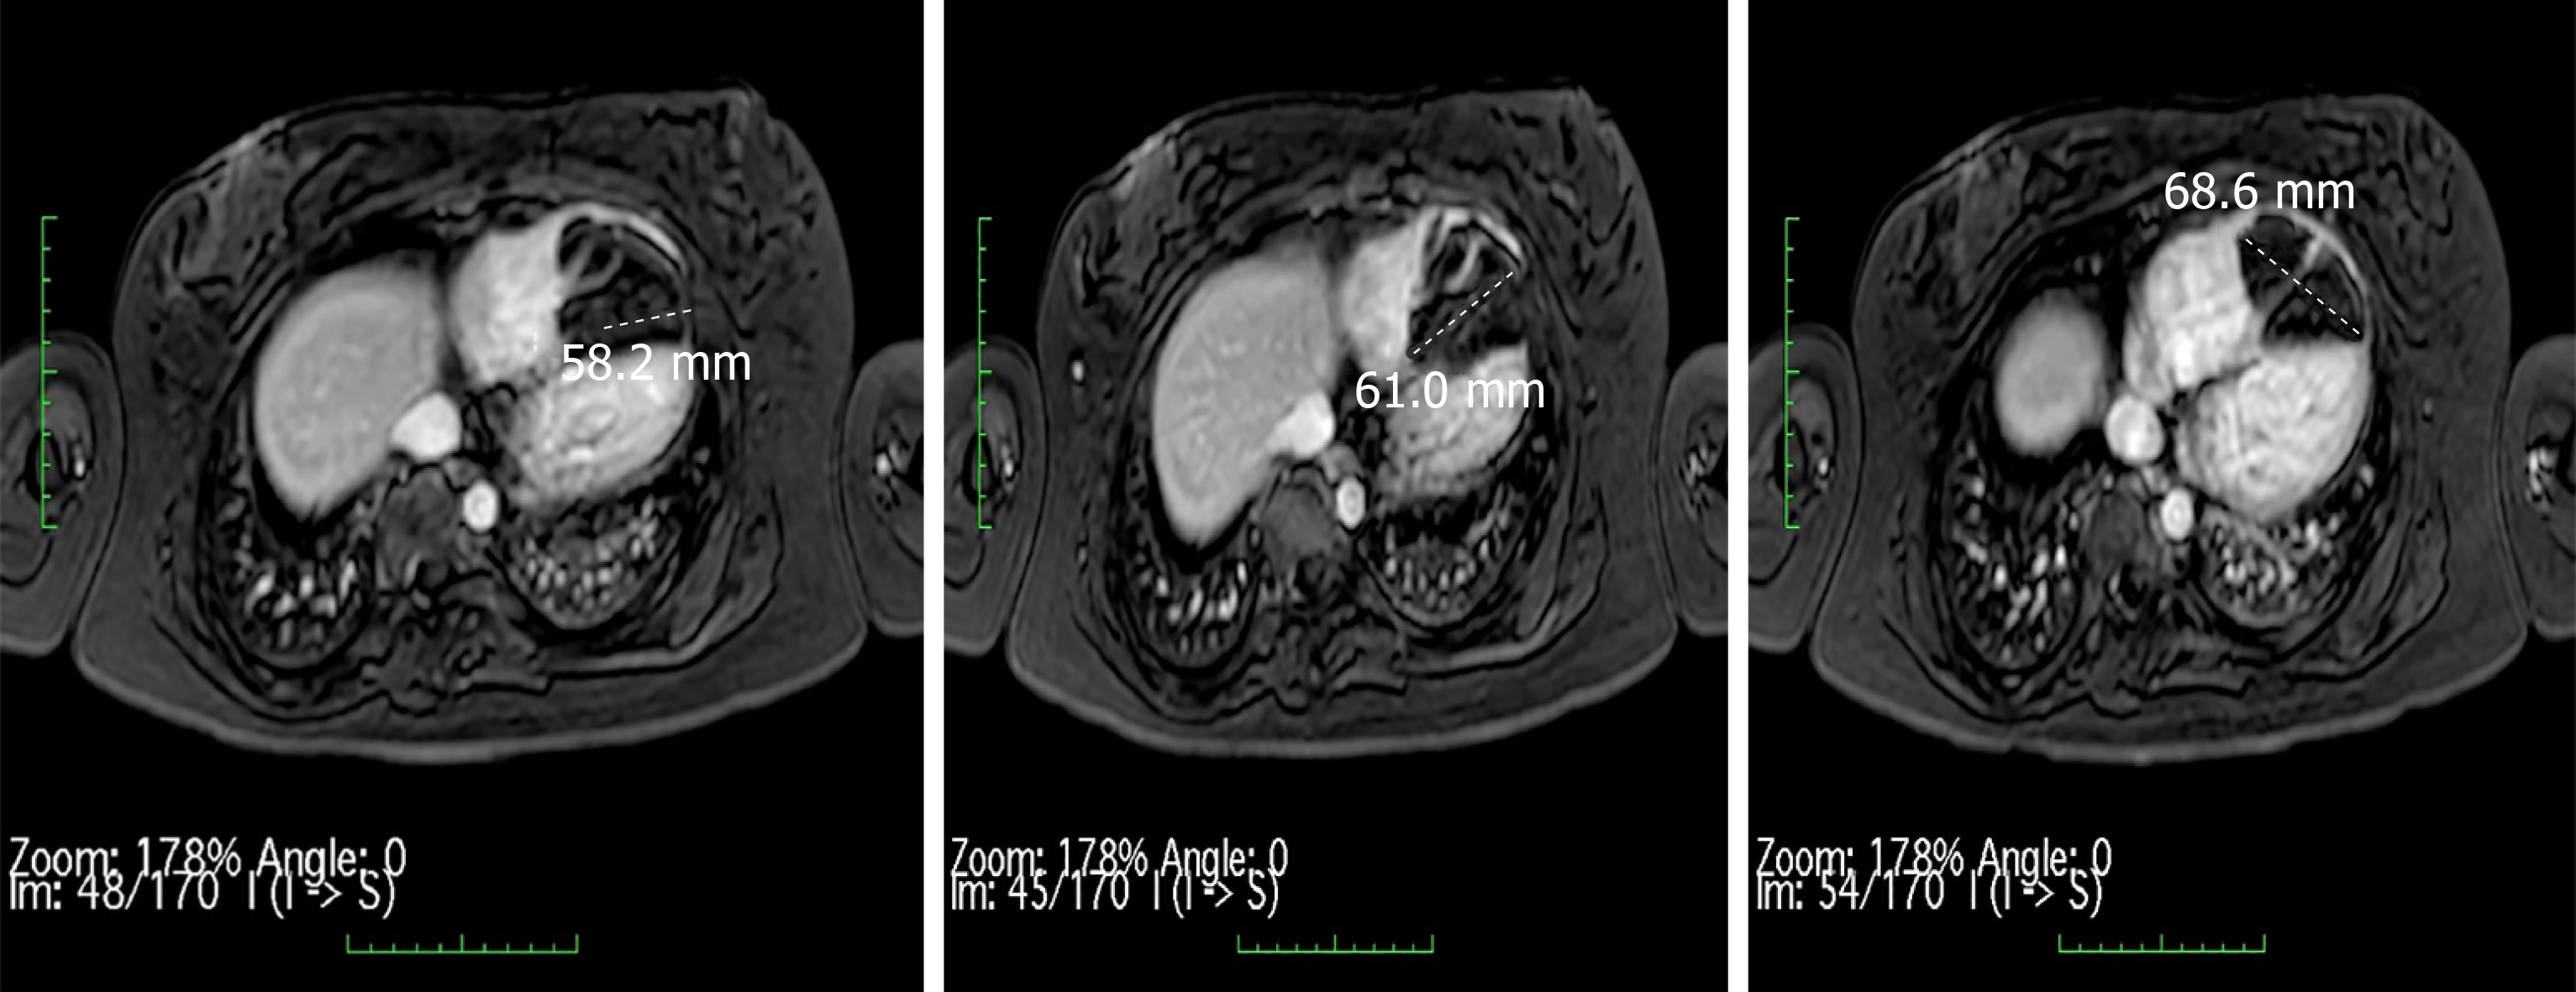
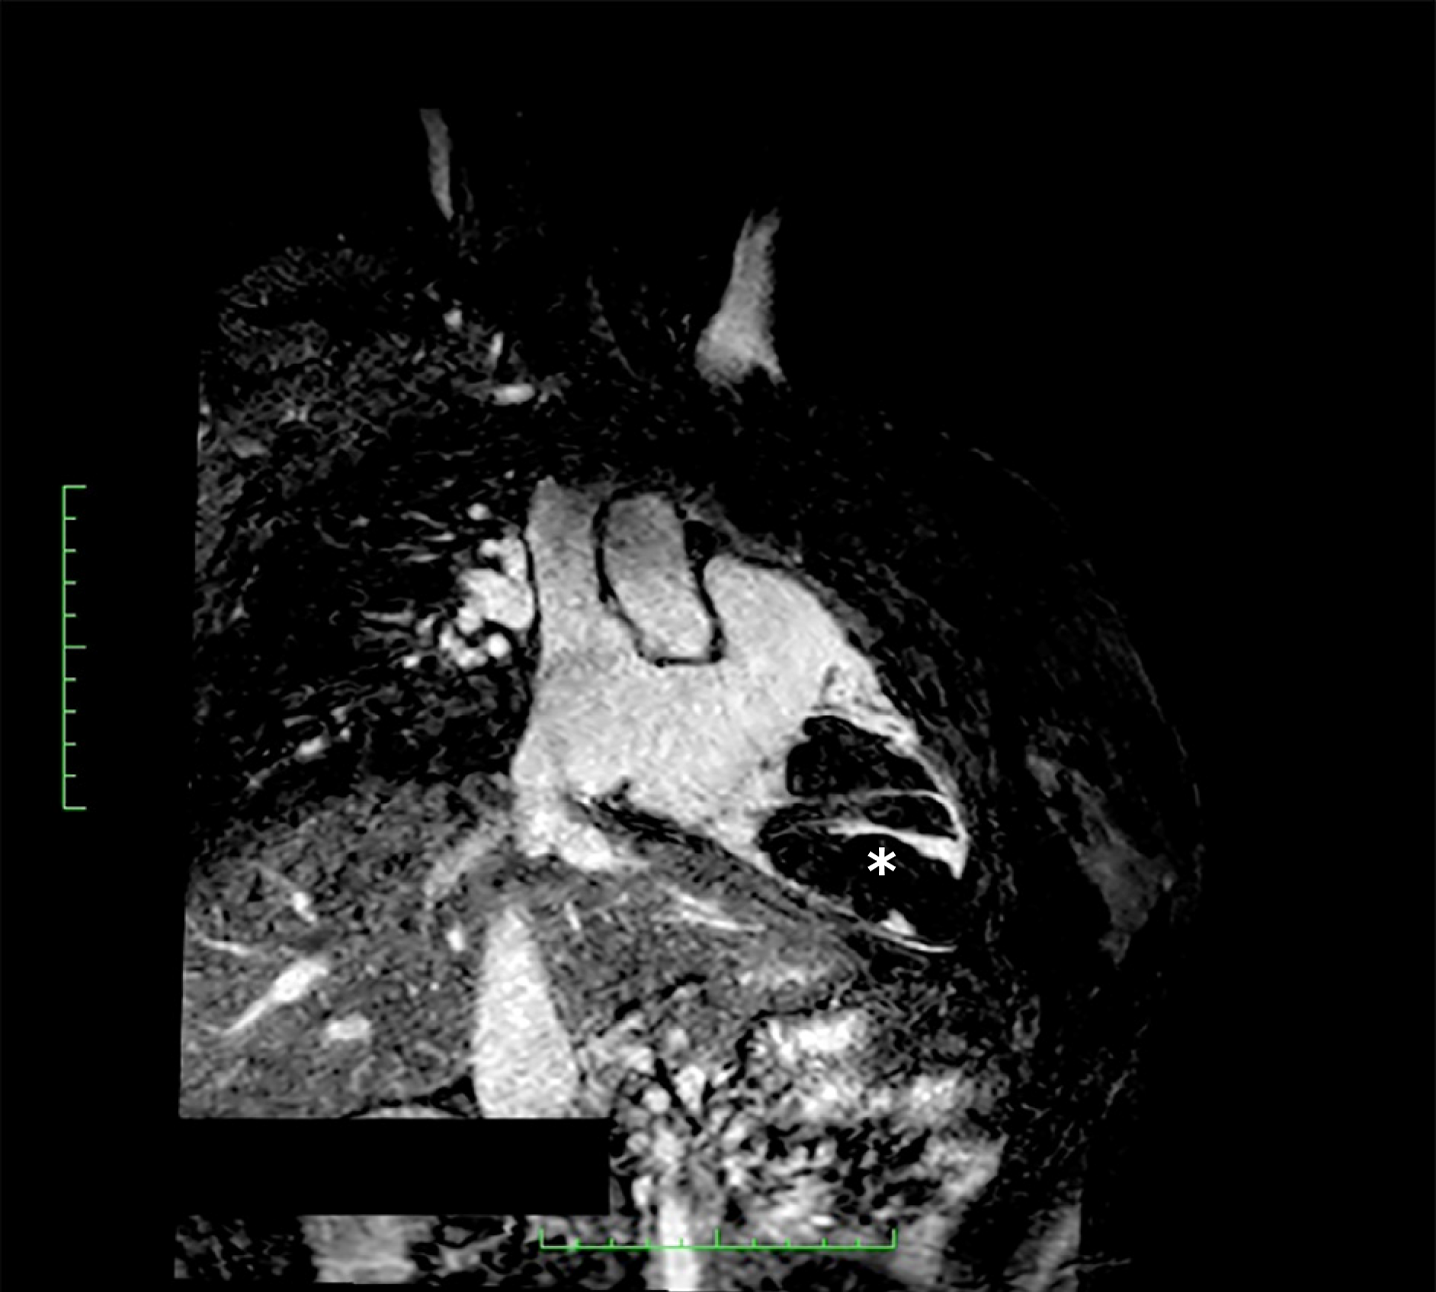
Figure 6 T1 weighted 3-dimensional imaging technique with THRIVE and uniform fat suppression.
Figure 7 Balanced turbo field-echo magnetic resonance technique shows detailed delineation of the lipoma contours (star).
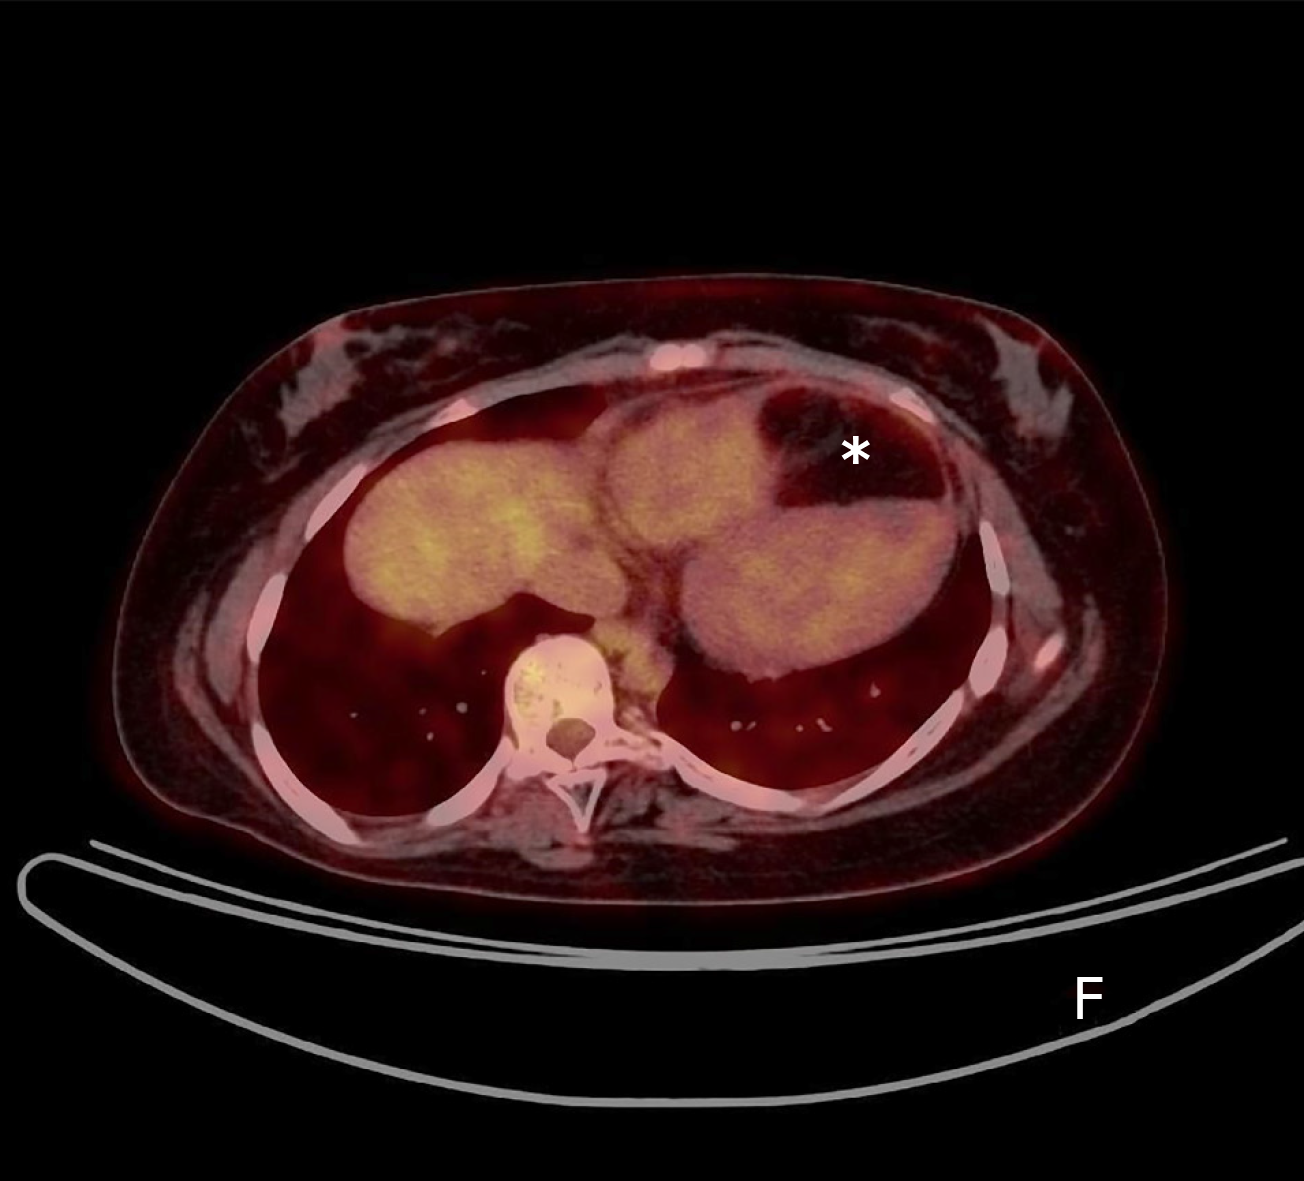
Figure 8 Positron emission tomography scan with low fluorodeoxyglucose uptake in the mass (star).
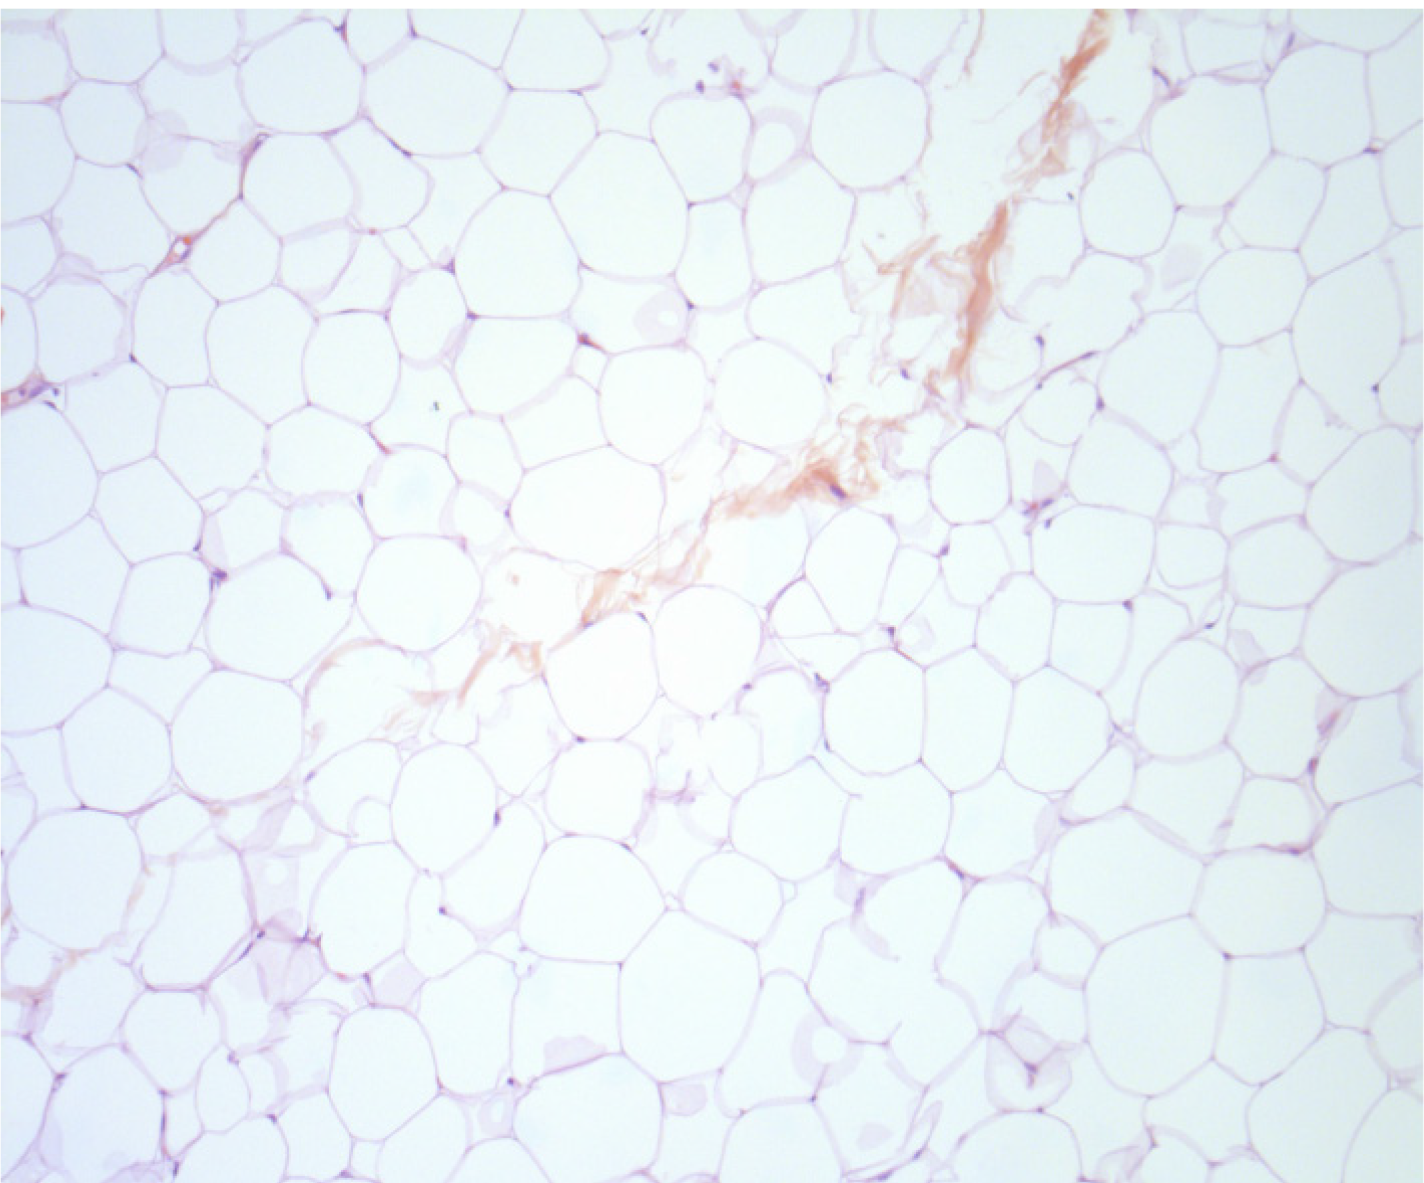
Figure 9 Histopathological examination shows adipose tissue with no suspect elements of malignancy.
- Citation: Elenizi K, Matta A, Alharthi R, Campelo-Parada F, Lhermusier T, Bouisset F, Elbaz M, Carrié D, Roncalli J. Incidental discovery of right ventricular lipoma in a young female associated with ventricular hyperexcitability: An imaging multimodality approach. World J Cardiol 2020; 12(5): 220-227
- URL: https://www.wjgnet.com/1949-8462/full/v12/i5/220.htm
- DOI: https://dx.doi.org/10.4330/wjc.v12.i5.220


