Copyright
©The Author(s) 2020.
World J Cardiol. Oct 26, 2020; 12(10): 501-512
Published online Oct 26, 2020. doi: 10.4330/wjc.v12.i10.501
Published online Oct 26, 2020. doi: 10.4330/wjc.v12.i10.501
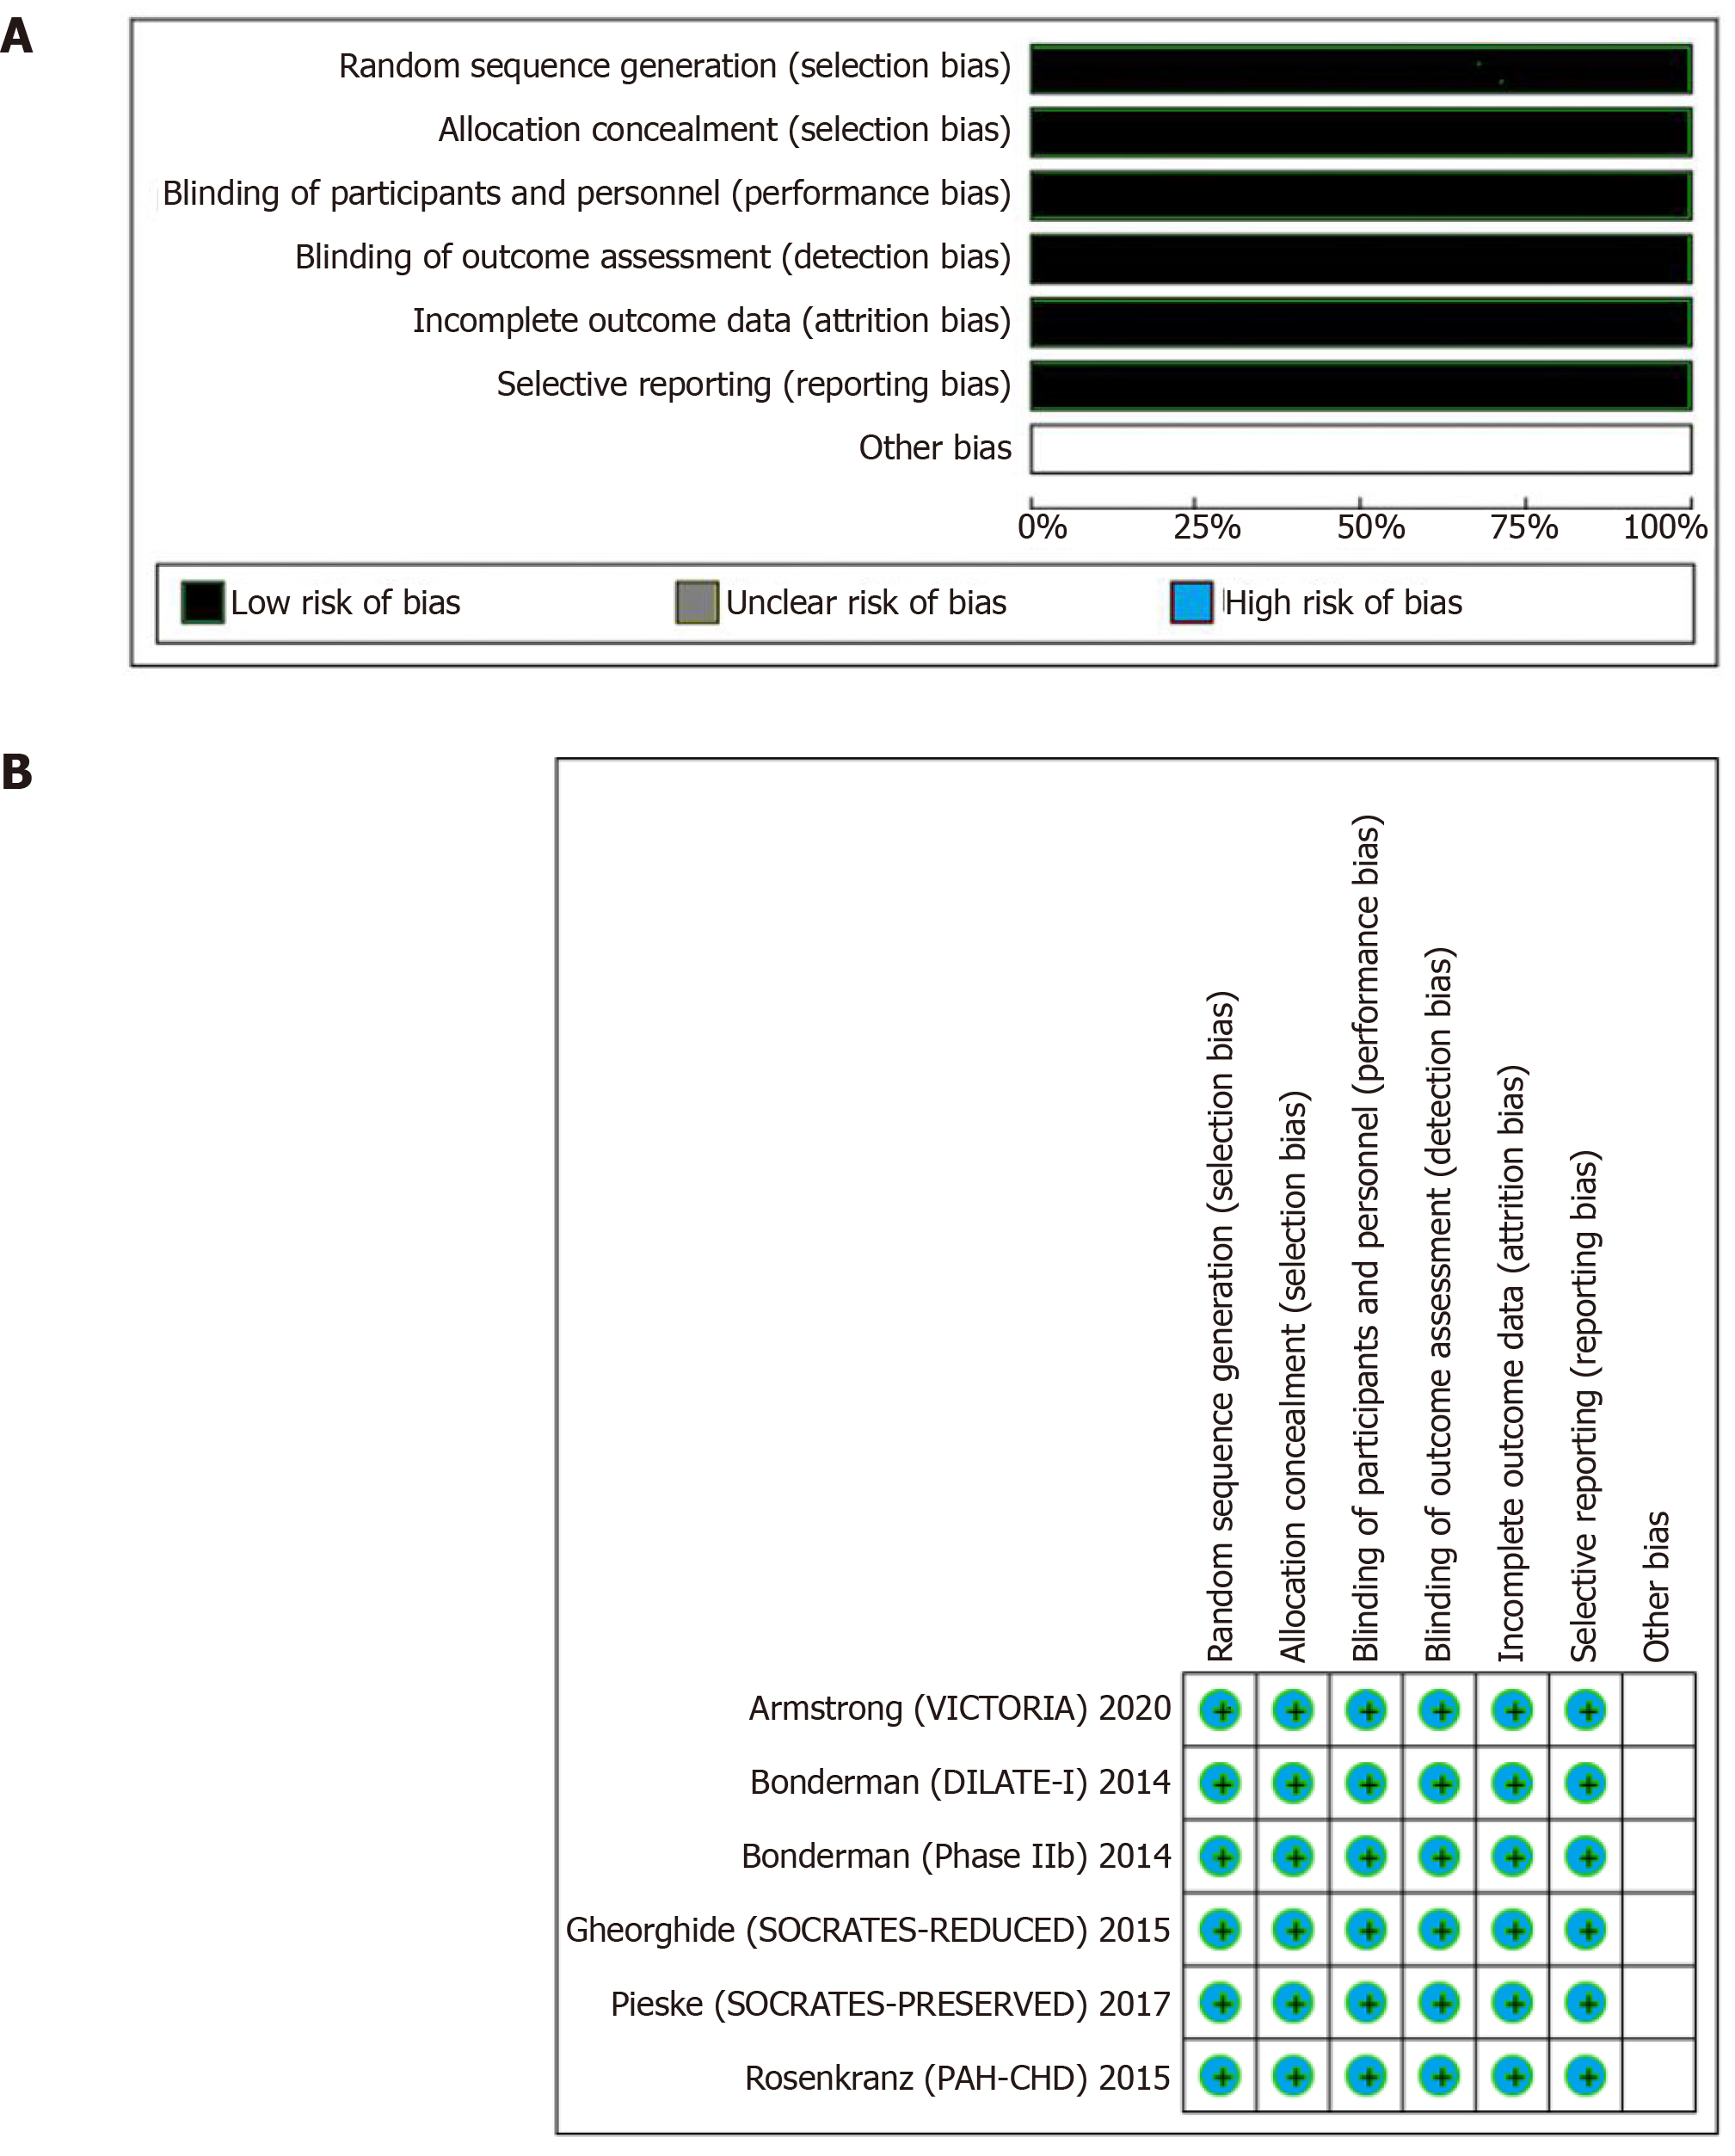
Figure 1 Summary and detailed methodological quality of the included studies.
A: Summary of the included studies; B: Detailed methodological quality of the included studies.
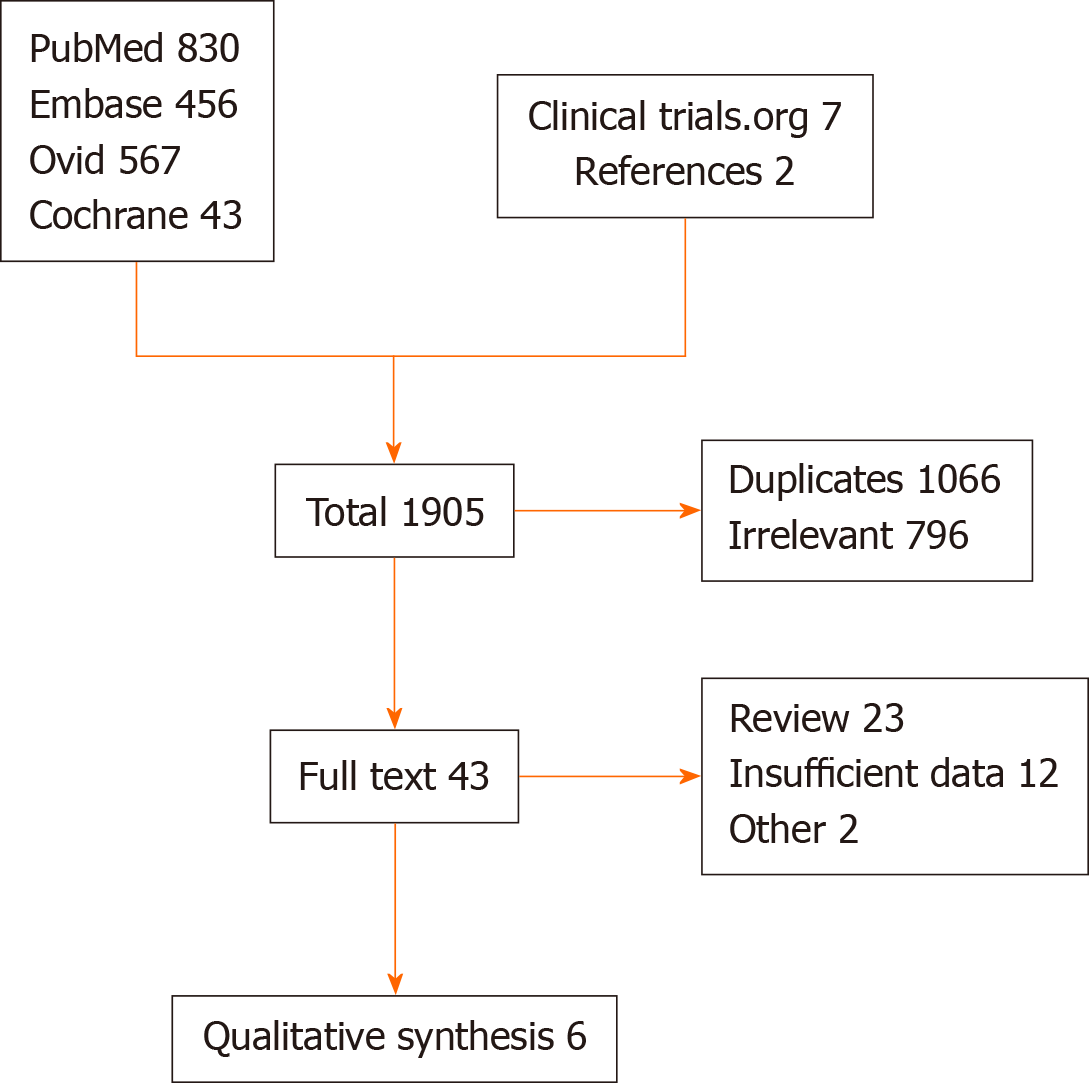
Figure 2 Flow diagram of the included studies showing reasons for exclusion.
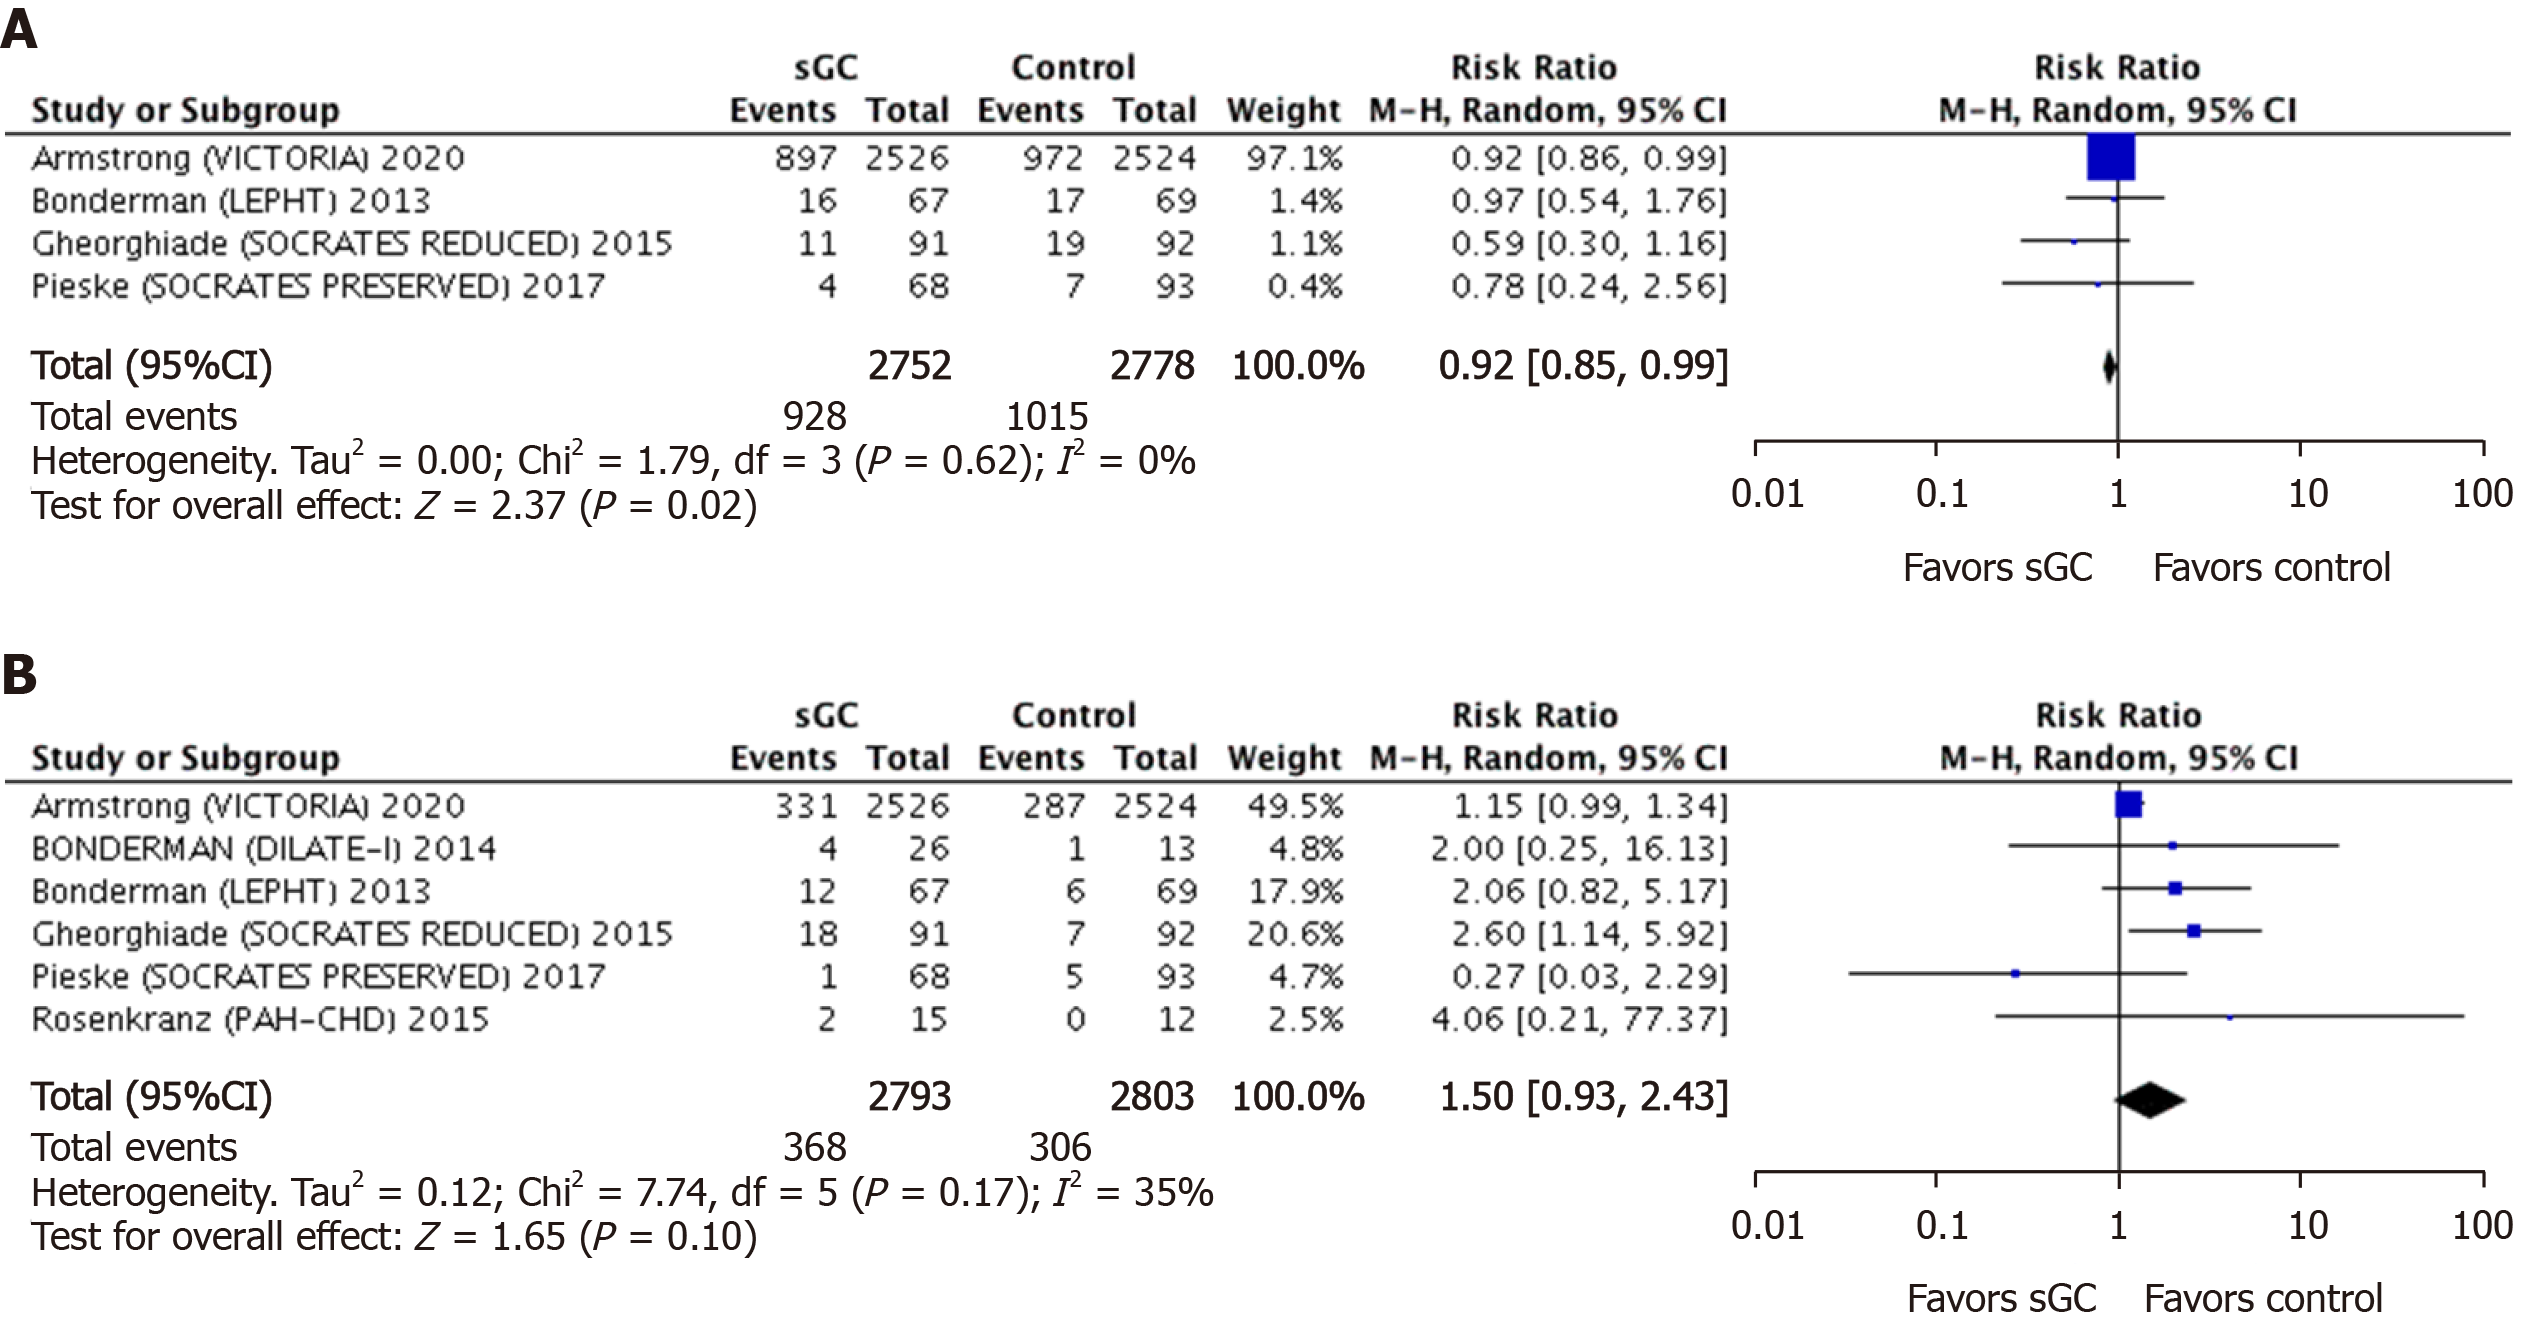
Figure 3 Forest plot for the primary composite endpoint overall side-effects showing an individual and pooled risk ratio for randomized controlled trials comparing soluble guanylate cyclase stimulators to control.
A: Pooled composite endpoint; B: Overall side-effects. The pooled risk ratio (RR) with 95% confidence interval (CI) were calculated using random-effects models. Weight refers to the contribution of each study to the overall pooled estimate of treatment effect. Each square and horizontal line denotes the point estimate and 95%CI for each trial’s RR, respectively. The diamonds signify the pooled RR; the diamond’s centre denotes the point estimate and width denotes the 95%CI. CI: Confidence interval; sGC: Soluble guanylate cyclase.
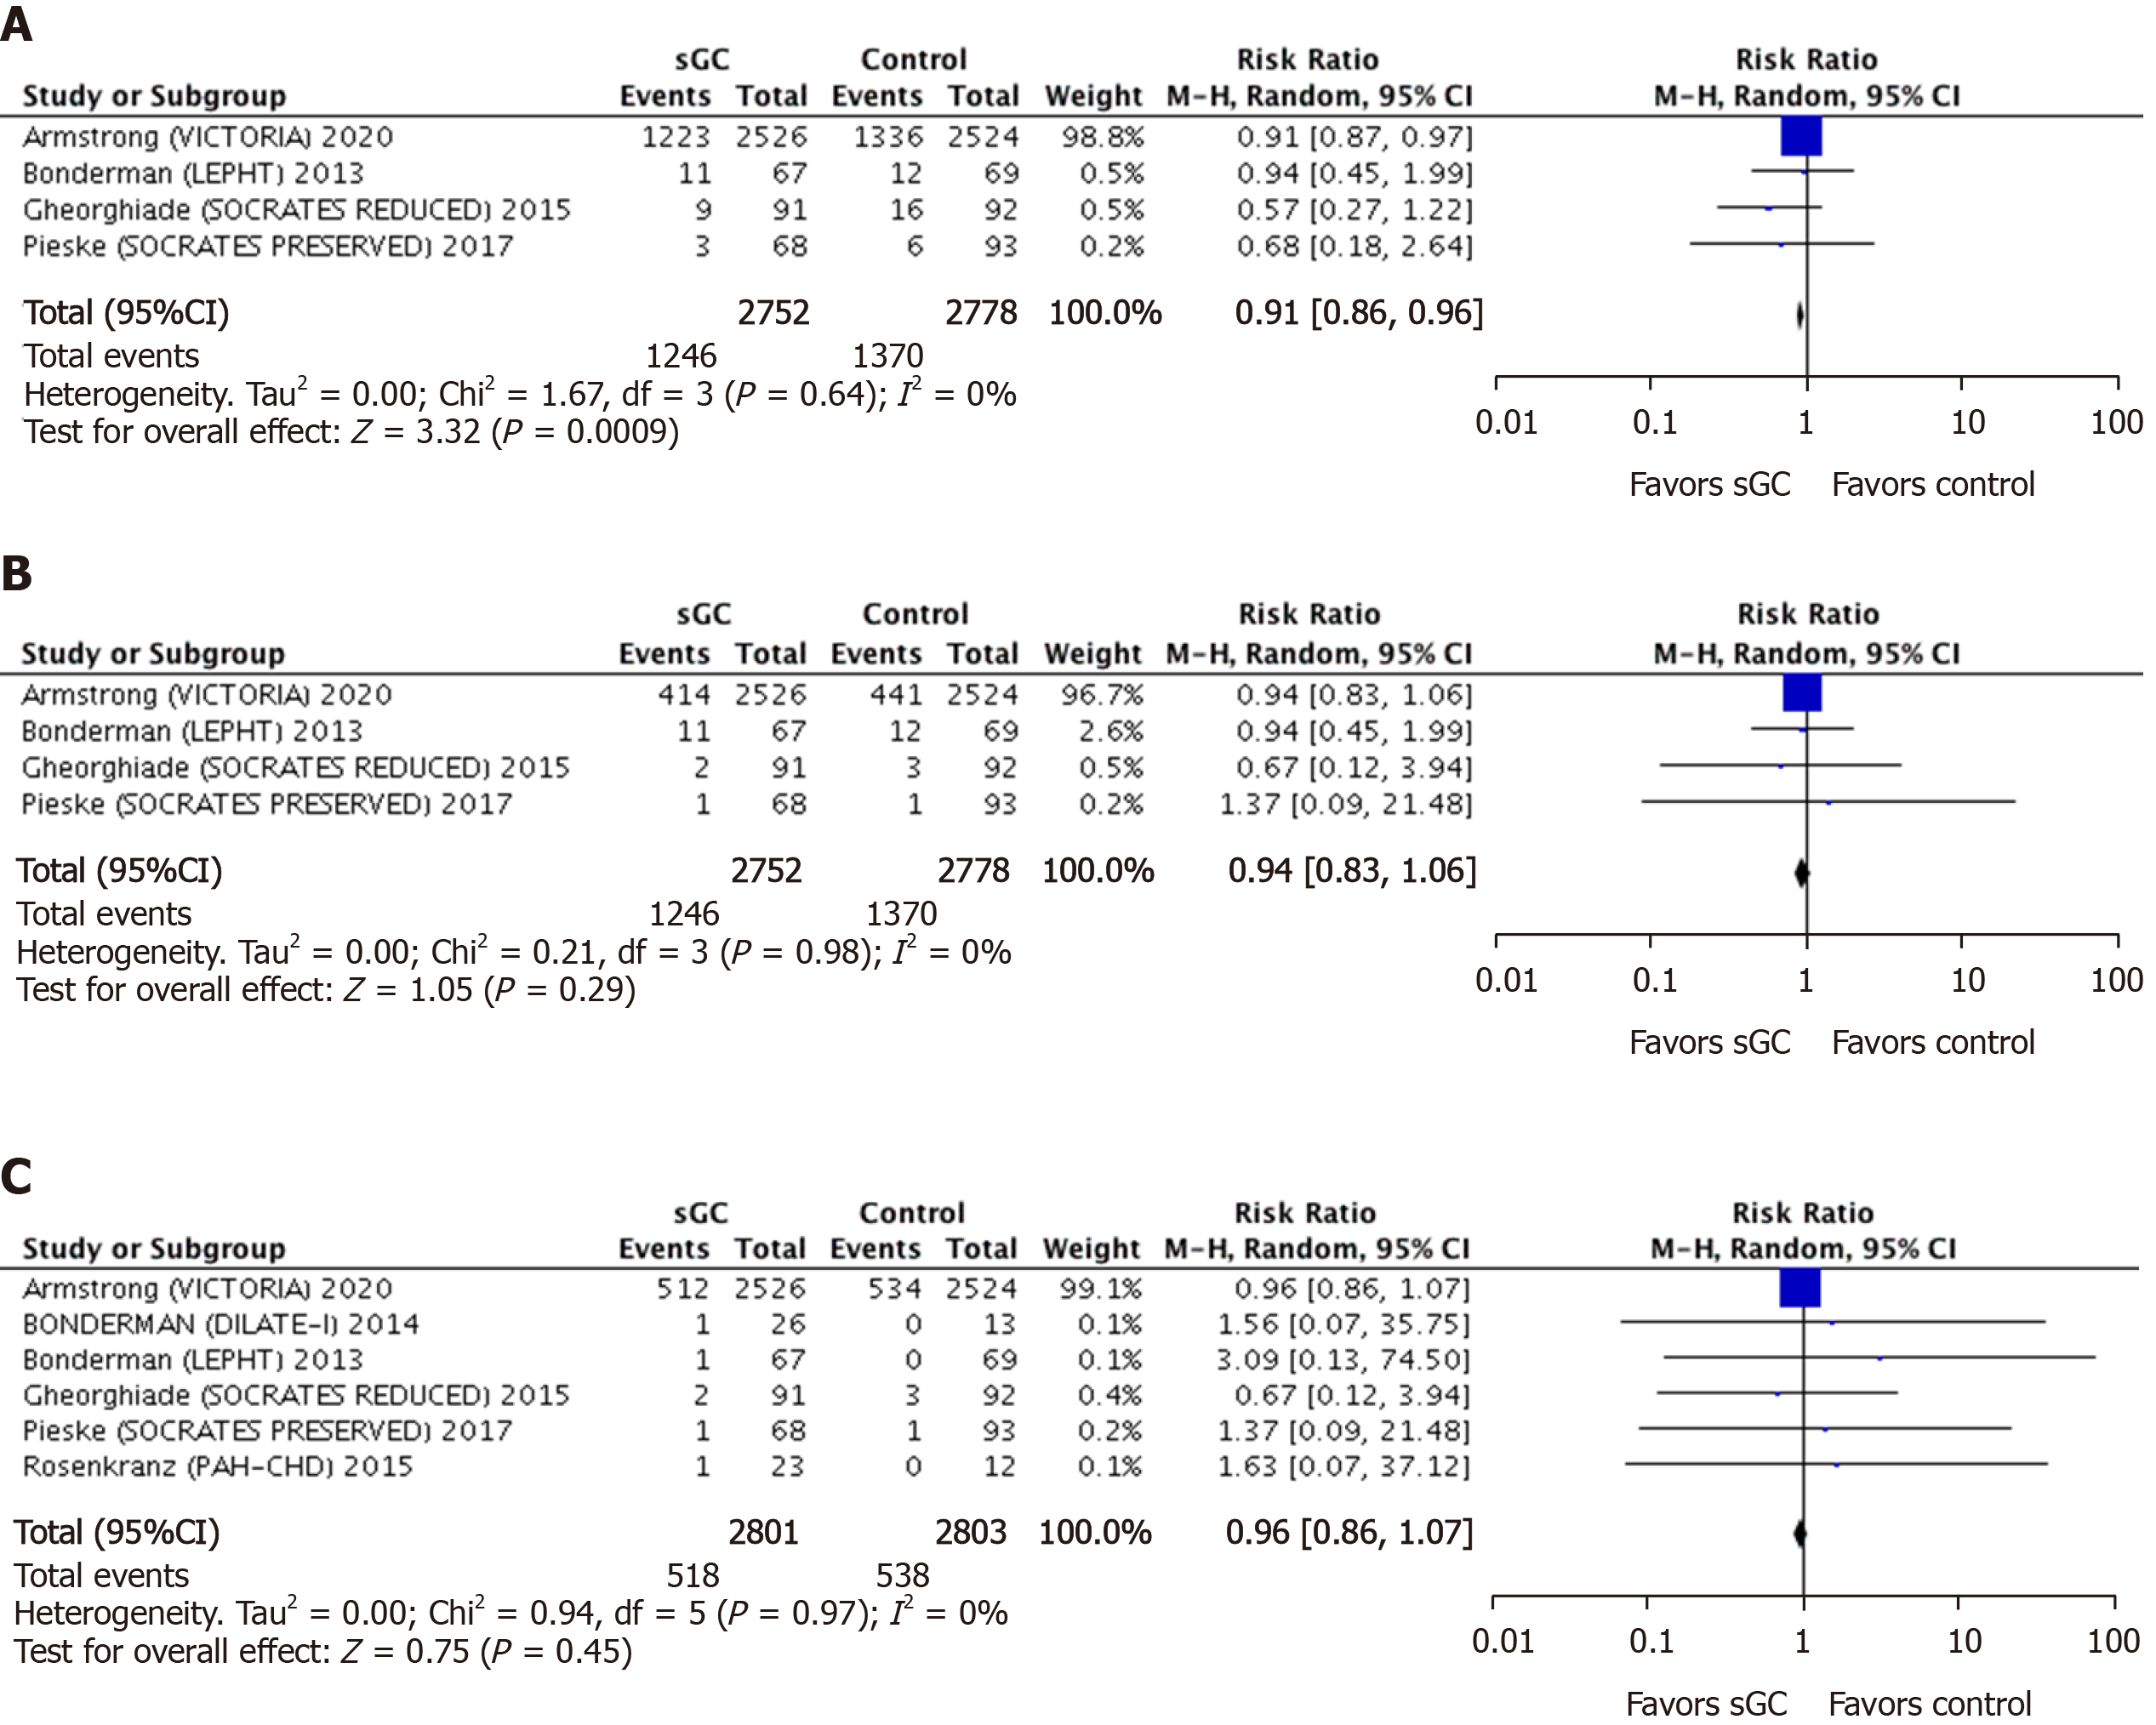
Figure 4 Forest plot for hospitalizations, cardiovascular and all-cause mortality showing an individual and pooled risk ratio for randomized controlled trials comparing soluble guanylate cyclase stimulators to control.
A: Hospitalizations; B: Cardiovascular; C: All-cause mortality. CI: Confidence interval; sGC: Soluble guanylate cyclase.
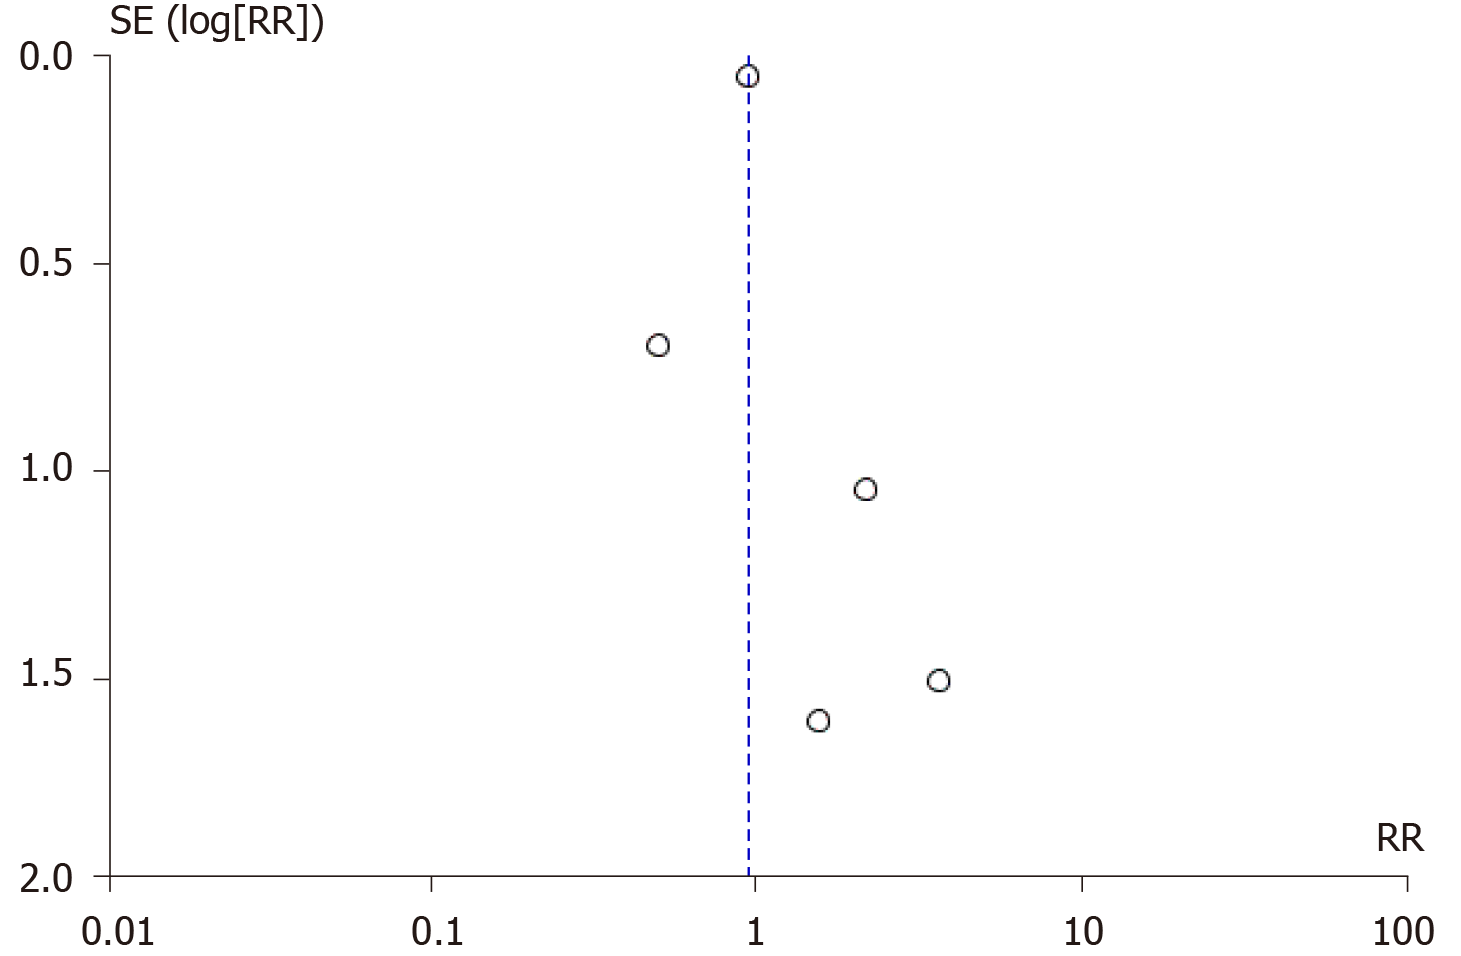
Figure 5 Funnel plot showing possible publication bias.
RR: Risk ratio.
- Citation: Ullah W, Mukhtar M, Al-Mukhtar A, Saeed R, Boigon M, Haas D, Rame E. Safety and efficacy of soluble guanylate cyclase stimulators in patients with heart failure: A systematic review and meta-analysis. World J Cardiol 2020; 12(10): 501-512
- URL: https://www.wjgnet.com/1949-8462/full/v12/i10/501.htm
- DOI: https://dx.doi.org/10.4330/wjc.v12.i10.501


