Copyright
©The Author(s) 2019.
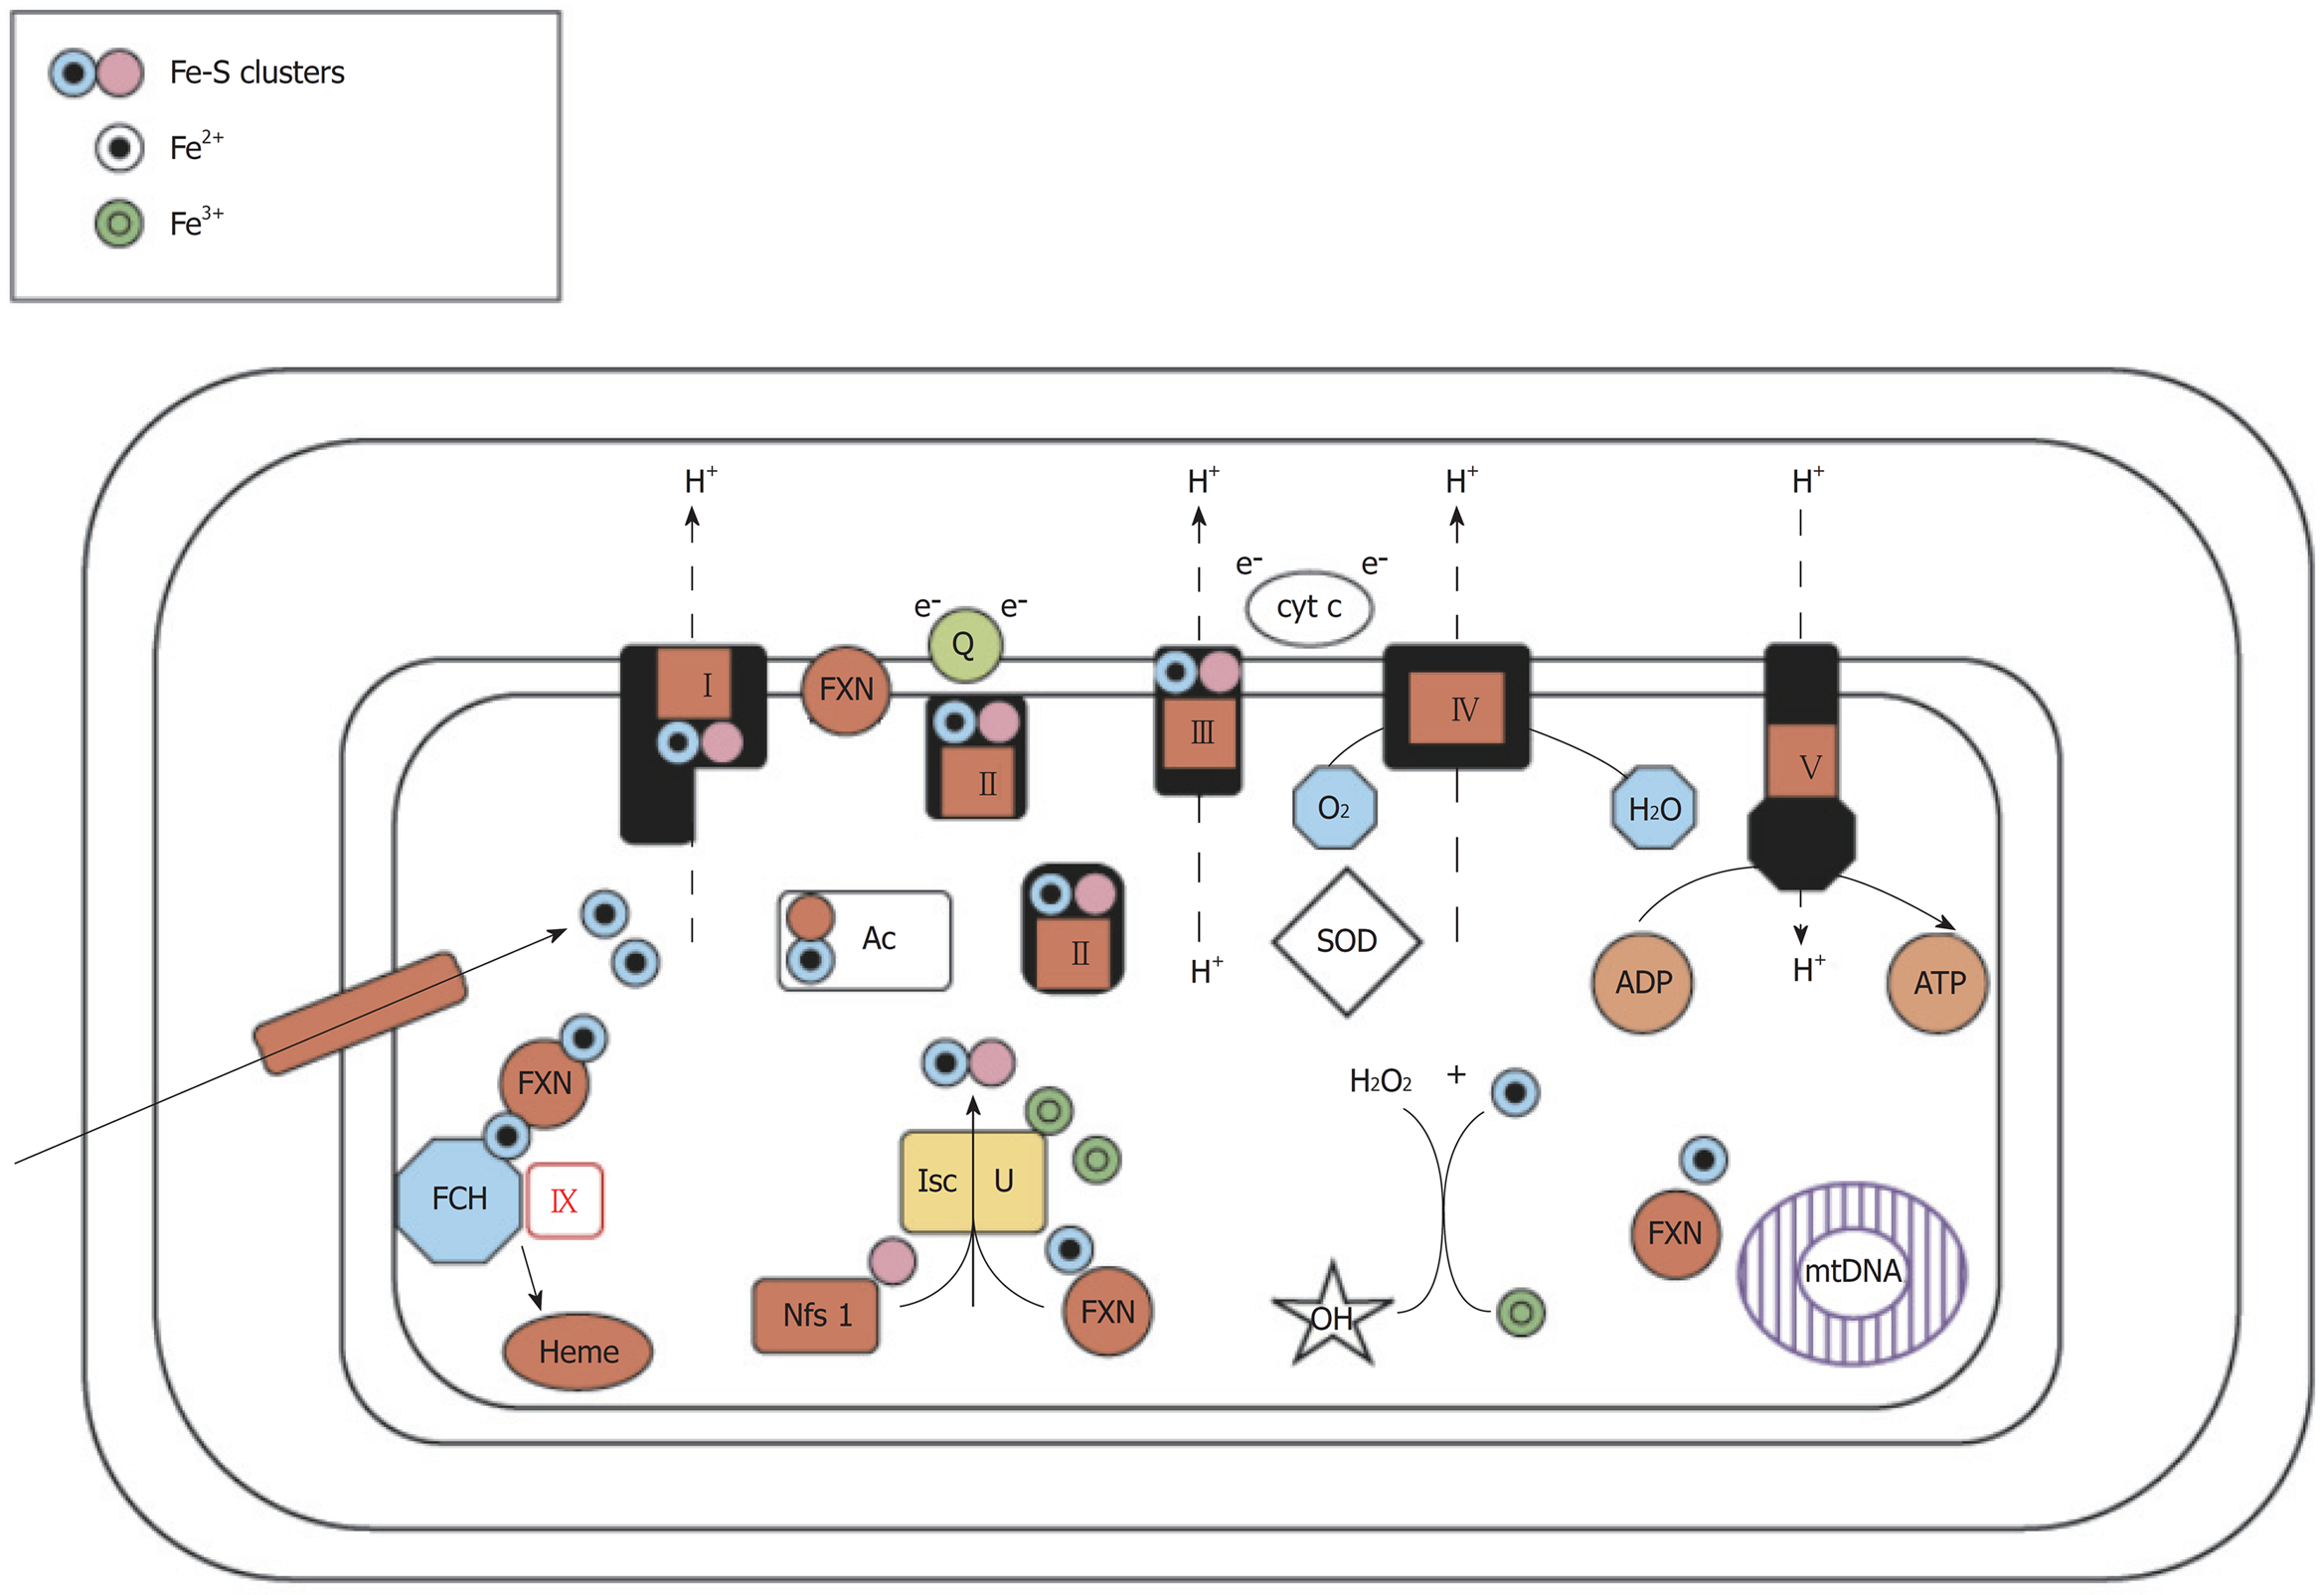
Figure 1 Postulated functions of frataxin.
(1) Frataxin is a general iron chaperone that provides Fe2+ to ferrochelatase (FCH) for heme biosynthesis, mitochondrial iron-sulfur (Fe-S) cluster biogenesis, and maintenance of the mitochondrial aconitase (Ac) Fe-S cluster; (2) Frataxin may directly interact with respiratory chain complexes (I-V); (3) Frataxin prevents oxidative stress, protects mitochondrial proteins and mitochondrial DNA (mtDNA) from free Fe2+, and prevents the Fenton reaction by converting Fe2+ to Fe3+, thereby blocking hydroxyl radical formation. ADP: Adenosine diphosphate; ATP: Adenosine triphosphate; cyt c: Cytochrome c; e−: Electron; SOD: Superoxide dismutase; FXN: Frataxin.
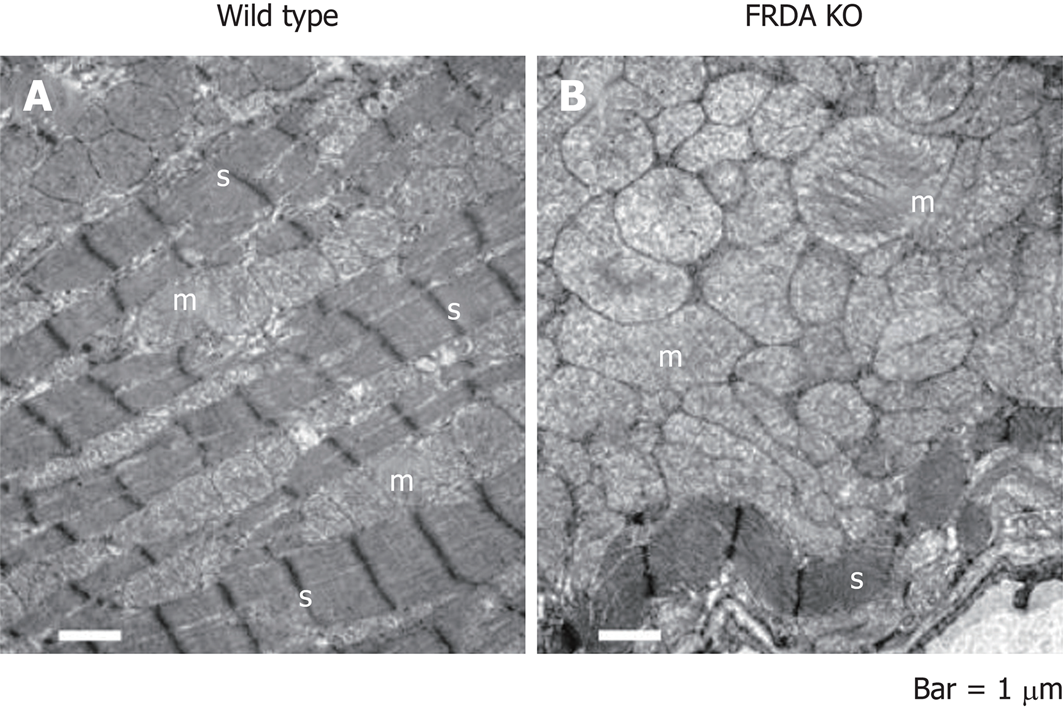
Figure 2 Electron microscopy of Friedreich’s ataxia-knockout and wild-type control mouse heart tissues from 28-d-old littermates.
A: Wild type mouse showing normal mitochondria (“m”) in rows between abundant, well-ordered sarcomeres (“s”); B: Conditional Friedreich’s ataxia-knockout (FRDA KO) mouse with ablation of the FRDA locus in the heart and brain (NSE-Cre promoter). Note the extreme proliferation of enlarged mitochondria in B. There is a severe loss of sarcomeres (“s”). Bars = 1000 nm.
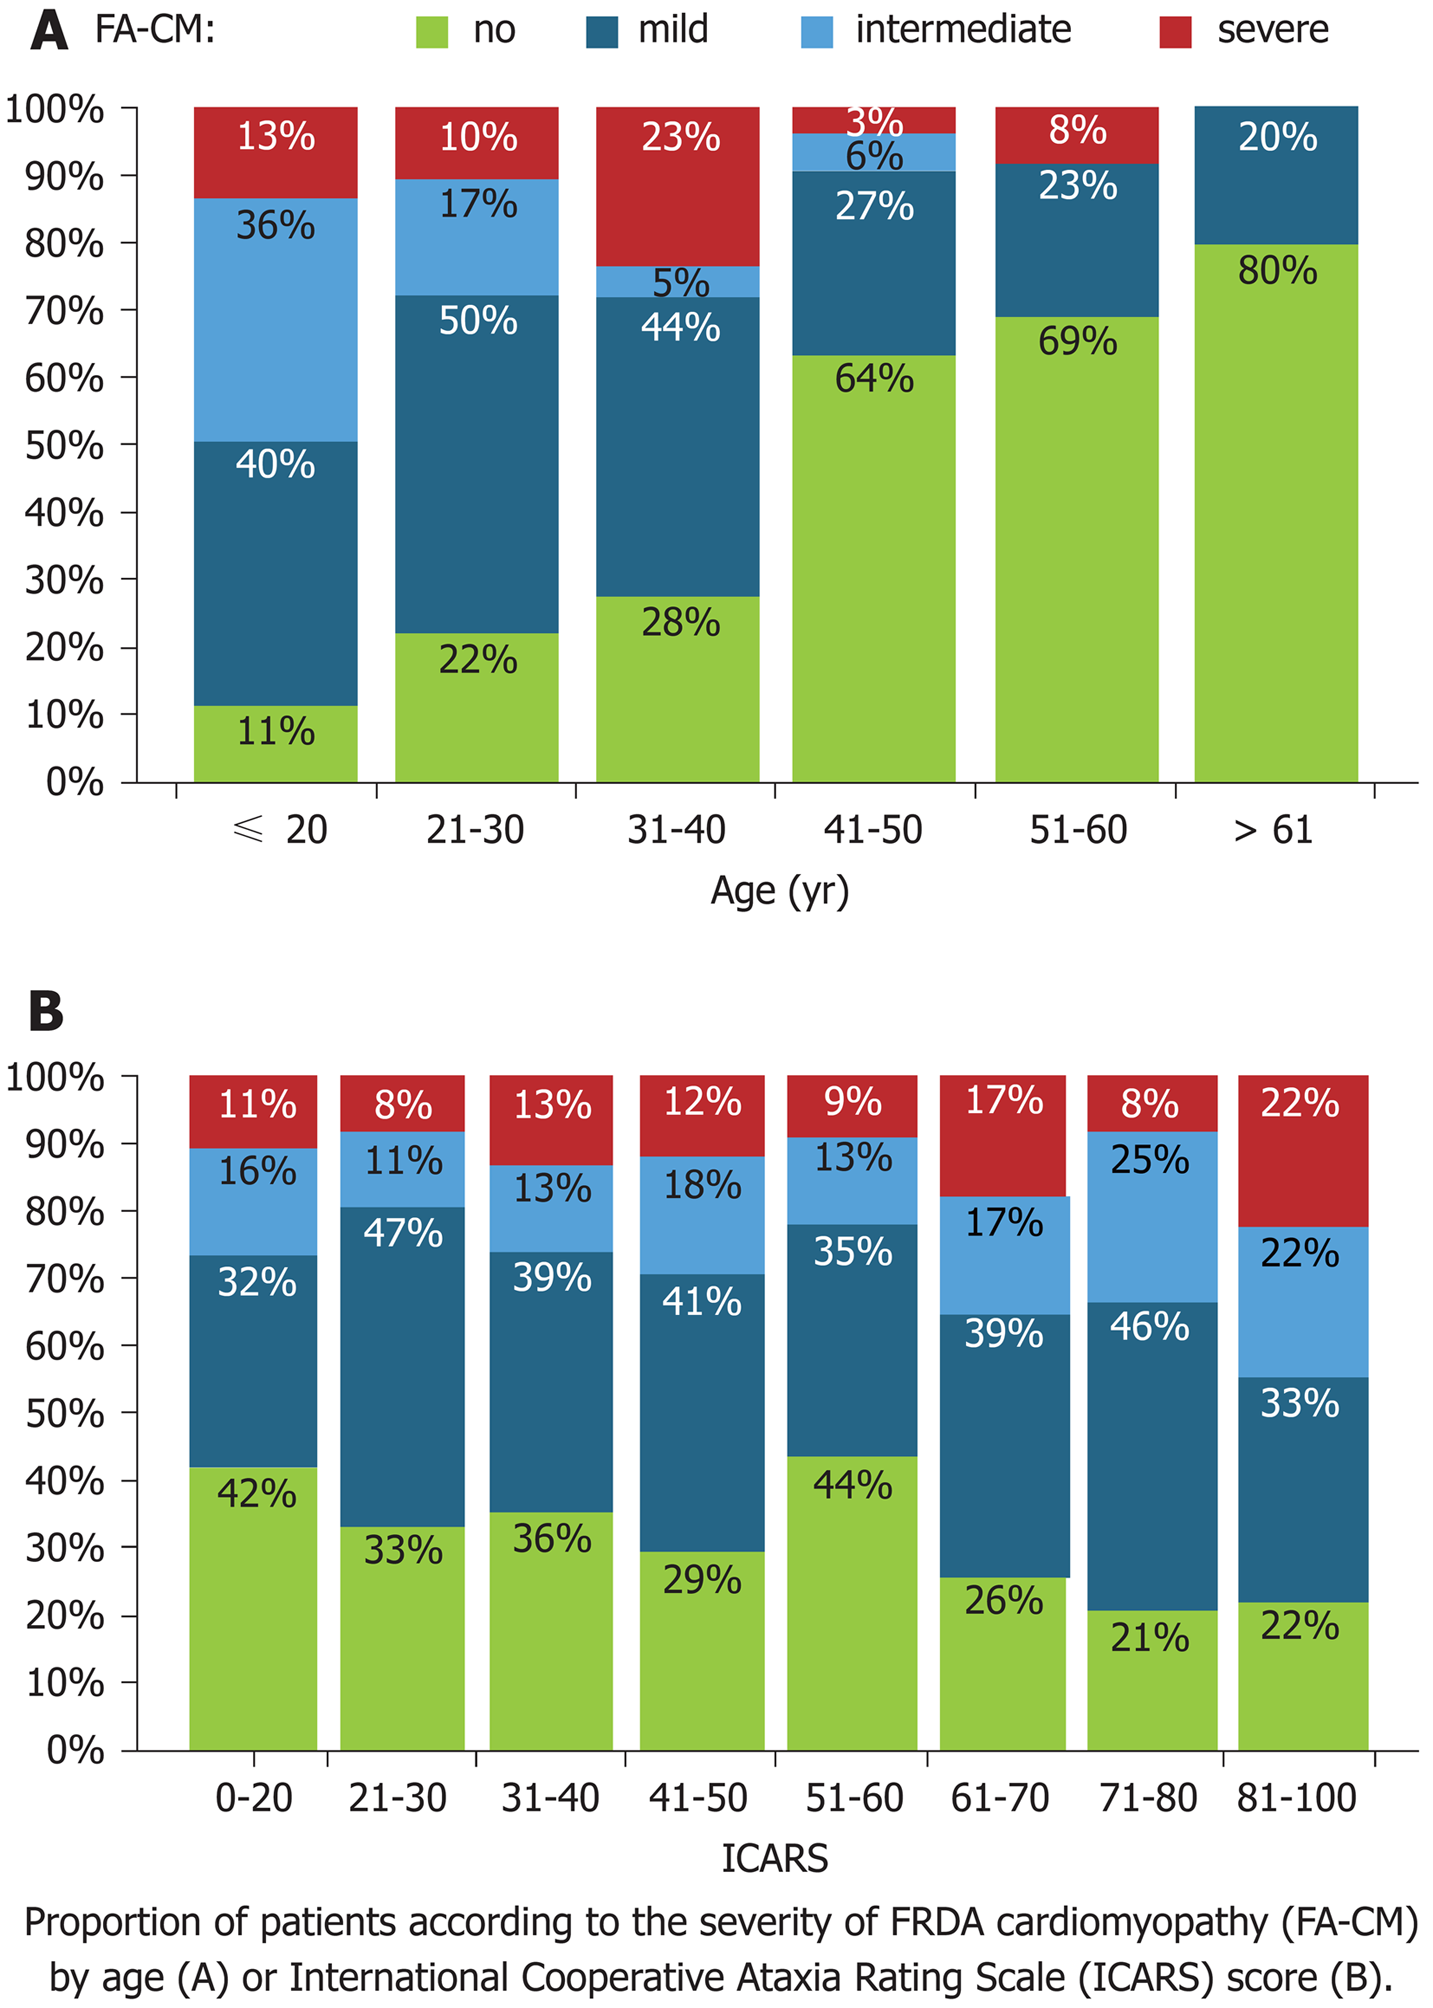
Figure 3 The more severe Friedreich’s ataxia cardiomyopathy groups were found at younger ages (A), in contrast, the severity of the Friedreich’s ataxia cardiomyopathy was independent of neurological involvement measured by the International Cooperative Ataxia Rating Scale score (B).
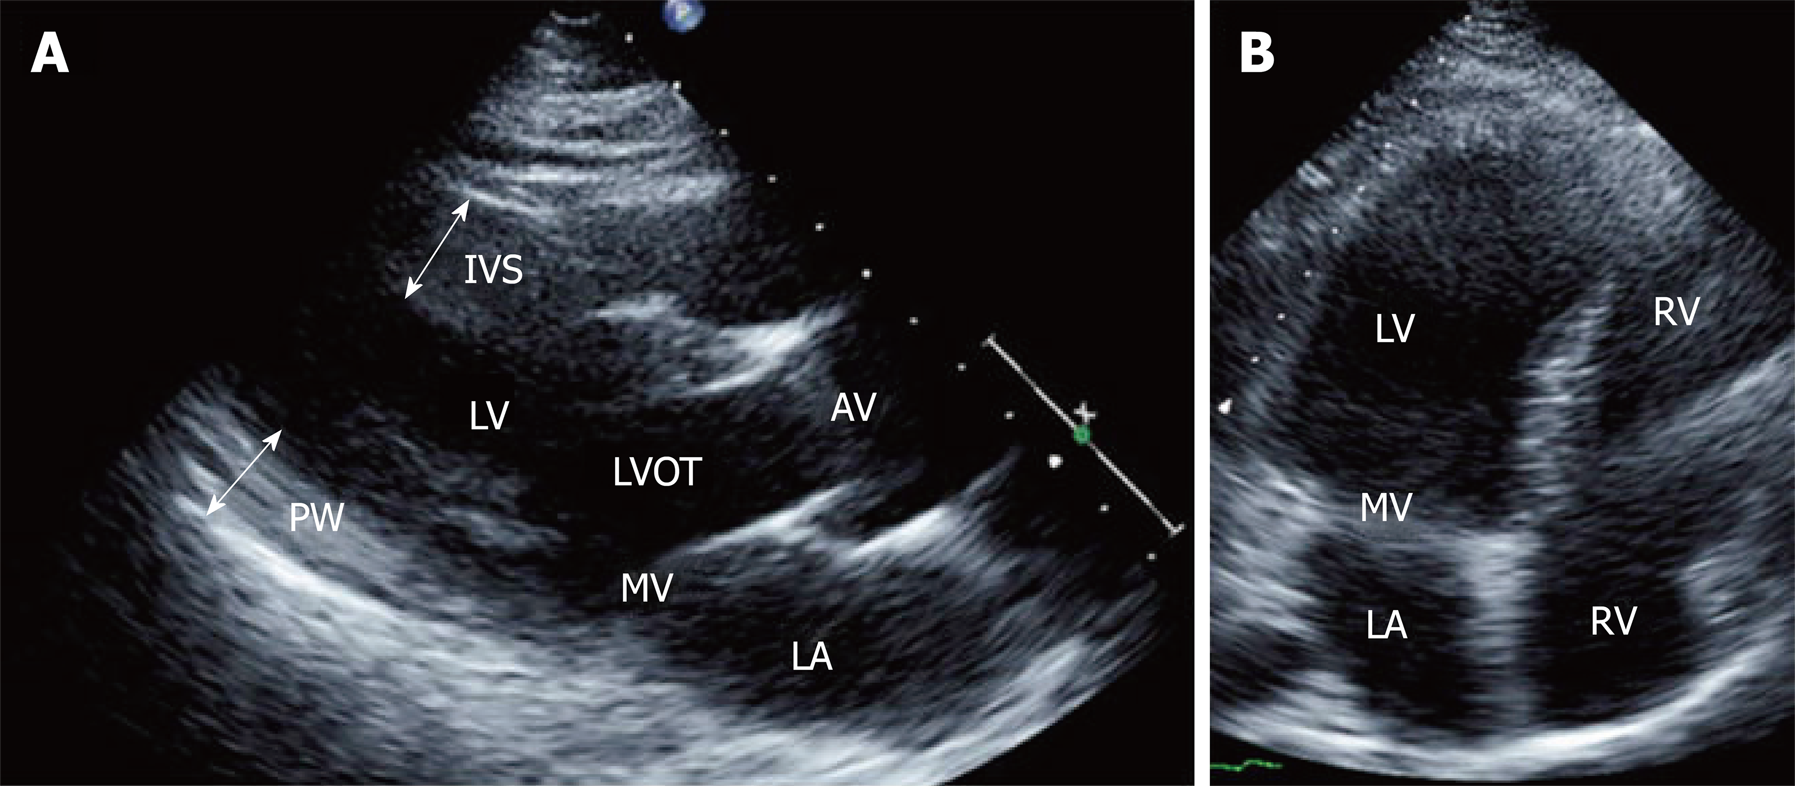
Figure 4 Two-dimensional echocardiographic still frames from a patient with Friedreich’s ataxia.
A: Parasternal long-axis view showing thickening of the interventricular septum and posterior wall; B: Apical four-chamber view showing dilatation of left ventricular cavity. IVS: Interventricular septum; PW: Posterior wall; LV: Left ventricle; LA: Left atrium; MV: Mitral valve; AV: Aortic valve; LVOT: Left ventricular outflow tract.
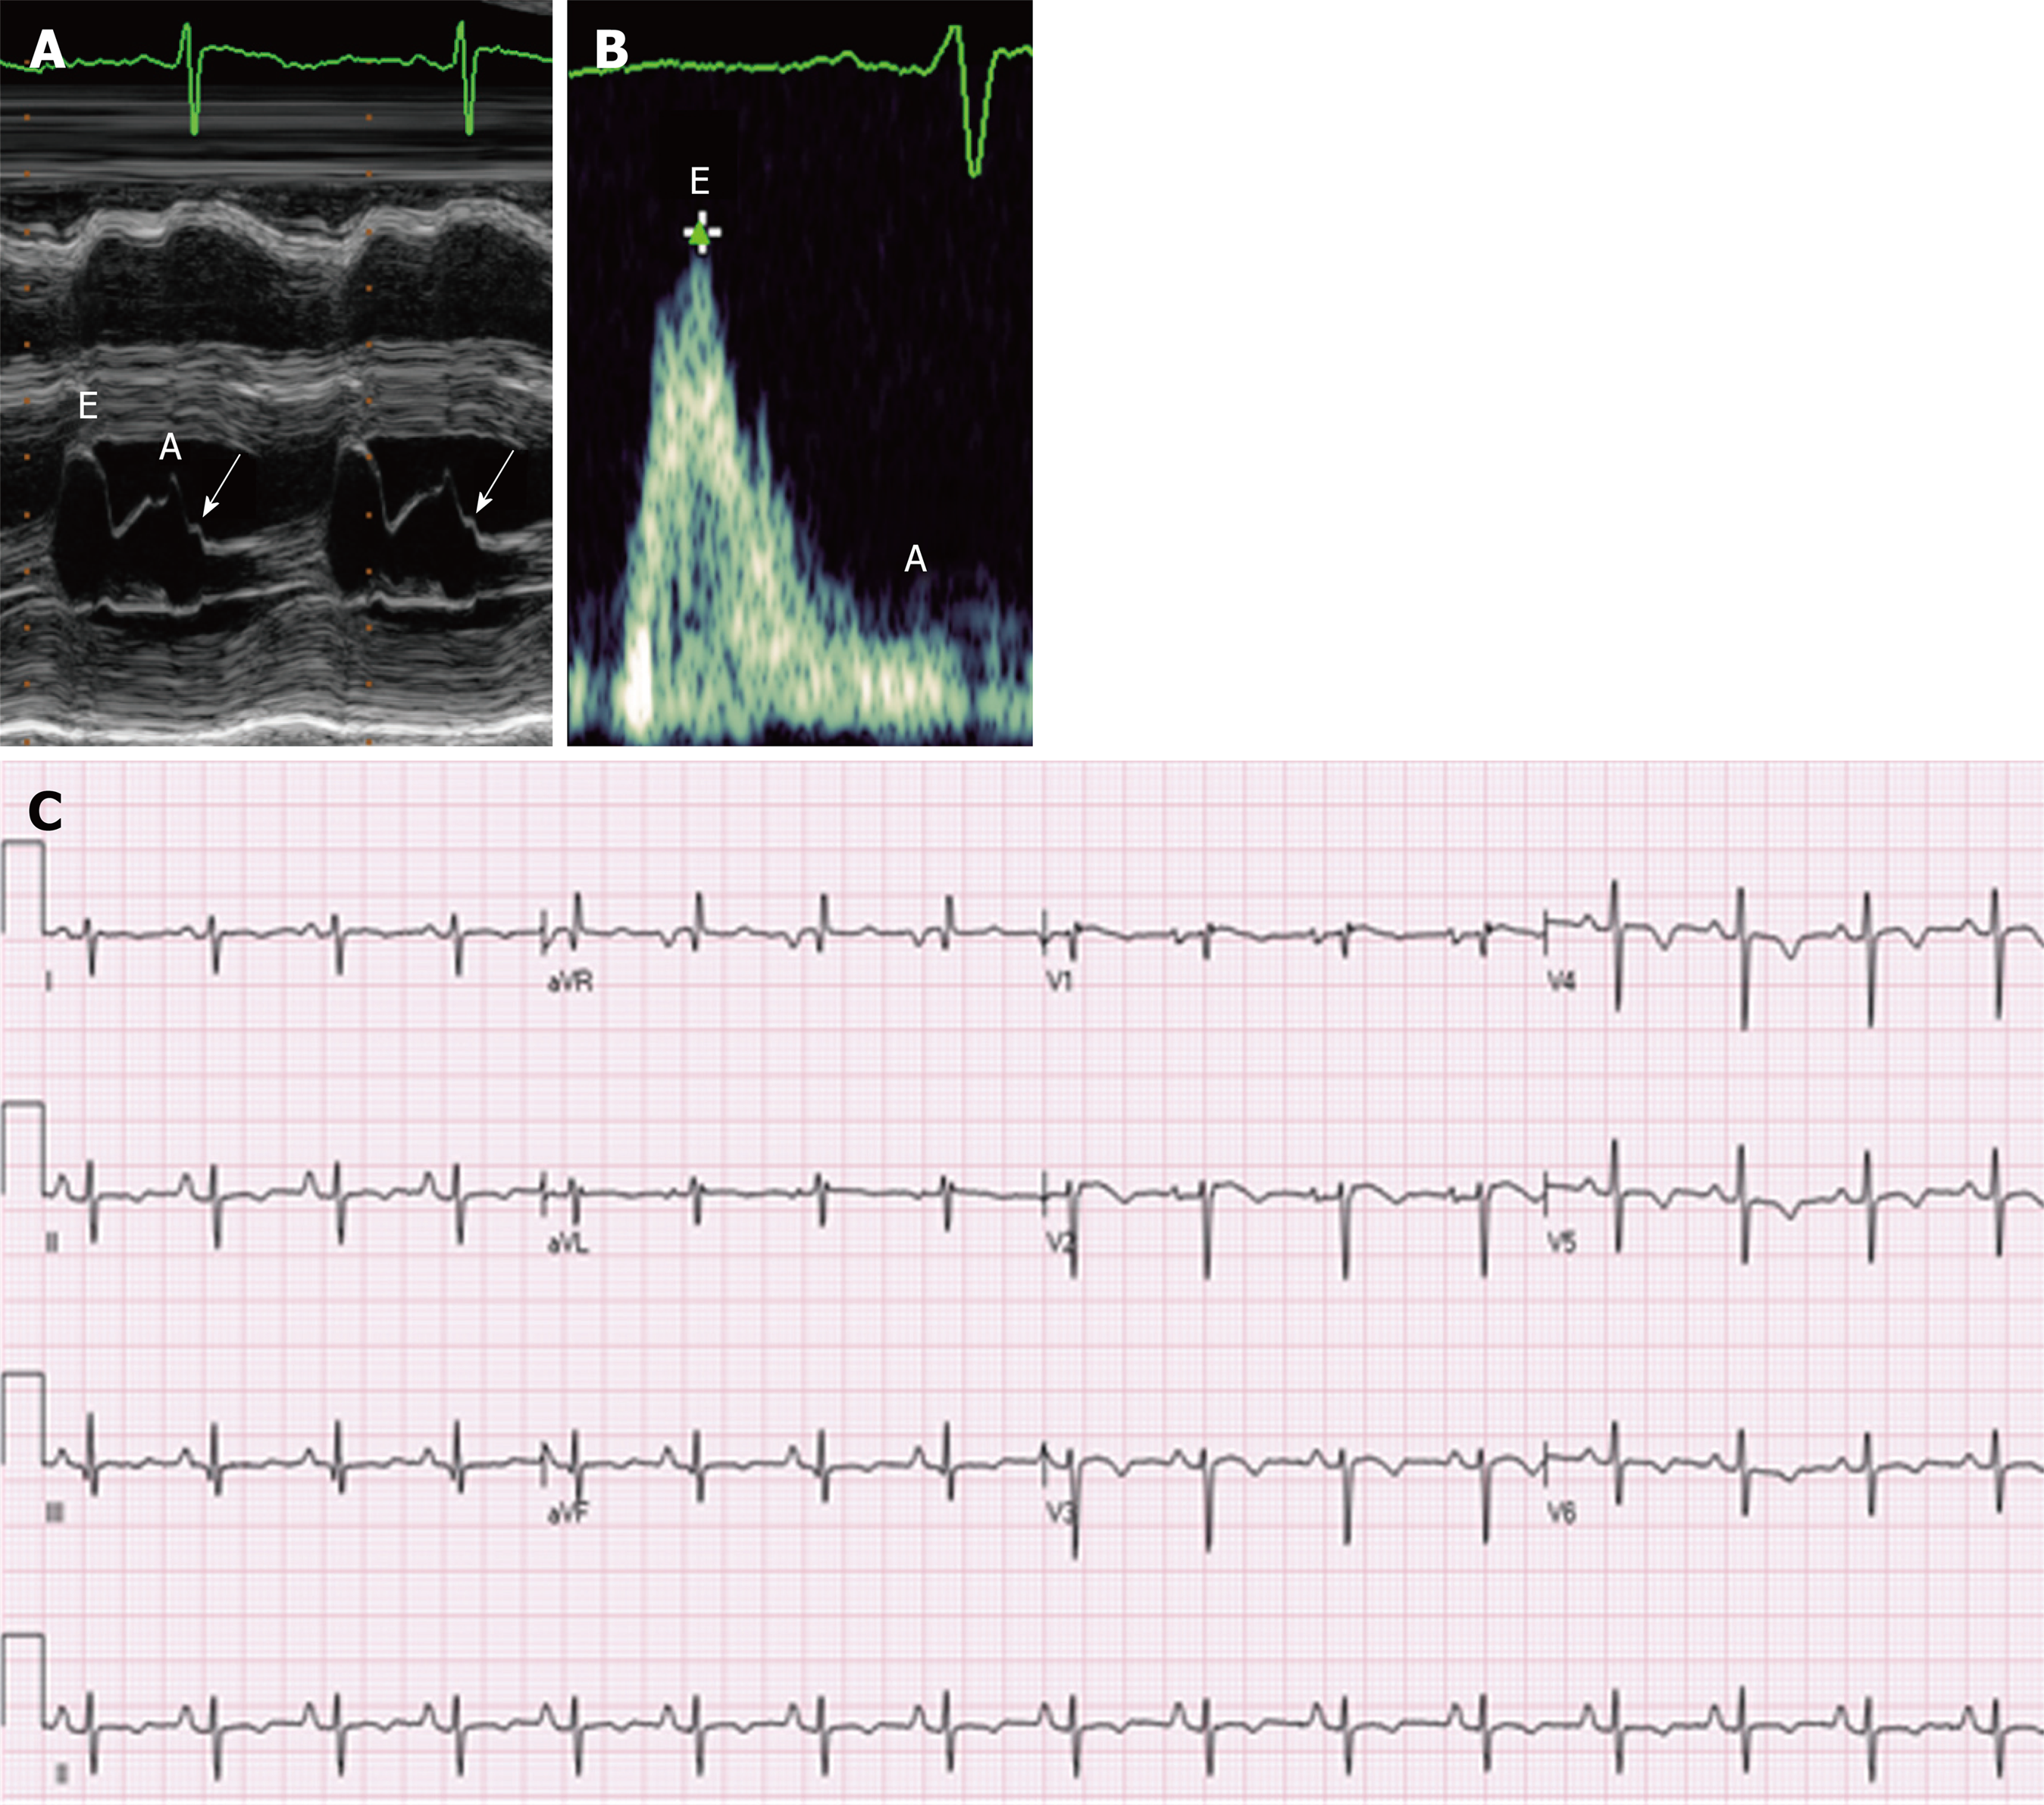
Figure 5 M-Mode image of the mitral valve, Transmitral Doppler flow showing diastolic flow and Twelve-lead electrocardiogram.
A: M-Mode image of the mitral valve in the parasternal long-axis view. Mitral valve excursion in early diastole can be seen, as can excursion due to atrial contraction in late diastole. A: “B-bump” (arrow) may be seen on the downslope of the A wave; this suggests that the end-diastolic atrial pressure is greater than the end-diastolic ventricular pressure, which is a marker of diastolic dysfunction; B: Transmitral Doppler flow showing diastolic flow. Note the large E wave in early diastole and the diminutive A wave in late diastole. The ratio of peak E wave velocity to peak A wave velocity is > 1.5, which is consistent with a “restrictive” pattern, particularly when paired with other indicators of diastolic dysfunction; C: Twelve-lead electrocardiogram demonstrating normal sinus rhythm, significant right axis deviation, poor R wave progression, and nonspecific T wave inversions in the lateral leads.
- Citation: Hanson E, Sheldon M, Pacheco B, Alkubeysi M, Raizada V. Heart disease in Friedreich’s ataxia. World J Cardiol 2019; 11(1): 1-12
- URL: https://www.wjgnet.com/1949-8462/full/v11/i1/1.htm
- DOI: https://dx.doi.org/10.4330/wjc.v11.i1.1


