Copyright
©The Author(s) 2018.
World J Cardiol. Sep 26, 2018; 10(9): 110-118
Published online Sep 26, 2018. doi: 10.4330/wjc.v10.i9.110
Published online Sep 26, 2018. doi: 10.4330/wjc.v10.i9.110
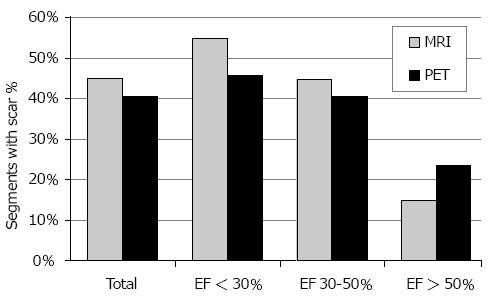
Figure 1 Histogram showing the frequency of scar detection in cardiac magnetic resonance imaging (grey bars) and positron emission tomography (black bars).
In total, cardiac magnetic resonance imaging (CMR) found scars in 45% of all segments compared to PET in 40%. CMR depicted significantly more scars in patients with severely (EF < 30%) and moderately (EF, 30%-50%) impaired left ventricular function. However, PET suggested more scars in EF > 50% group. PET: Positron emission tomography; EF: Ejection fraction.
Figure 2 A sixty-seven-year-old man with severe coronary artery disease and history of myocardial infarction.
A: Short axis inversion-recovery gradient-recalled echo cardiac magnetic resonance imaging (CMR) image of the mid- to apical-portion of the left ventricular shows a small area of transmural late gadolinium enhancement (LGE) in the inferolateral wall (broad arrow). CMR viability scores: Anterior: 2; anterolateral: 2; inferolateral: 4, inferior: 2; B: The positron emission tomography (PET) image of the corresponding slice reveals an uptake defect (broad arrow) in the same segment suggesting a transmural scar. PET viability scores: anterior: 2; inferolateral: 4. Small subendocardial scars with LGE in CMR (A) in the anterolateral and inferior wall (small arrows) were overseen in PET.
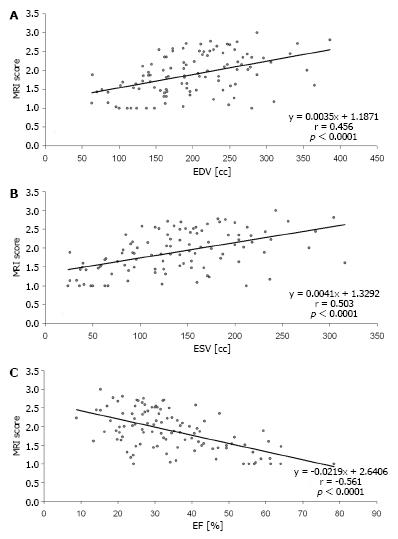
Figure 3 Correlation of left ventricular volumes and function to the MRI-derived extent of myocardial scar (summarized as mean magnetic resonance imaging score per patient).
A: End-diastolic volumes (EDV); B: End-systolic volumes (ESV); C: Ejection fraction (EF).
- Citation: Hunold P, Jakob H, Erbel R, Barkhausen J, Heilmaier C. Accuracy of myocardial viability imaging by cardiac MRI and PET depending on left ventricular function. World J Cardiol 2018; 10(9): 110-118
- URL: https://www.wjgnet.com/1949-8462/full/v10/i9/110.htm
- DOI: https://dx.doi.org/10.4330/wjc.v10.i9.110


