Copyright
©The Author(s) 2018.
World J Cardiol. Nov 26, 2018; 10(11): 210-221
Published online Nov 26, 2018. doi: 10.4330/wjc.v10.i11.210
Published online Nov 26, 2018. doi: 10.4330/wjc.v10.i11.210
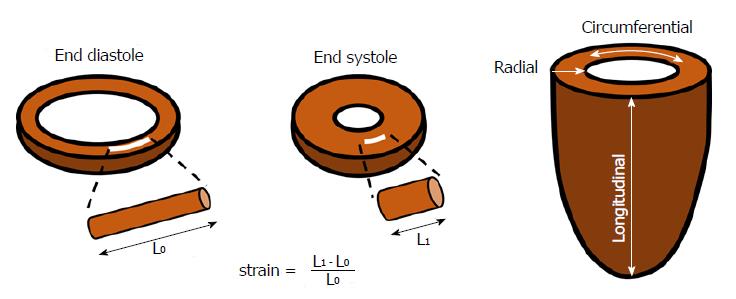
Figure 1 Schematic representation illustrating the physics principle beyond strain as well as the 3 main axes along which myocardial strain is calculated.
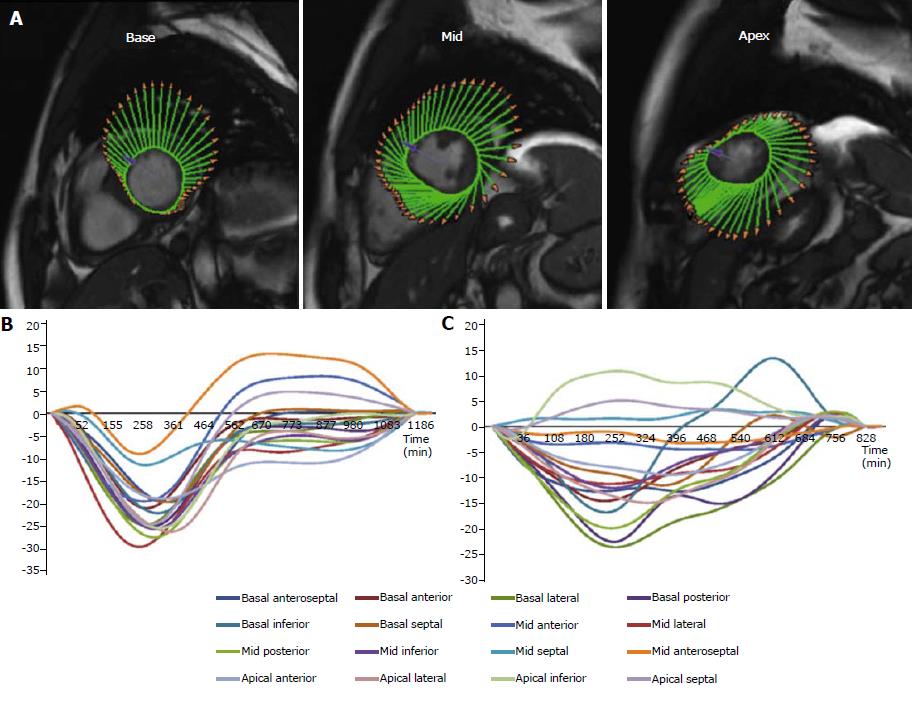
Figure 2 Example of left ventricular endocardial feature tracking.
A: Example of tracking of the endocardial border of the left ventricle (LV) on basal, mid, and apical short-axis, steady-state free-precession images using an dedicated feature-tracking software. The software automatically calculates the circumferential strain of each myocardial segment; B: Example of a patient with homogenous LV contraction; C: Example of a patient with extreme regional heterogeneity of myocardial contraction. Reprinted with permission from Muser et al[30].
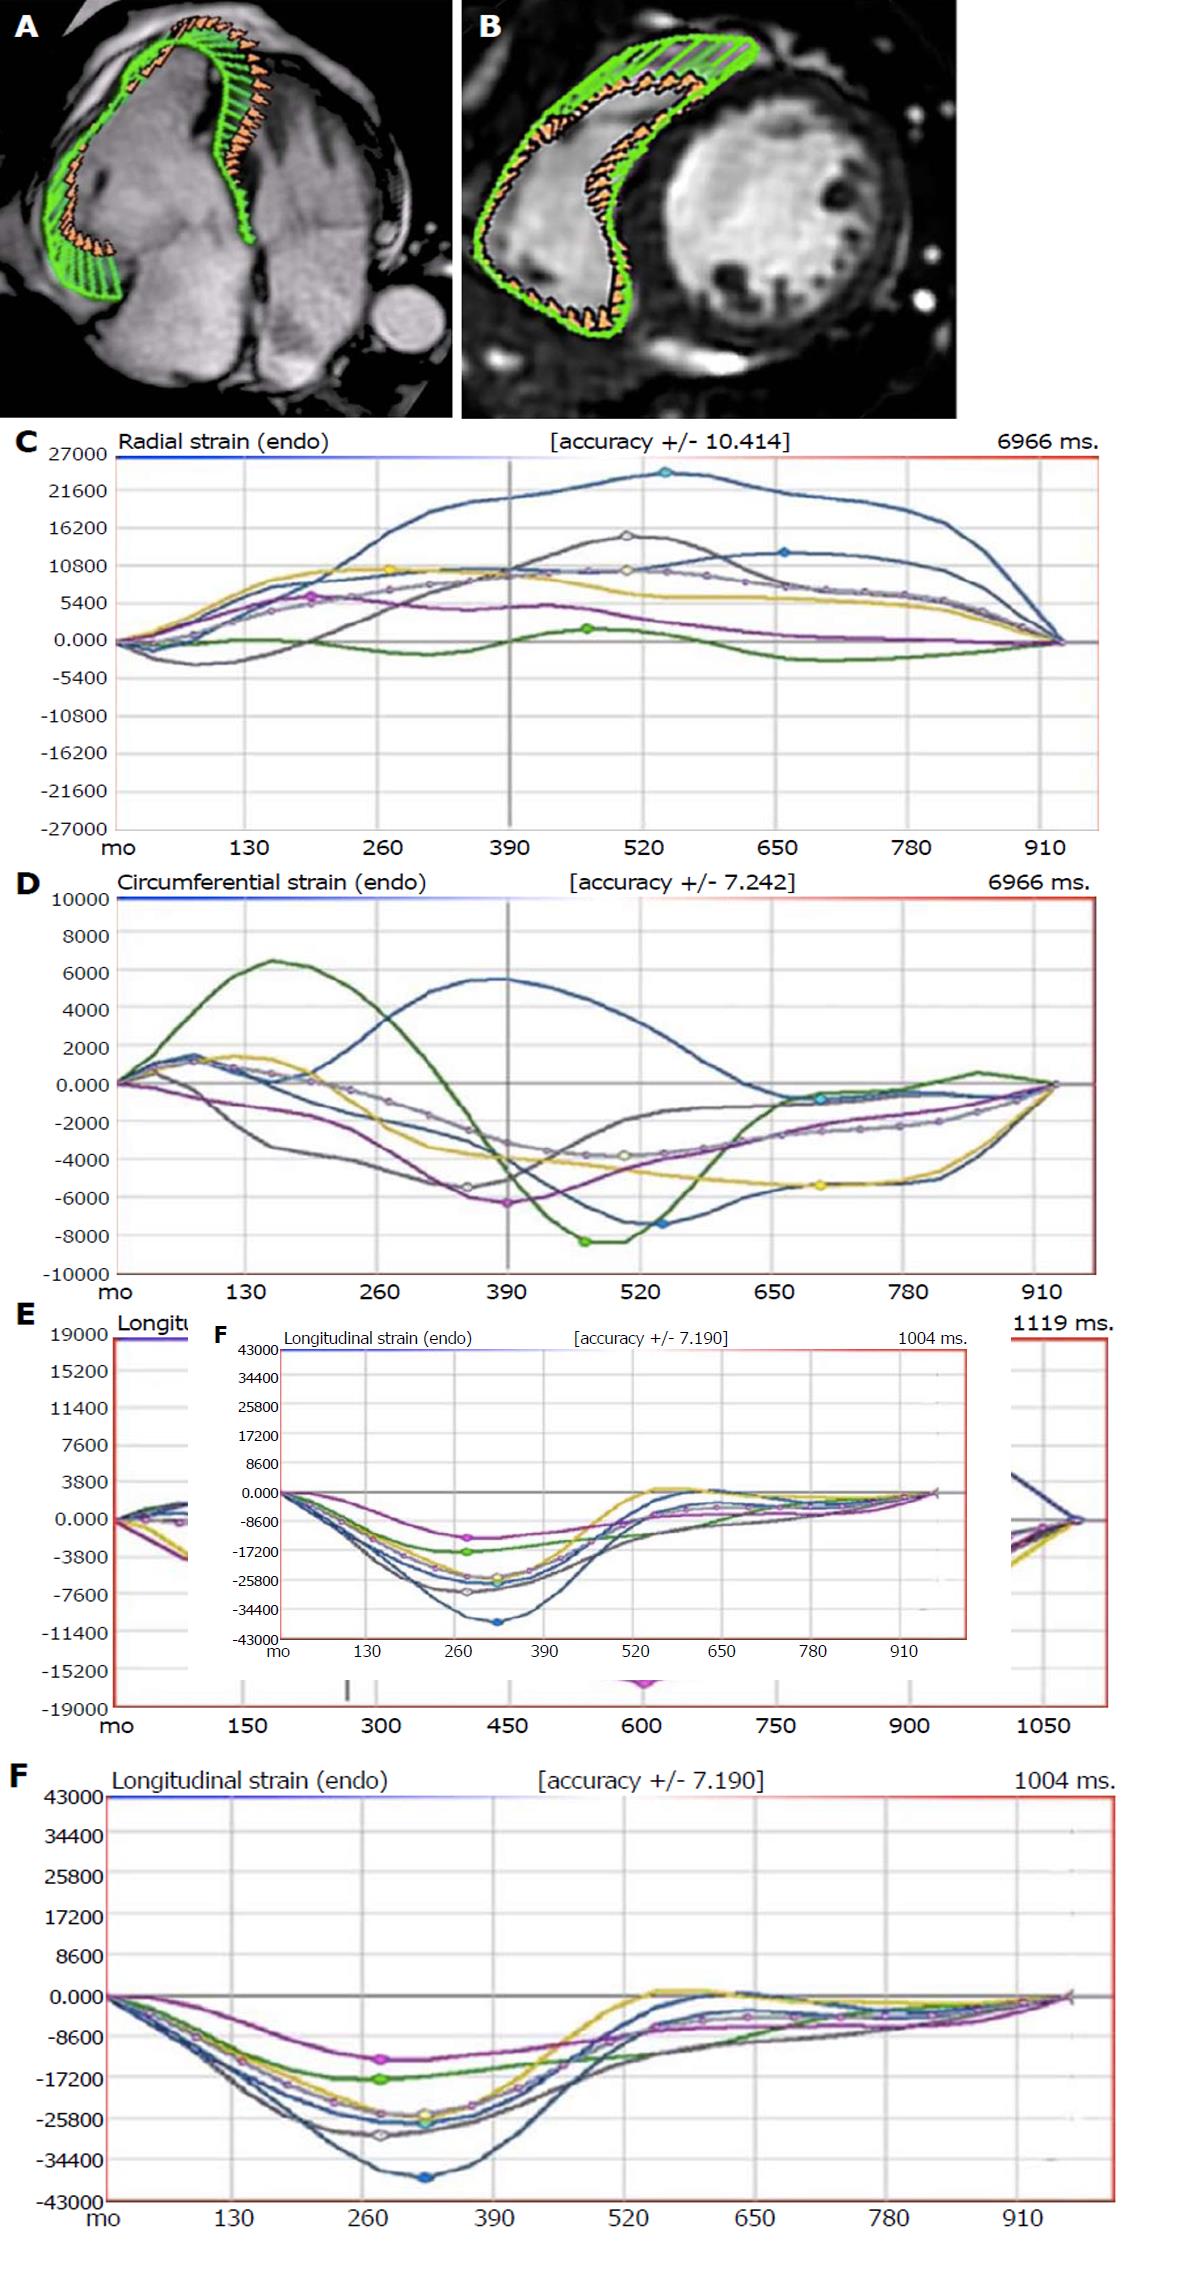
Figure 3 Example of endocardial feature tracking of the right ventricle.
A: Tracking of the endocardial border of the right ventricle (RV) on a 4-chamber steady-state free precession image using a dedicated feature-tracking software; B: Example of tracking on the mid-section of a short-axis view; C: Radial; D: Circumferential; E: Longitudinal strain patterns of a patient with arrhythmogenic RV cardiomyopathy; F: Example of the RV longitudinal strain pattern of a healthy subject. Reprinted with permission from Prati et al[45].
- Citation: Muser D, Castro SA, Santangeli P, Nucifora G. Clinical applications of feature-tracking cardiac magnetic resonance imaging. World J Cardiol 2018; 10(11): 210-221
- URL: https://www.wjgnet.com/1949-8462/full/v10/i11/210.htm
- DOI: https://dx.doi.org/10.4330/wjc.v10.i11.210


