Copyright
©The Author(s) 2018.
World J Cardiol. Oct 26, 2018; 10(10): 165-186
Published online Oct 26, 2018. doi: 10.4330/wjc.v10.i10.165
Published online Oct 26, 2018. doi: 10.4330/wjc.v10.i10.165
Figure 1 Performance of bioresorbable vascular scaffolds in the market.
A schematic representation of the Gartner Hype Cycle for the bioresorbable vascular scaffold.
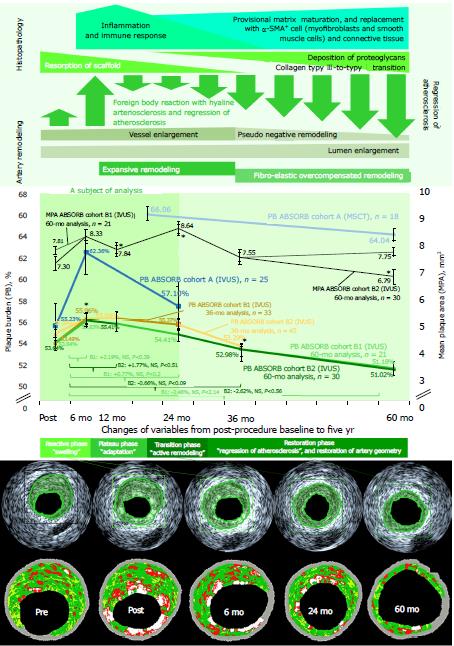
Figure 2 Plaque burden in patients of ABSORB cohort A and B trials at 60 mo.
The top panel outlines the acute/subacute and chronic inflammatory/immune response to the implantation of the BVS, which is ongoing during the first 24-36 mo. The middle panel renders a pooled analysis of the plaque burden (PB) and mean plaque area (MPA) in the selected ABSORB phase I/II trials and different multimodality imaging analyses through the five years of the study. The bottom panel shows an example of the grey scale- and virtual histology-IVUS analyses in the five-year time-frame of the ABSORB trial highlighting a clear reduction of the plaque area and artery remodeling with the lumen enlargement and positive expansive remodeling of the vessel at least until 24 mo with the further constrictive-like remodeling. The figure was adapted from reference [34].
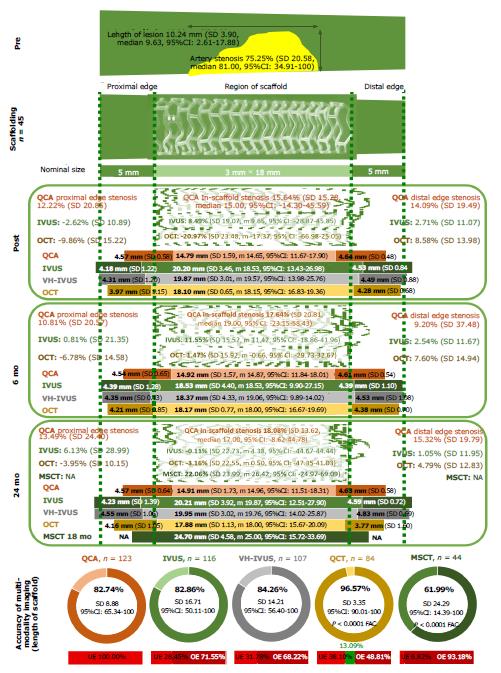
Figure 3 The accuracy of multimodality imaging analysis.
The analysis of accuracy (trueness and precision) administered with quantitative coronary angiography, intravascular ultrasound, virtual histology-IVUS, multislice computed tomography, and optical coherence tomography by the nominal length of the scaffold, which was 18 mm in all cases. The panel defines the spread-out-vessel graphics (axial resolution of 200 μm) with the appearance of the scaffolded and edge regions pre- and post-procedure at 6 mo and 24 mo. The figure was adapted from ref. [34]. UE: Underestimated (observations with the length of the scaffolded region less than 18 mm); OE: overestimated (the examined scaffolded region was more than 18 mm). QCA: quantitative coronary angiography; IVUS: intravascular ultrasound; VH-IVUS: virtual histology-intravascular ultrasound; OCT: optical coherence tomography; MSCT: multislice computed tomography.
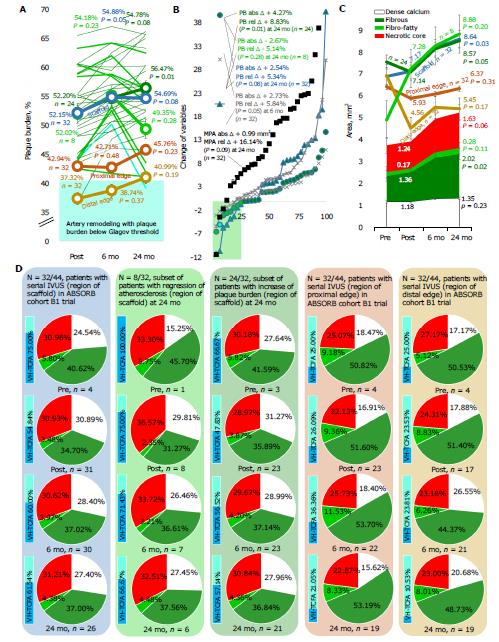
Figure 4 The artery remodeling in ABSORB cohort B1 trial.
A, B: The plaque burden (%) in 44 patients of cohort B1 trial (panel A with the changes at panel B); C, D: The proportion between the lesion components, which was computed by virtual histology-intravascular ultrasound imposed for each patient, but the percentage of each plaque component did not differ significantly between baseline and 24 mo. The depicted results mounted as the mean of the estimated proportions. The figure was adapted from ref. [34]. n: Number of patients; MPA: Mean plaque area; abs: Absolute; rel: Relative; VH-TCFA: Virtual histology-thin-cap fibroatheroma; PB: plaque burden; VH-IVUS: virtual histology-intravascular ultrasound.
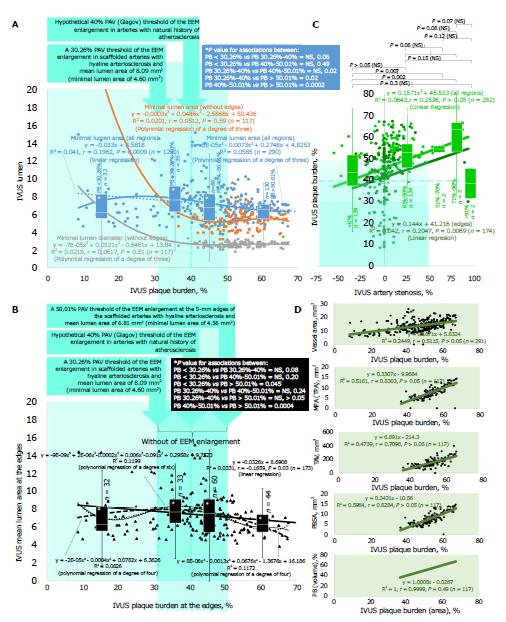
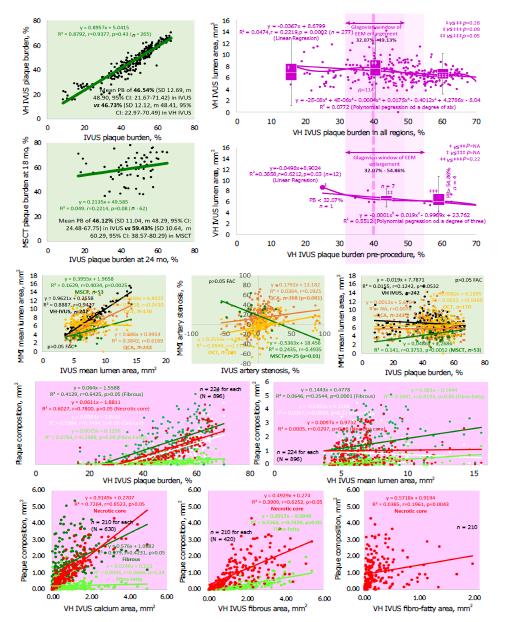
Figure 5 The external elastic membrane enlargement and Glagovian artery remodeling.
A, B: Character regression analysis of the associations between plaque burden (PB) and lumen geometry verified by intravascular ultrasound (IVUS). The linear and polynomial regression of the different degrees at the regions of scaffold and edges bared two boundaries (30.26% and 50.01%) of the phenomenon of the external elastic membrane (EEM) enlargement (shown with a vertical stripe). The further box-and-whisker analysis was from four PB distributions (PB < 30.26%, PB 30.26%-40%, PB 40%-50.01%, and PB > 50.01%) to assess patterns of the Glagovian artery remodeling; C, D: The comparison of PB with artery stenosis (adjusted by the mean reference area) with a five-distribution box-and-whisker analysis (artery stenosis < 0%, 0%-50%, 51%-70%, 71%-90%, and > 91%); The upper boundary of the window of the EEM enlargement where artery stenosis was no more than 45% (C). The associations between IVUS PB and other variables characterizing the lesion geometry were estimated (D). The P value was calculated for comparison of one or two variables in order to either examine the means of two groups (paired or unpaired t test) or test statistical consistency for regression. The figure was adapted from ref. [34]. n: Number of observations; PAV: Percent atheroma volume; R2: Coefficient of determination; r: Pearson correlation (for linear regression); IQR: Interquartile range; NS: Non-significant (P > 0.05); PBSA: Plaque behind stent area; TAV: Total atheroma volume; MPA: Mean plaque area.
Figure 6 The association between the components of the lesion and artery layers.
The correlation between plaque burden (PB) assessed by intravascular ultrasound (IVUS) and virtual histology (VH)-IVUS was strong with relatively weak association with PB evaluated by multislice computed tomography (MSCT) (top left panel). The three-distribution (PB < 32.07%, PB 32.07%-49.13%, and PB > 49.13%) box-and-whisker analysis (top right panel separately for all regions and pre-procedure) of the VH-IVUS-examined correlation between PB and lumen area vindicated existence of the window of the external elastic membrane (EEM) enlargement between 32.07% and 49.13%. The pre-procedure evaluation in naïve arteries with a broader size of the window between 32.07% and 54.86%. The middle and bottom panels set out correlations between plaque burden, lumen, vessel wall dimensions, and components of the lesion examined by the various imaging modalities. The P value was calculated for comparison of one or two variables in order to either estimate the means of two groups (paired or unpaired t test) or appreciate statistical consistency for regression. The figure was adapted from ref. [34]. n: Number of observations; N: Total number of observations at the screened population; R2: Coefficient of determination; r: Pearson correlation (for linear regression); IQR: Interquartile range; NS: Non-significant (P > 0.05); NA: Not applicable.
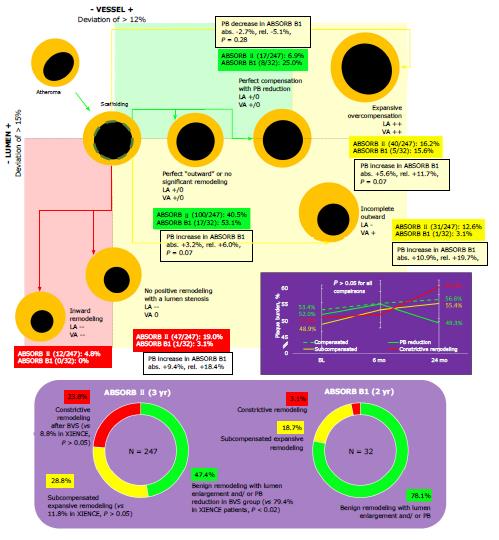
Figure 7 Arterial remodeling in coronary arteries after transient scaffolding with Absorb bioresorbable vascular scaffold.
Patterns of Pasterkamp remodeling demonstrated at the top panel with a percent of patients in RCT ABSORB II and observational ABSORB B1 trials with a plaque burden (PB) change in ABSORB cohort B1 trial. The bottom panel demonstrates a percentage of the different types of the arterial remodeling in Absorb bioresorbable vascular scaffold patients. The middle dark purple panel shows dynamics of PB in patients of ABSORB cohort B1 trial. Mean PB in subsets failed to achieve Glagovian threshold of a 40% PB in all scenarios. P < 0.05 if compared with XIENCE.
- Citation: Kharlamov AN. Undiscovered pathology of transient scaffolding t1remains a driver of failures in clinical trials. World J Cardiol 2018; 10(10): 165-186
- URL: https://www.wjgnet.com/1949-8462/full/v10/i10/165.htm
- DOI: https://dx.doi.org/10.4330/wjc.v10.i10.165


