Copyright
©The Author(s) 2017.
World J Biol Chem. Nov 26, 2017; 8(4): 175-186
Published online Nov 26, 2017. doi: 10.4331/wjbc.v8.i4.175
Published online Nov 26, 2017. doi: 10.4331/wjbc.v8.i4.175
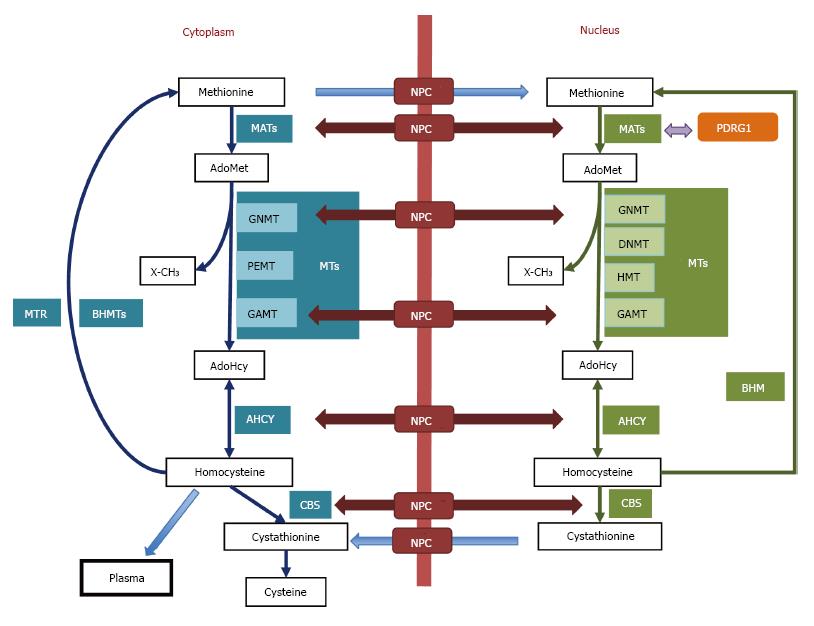
Figure 1 The cytoplasmic and nuclear branches of the hepatic methionine cycle and transsulfuration.
Essential components (metabolites and enzymes) of the pathways are shown in the figure. Cytoplasmic enzymes appear in aquamarine boxes, their nuclear equivalents are shown in green boxes, and protein interaction targets are depicted in orange. Only key methyltranferases (MTs) mentioned in the text are illustrated in both subcellular compartments. The nucleocytoplasmic transport of metabolites (blue arrows) and enzymes (maroon arrows) is shown, whereas protein interactions are indicated by violet arrows. AdoHcy: S-adenosylhomocysteine; AdoMet: S-adenosylmethionine; AHCY: S-adenosylhomocysteine hydrolase; BHMT: Betaine homocysteine S-methyltransferase; CBS: Cystathionine β-synthase; DNMT: DNA methyltransferase; GAMT: Guanidinoacetate N-methyltransferase; GNMT: Glycine N-methyltransferase; HMT: Histone methyltransferase; MATs: Methionine adenosyltransferases; MTR: Methionine synthase; NPC: Nuclear pore complex; PDRG1: p53 and DNA damage-regulated gene 1; PEMT: Phosphatidylethanolamine N-methyltransferase; X-CH3: Methylated acceptors (metabolites, proteins, DNA, etc).
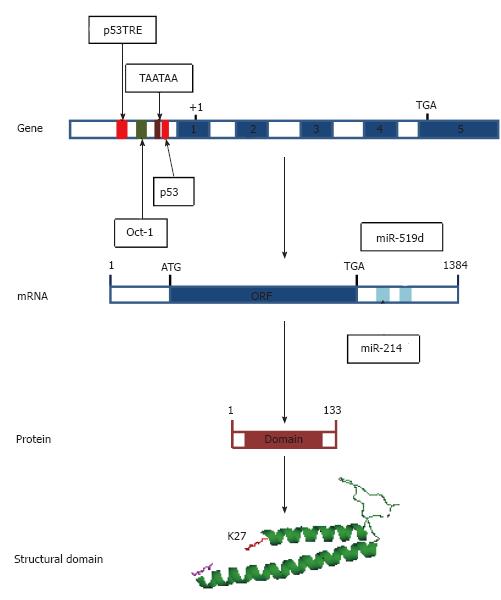
Figure 2 Regulatory elements on the human PDRG1 gene and mRNA and structural features of the protein.
From top to bottom, the figure shows first a scheme of the human PDRG1 gene, indicating the regulatory elements on the promoter identified to date as follows: p53 and p53TRE elements (red), an Oct-1 binding element (green) and the TATA-box-like element (crimson). Exons appear as blue boxes. Second, a schematic representation of the mRNA is depicted, including the ORF (blue box) and the miRNA binding sites identified at the 3’-UTR (aquamarine boxes). Third, a scheme of the PDRG1 protein is shown where the sequence encoding the prefoldin-like domain is indicated as a crimson box. Finally, a cartoon of the modeled prefoldin-like domain of rat PDRG1 is included with the N-terminal K27 (red) and the C-terminal Q106 (magenta) depicted as sticks.
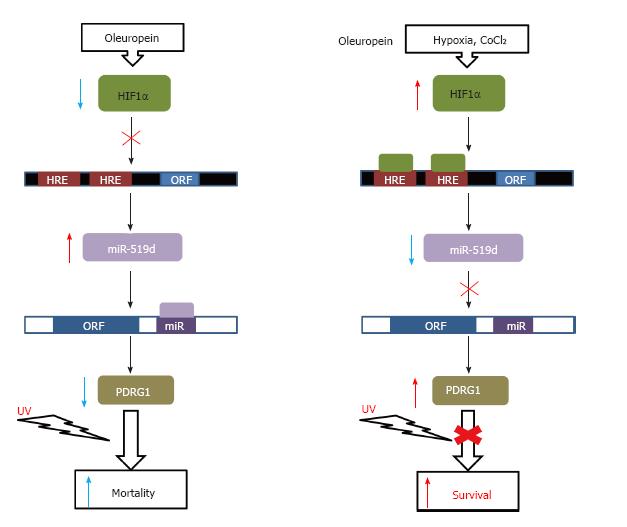
Figure 3 Regulation of cell survival.
A schematic representation of the effects on cell survival exerted by PDRG1 regulation through miR-519d expression is shown. Binding sites for HIF1a (HRE) in the promoter of the miR-519d gene (black box) and for this miRNA on the PDRG1 mRNA (white box) are indicated. Agents used for induction or blockade of UV-irradiation effects are indicated on the top.
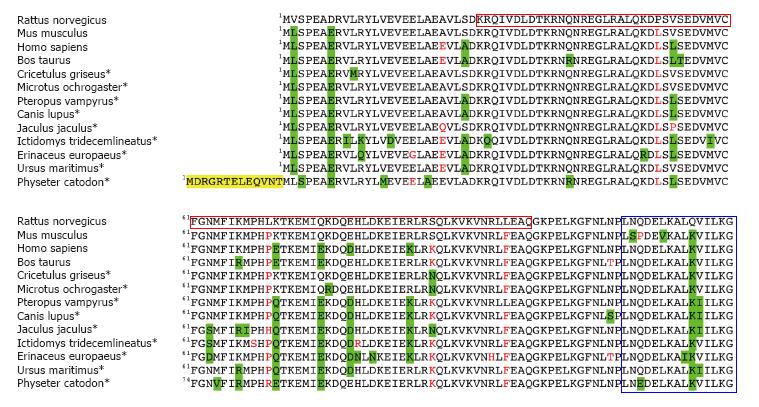
Figure 4 Alignment of mammalian PDRG1 proteins.
The figure shows the BLASTP alignment of thirteen representative mammalian PDRG1 sequences using that of Rattus norvegicus as a reference. Most of the data correspond to predicted sequences (*). Conservative changes are highlighted in green, non-conservative substitutions appear in red, and N-terminal extensions are indicated in yellow. The C-terminal helix-turn-helix motif and the prefoldin-like domain are indicated in blue and crimson boxes, respectively.
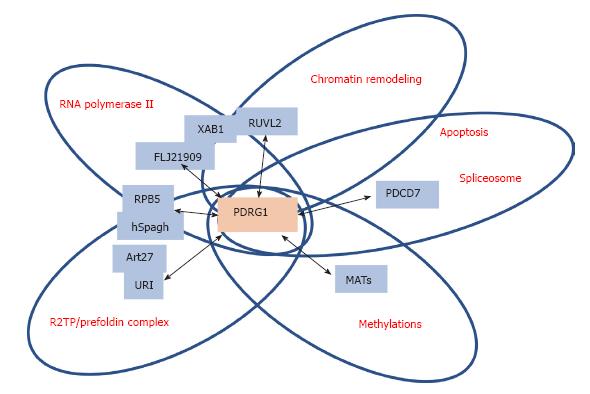
Figure 5 Schematic representation of the main PDRG1 interaction targets.
The figure highlights the main targets of interaction with PDRG1 identified using either affinity purification/mass spectrometry or yeast two-hybrid screening. The proteins involved are shown in blue boxes within circles, according to the function or multiprotein complex in which they are involved. PDRG1 appears at the intersection of these circles.
- Citation: Pajares MÁ. PDRG1 at the interface between intermediary metabolism and oncogenesis. World J Biol Chem 2017; 8(4): 175-186
- URL: https://www.wjgnet.com/1949-8454/full/v8/i4/175.htm
- DOI: https://dx.doi.org/10.4331/wjbc.v8.i4.175


