Copyright
©The Author(s) 2017.
World J Biol Chem. Feb 26, 2017; 8(1): 57-80
Published online Feb 26, 2017. doi: 10.4331/wjbc.v8.i1.57
Published online Feb 26, 2017. doi: 10.4331/wjbc.v8.i1.57
Figure 1 Chemical structures of benznidazole (1) and nifurtimox (2).
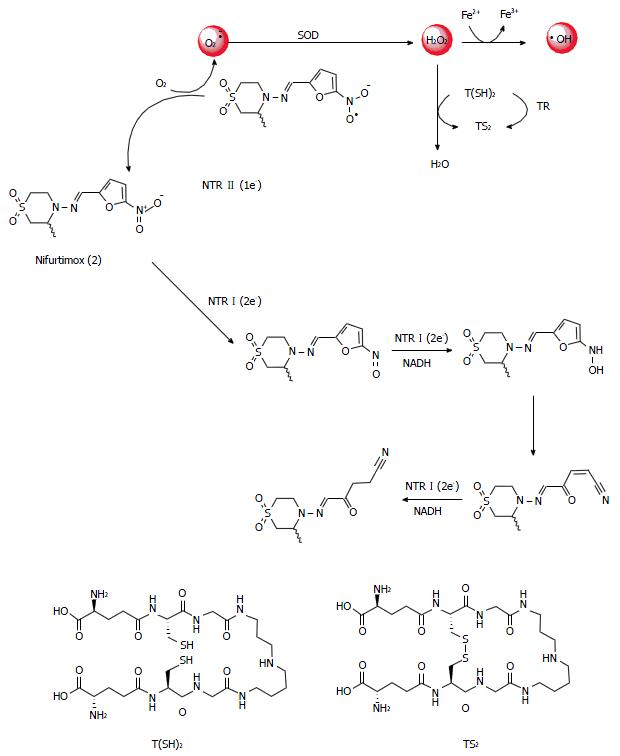
Figure 2 Nifurtimox (2) as a generator of reactive oxygen species.
SOD: Superoxide dismutase; TR: Trypanothione reductase; NTR: Nitroreductases; T(SH)2: Reduced trypanothione; TS2: Oxidized trypanothione.
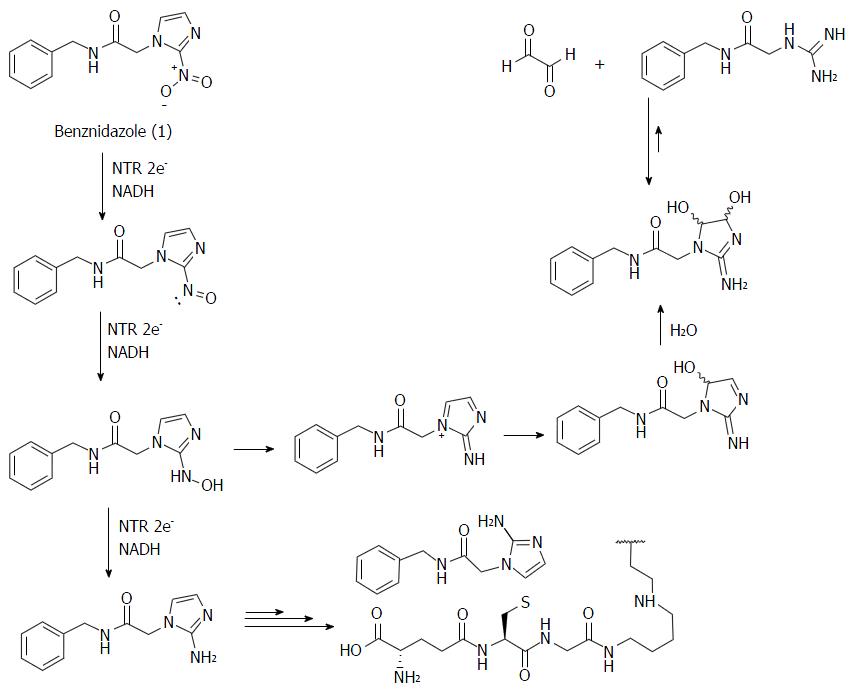
Figure 3 Benznidazole (1) is converted to nitroso metabolites and N-Aryl hydroxylamine, which can be enzymatically reduced to the corresponding 2-aminoimidazole derivative or nitrenio ion, which then is spontaneously di-hydroxylated generating a glyoxal molecule and guanidine derived.
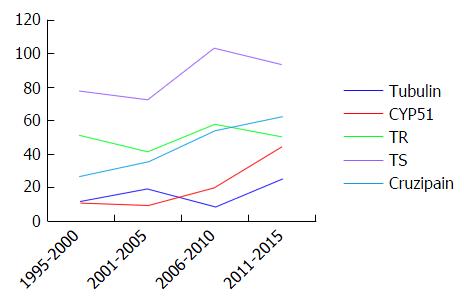
Figure 4 Search results of the terms “Trans-sialidase”, “Trypanothione reductase”, “Cruzipain and/or Cruzain”, “CYP 51 and/or sterol 14α -demethylase” and “Tubulin” with “Trypanosoma cruzi”.
The results show the evolution of the number of papers published since 1995, grouped in 5-year intervals. TS: Trans-sialidase; TR: Trypanothione reductase.
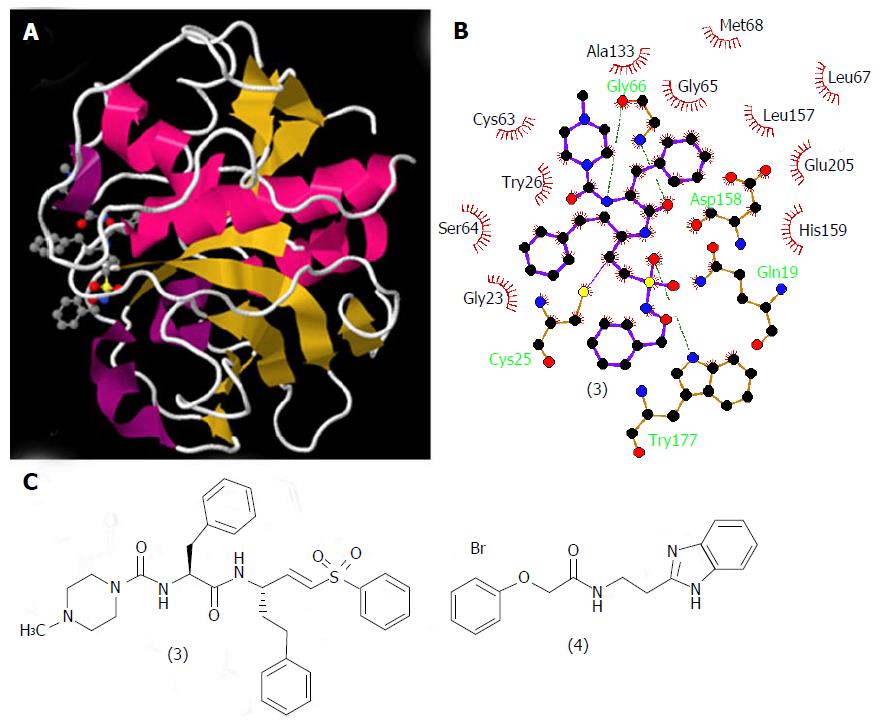
Figure 5 Structures of cruzain and its ligands.
A: Three-dimensional structural representation of cruzain crystallized with vinyl sulfone derivative (3). Structure deposited in the Protein Data Bank under the code 1F2C[45]; B: Schematic representation in two dimensions of the binding mode of (3) to cruzain generated by LigPlot+ software upon the PDB file; C: Structures of the cruzain inhibitor derivatives (3) and (4).
Figure 6 The equilibrium between the oxidized (TS2) and reduced [T(SH)2] forms of trypanothione.
The reduction process takes place with catalysis of trypanothione reductase and the oxidation process occurs spontaneoulsy by oxidative action of reactive oxygen species (ROS).
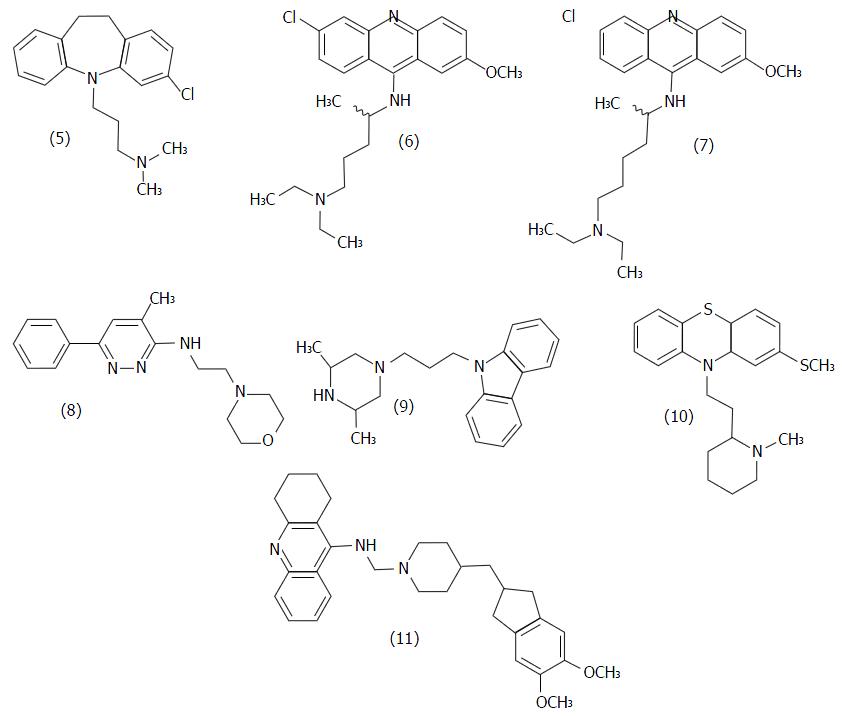
Figure 7 Structure of some non-peptidic T.
cruzi trypanothione reductase inhibitors.
Figure 8 Structure of peptidic inhibitors of T.
cruzi trypanothione reductase.
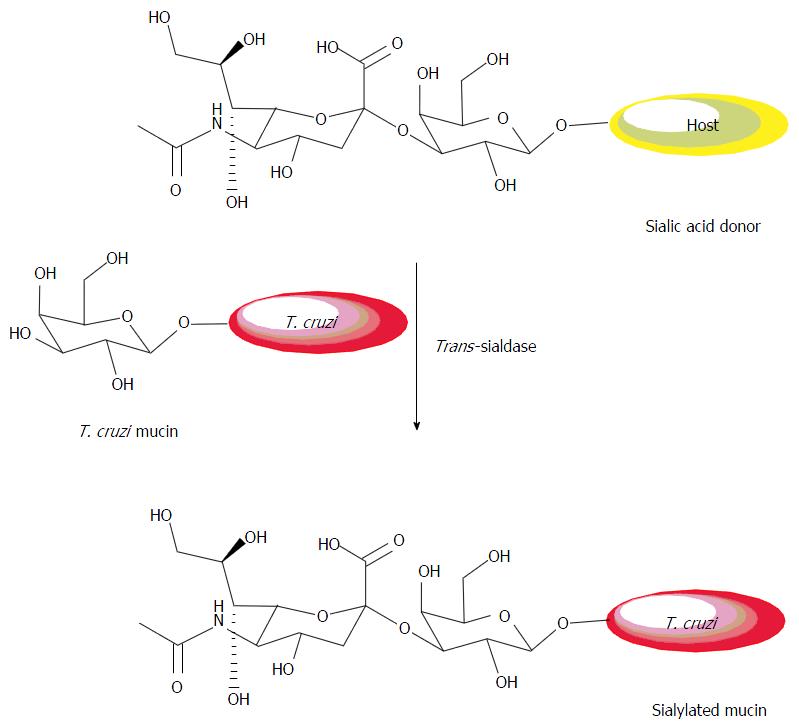
Figure 9 Transfer of sialic acid from a host glycoprotein to a β-galactopyranose from the parasite.
This transfer occurs at the position 3 of the terminal sugar of the oligosaccharide which it is attached. Adapted from GIORGI and LEDERKREMER[60].
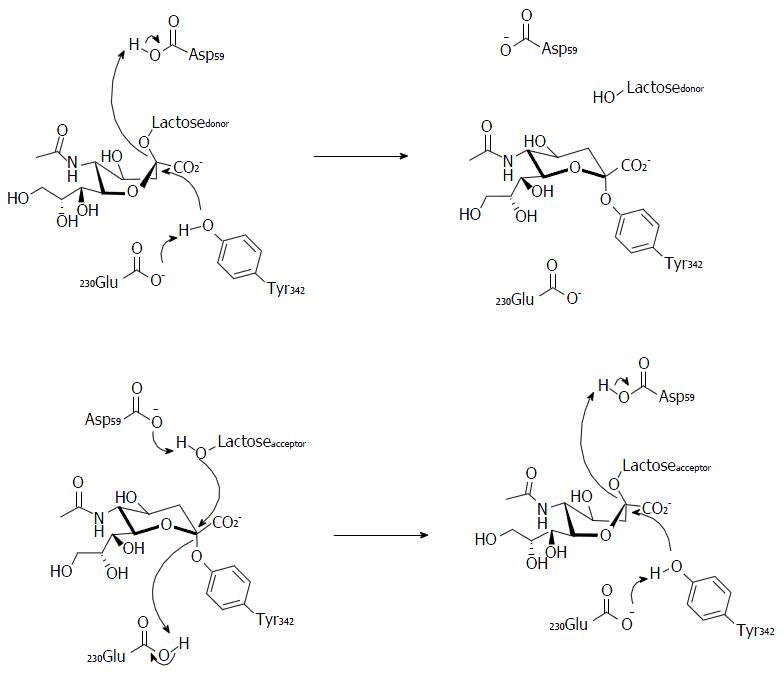
Figure 10 Proposed mechanism for the sialic acid transfer on the TcTS, showing Tyrosine 342 as the nucleophilic residue[62].
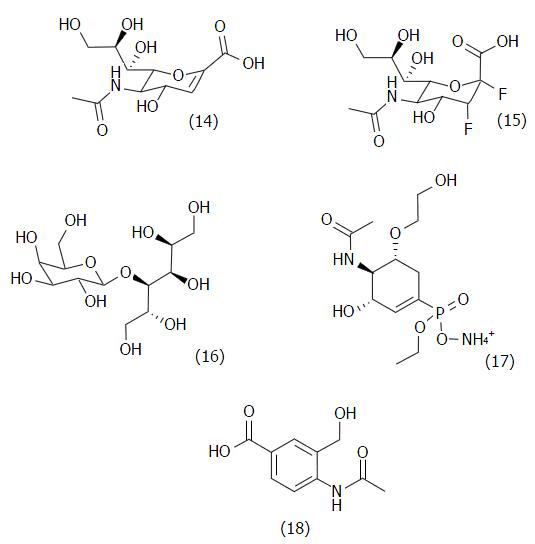
Figure 11 Chemical structures of the first T.
cruzi trans-sialidase inhibitors (14-18). The more potent is (18), with a Ki = 300 μmol/L.
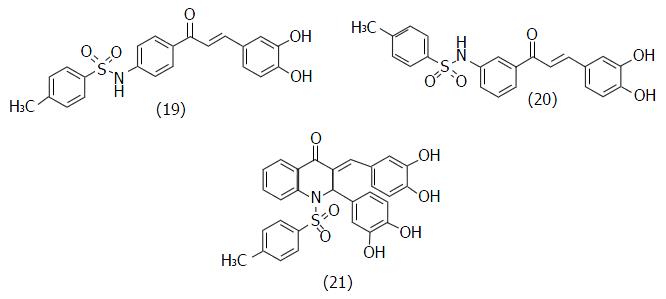
Figure 12 Chemical structures of the sulfonamide-chalcone derivatives designed by Kim et al[68] (19, IC50 = 0.
9 μmol/L; 20, IC50 = 2.5 μmol/L; 21, IC50 = 0.6 μmol/L).
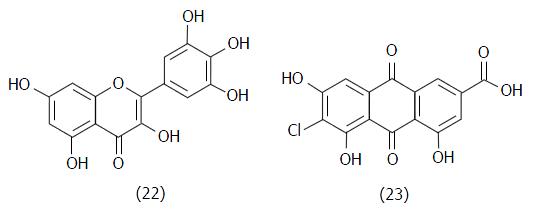
Figure 13 Chemical structures of myricetin (22, IC50 = 17 μmol/L) and the anthraquinone (23, IC50 = 0.
58 μmol/L), TcTS inhibitors found by Arioka et al[69] from a natural products library.
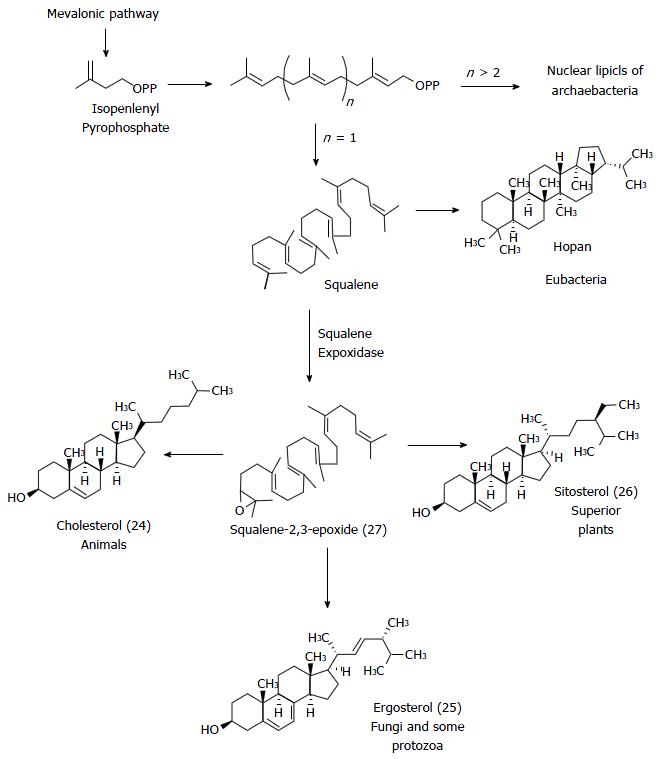
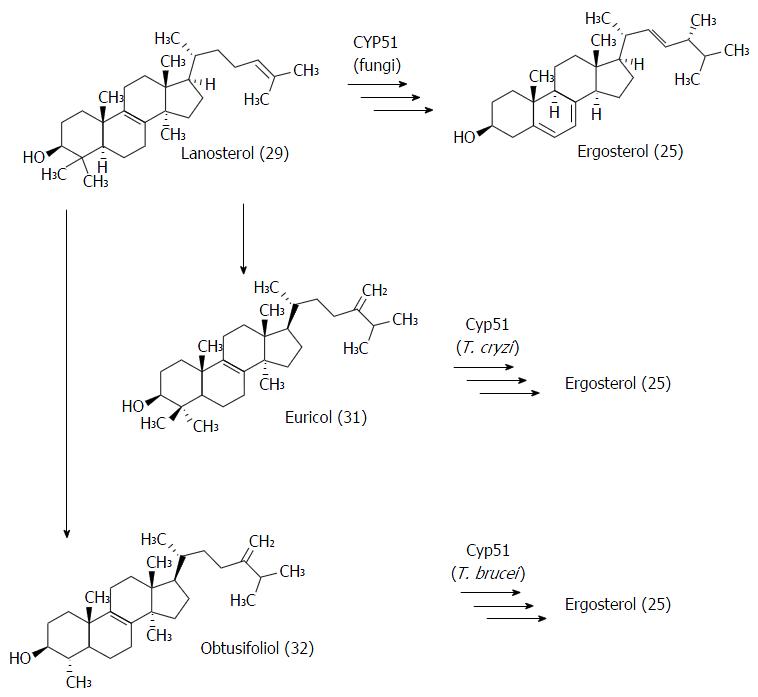
Figure 14 Comparative biosynthesis of natural membrane steroids of different organisms.
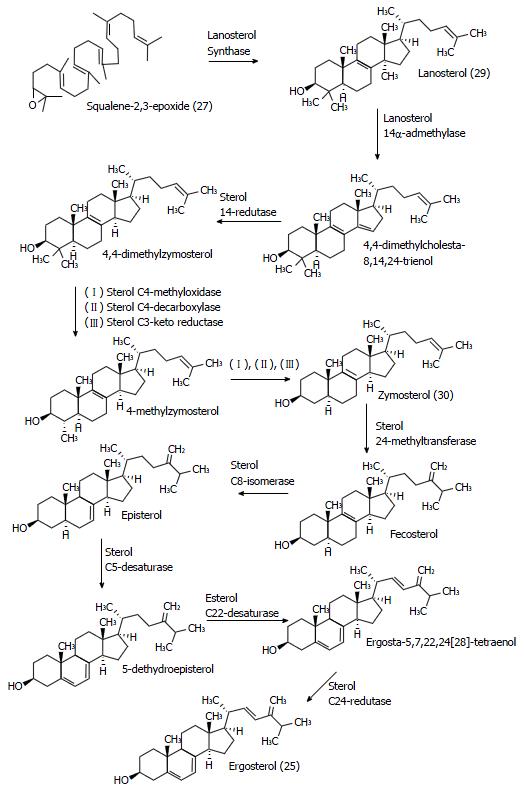
Figure 15 Ergosterol (25) biosynthesis in yeast (Saccharomyces cerevisiae), from squalene oxide.
Figure 16 Structure of CYP51 preferential substrates in fungi (29), T.
cruzi (31) and T. brucei (32).
Figure 17 Structures of azole derivatives active in T.
cruzi infection model: Ketoconazole (28), VNI (33), itraconazole (34) and fluconazole (35). Crystallographic structure of T. cruzi CYP51 with fluconazole (35) linked to the catalytic site of the enzyme [available at Protein Data Bank under the code 2wx2 (left)]. Bidimensional scheme of fluconazole (35) binding interaction with the catalytic site of the enzyme, generated by the program LigPlot+ from the same code (right).
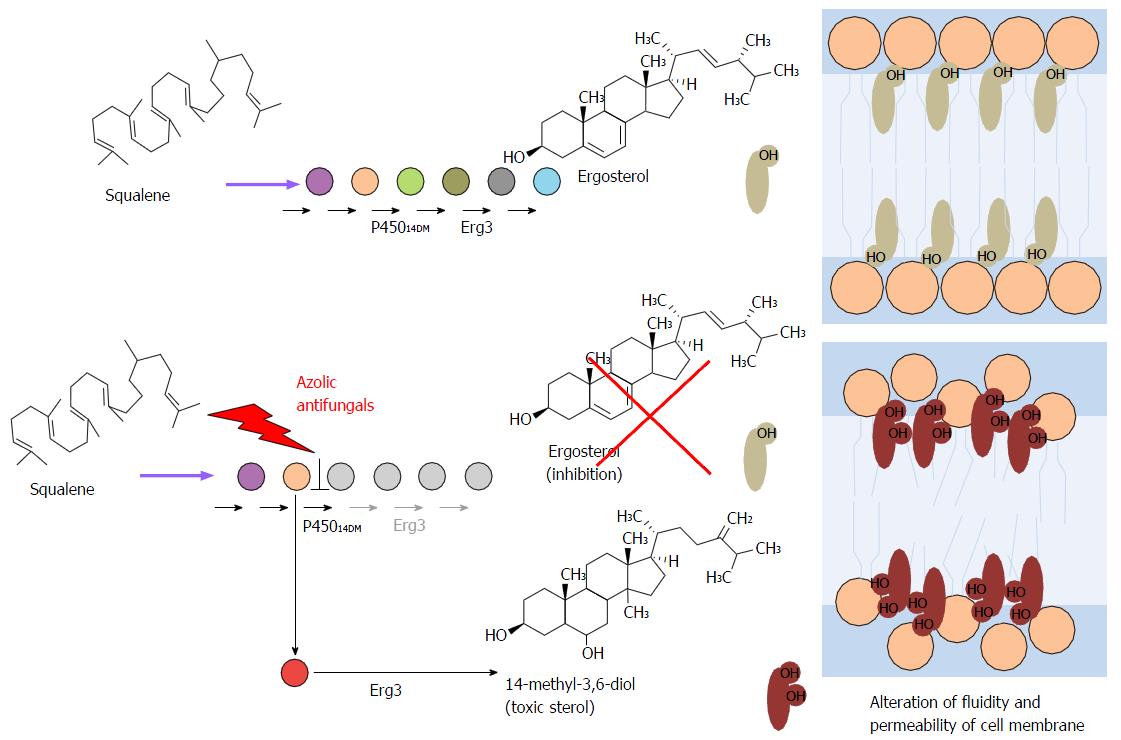
Figure 18 Schematic representation of the mechanism of actions of azolic compounds upon ergosterol (25) synthesis and subsequente alteration of composition and organizarion of cell membrane.
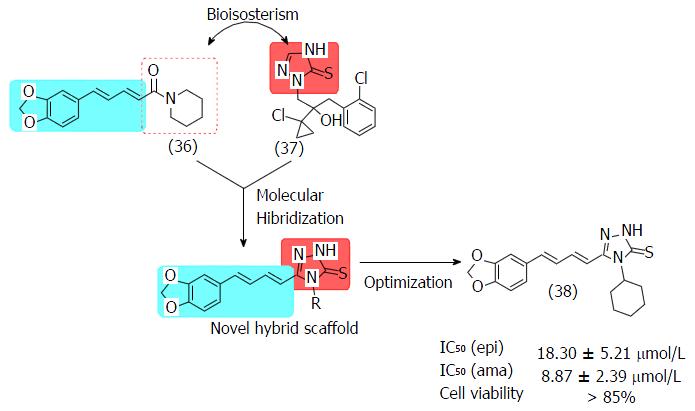
Figure 19 Structures of piperine (36), prothioconazole (37) and cycloexyltriazole (38), and its IC50 values against epi- and amastigotes of T.
cruzi and the toxic profile against murine macrophages.
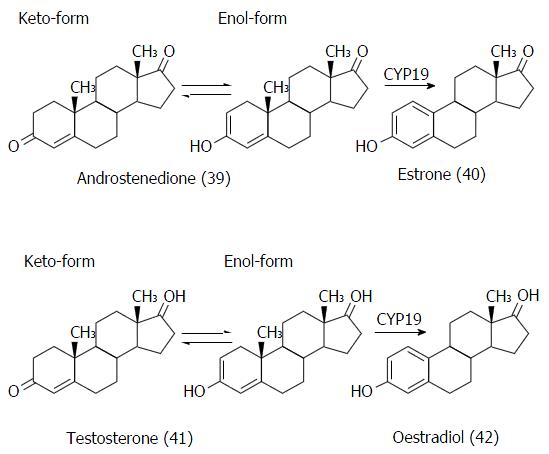
Figure 20 Reactions catalyzed by aromatase (CYP19): Conversion of androstenedione (39) to estrone (40) and testosterone (41) to oestradiol (42).
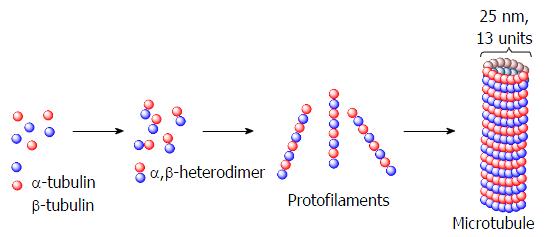
Figure 21 Schematic representation of protofilaments formed by polymerization of the heterodimers of alpha and beta tubulin.
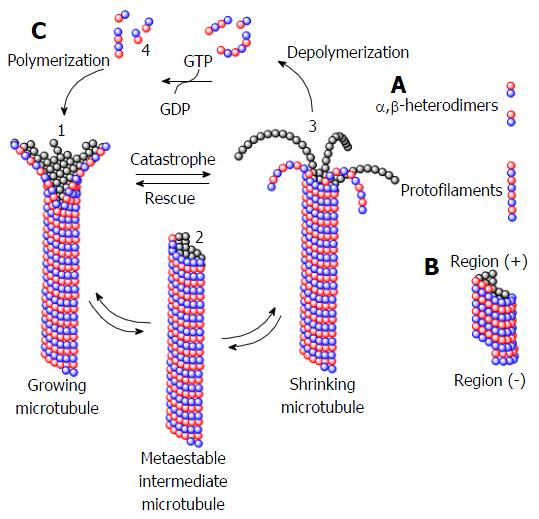
Figure 22 Schematic representation of polymerization/depolymerization dynamics of microtubules.
A: Formation of protofilament with alpha e beta-tubulin heterodimers; B: Formation of microtubule with regions (+) and (-); C:Relationship between polymerization and GTP hydrolysis equilibrium, where is perceived: (1) the polymerization of the GTP-terminal microtubule; (2) an intermediate where the kinetics of hydrolysis and polymerization are equivalent; (3) the microtubule depolymerizing when the hydrolisys rate is superior; and (4) the microtubule salvation mediated by GTP consumption.
Figure 23 Structure of benzimidazolic compounds active on yeast (43) and nematoda (44, 45) but inactive against mammalian tubulin.
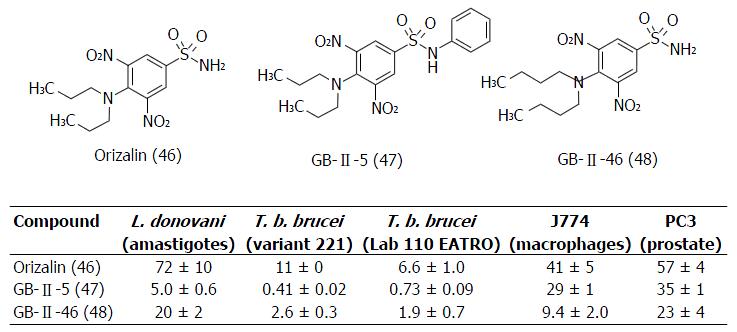
Figure 24 Structures and IC50 values (micromolar) of oryzalin (46) and the sulfonamide-dinitroanilin derivatives (47 and 48) against kinetoplastide and mamallian cells[98].
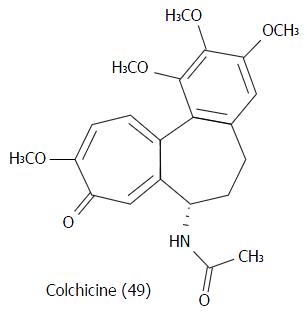
Figure 25 Chemical structure of colchicine (49).
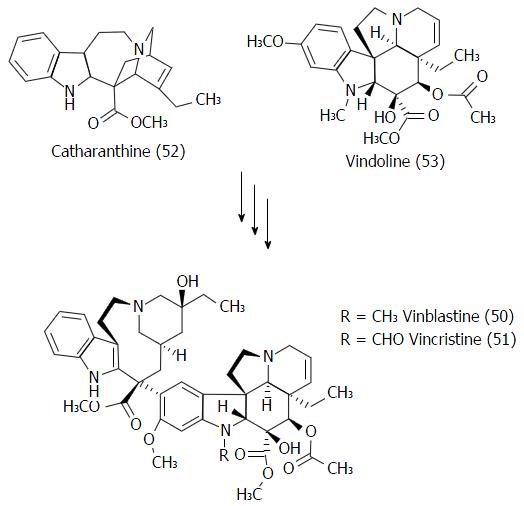
Figure 26 Structures of the vinca alcaloids (50-51) and its biochemical precursors (52-53).
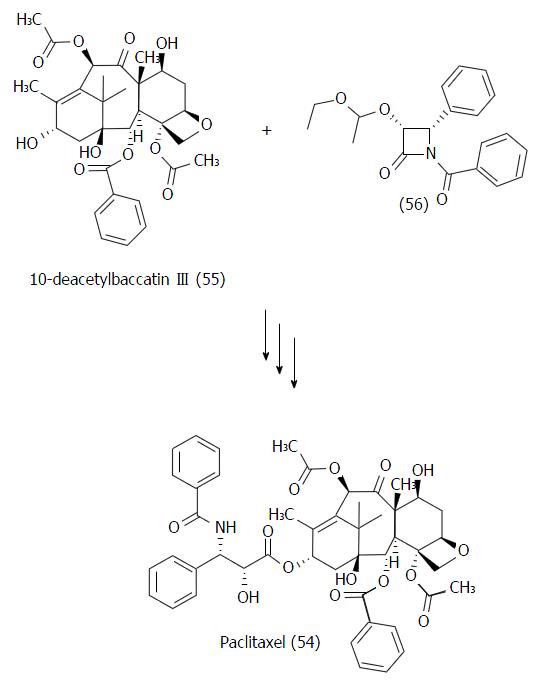
Figure 27 Synthetic strategy developed by Ojima et al[110] on the synthesis of paclitaxel (54) from the natural precursor 10-deacetylbaccatin III (55).
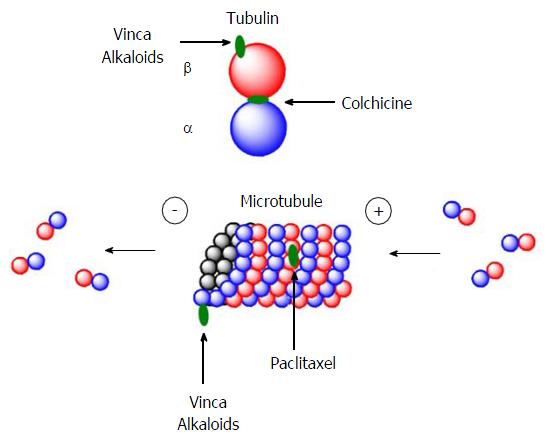
Figure 28 Representation of the binding site locations for the main tubulin ligands.
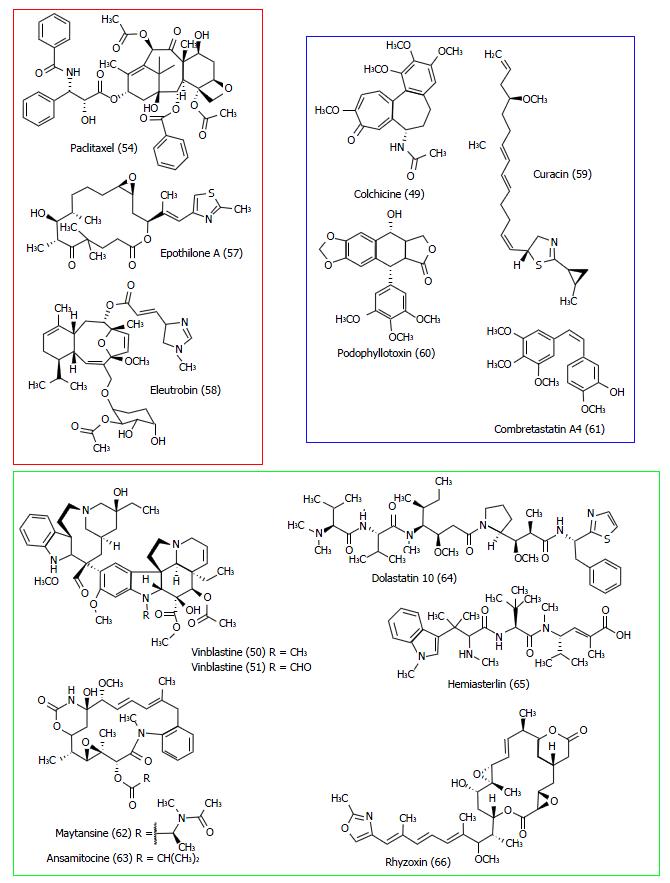
Figure 29 Structures of some ligands of the three main binding sites of tubulin: Taxol site (red), vinca alkaloids site (green) and colchicine site (blue).
Figure 30 Chemical structure of curcumin (67), a natural product that stabilizes microtubules by binding in a unique binding site of tubulin.
- Citation: Sueth-Santiago V, Decote-Ricardo D, Morrot A, Freire-de-Lima CG, Lima MEF. Challenges in the chemotherapy of Chagas disease: Looking for possibilities related to the differences and similarities between the parasite and host. World J Biol Chem 2017; 8(1): 57-80
- URL: https://www.wjgnet.com/1949-8454/full/v8/i1/57.htm
- DOI: https://dx.doi.org/10.4331/wjbc.v8.i1.57


