Copyright
©The Author(s) 2015.
World J Biol Chem. Nov 26, 2015; 6(4): 389-408
Published online Nov 26, 2015. doi: 10.4331/wjbc.v6.i4.389
Published online Nov 26, 2015. doi: 10.4331/wjbc.v6.i4.389
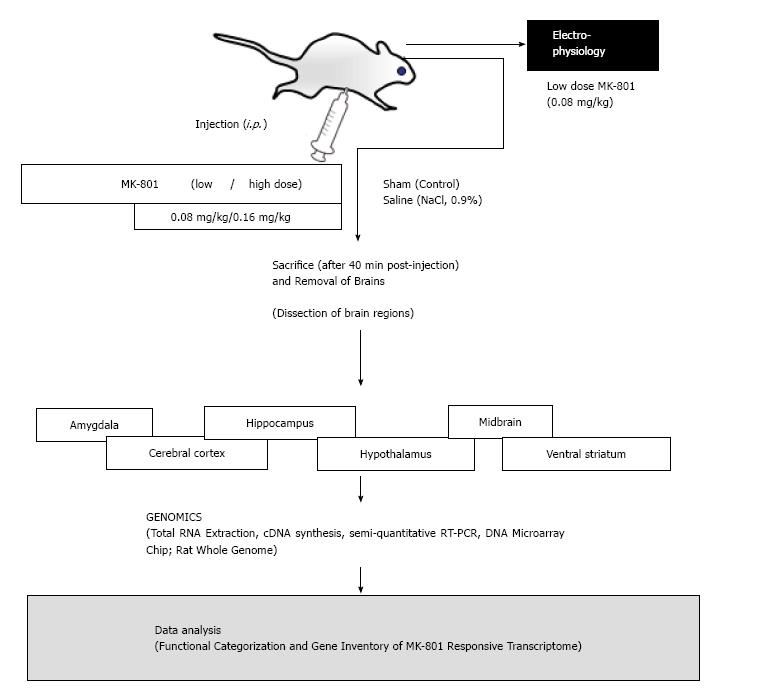
Figure 1 Experimental strategy and design to investigate the MK-801 effects on rat brain.
Details are mentioned in the Materials and Methods section.
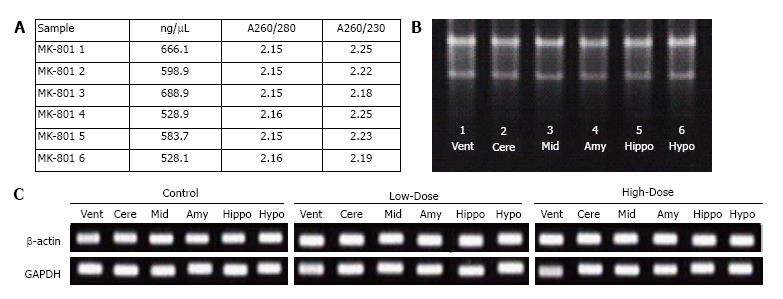
Figure 2 Total RNA quality and quantity check, and reverse transcription-polymerase chain reaction.
Total RNA quality was confirmed spectrophotometrically (A) and by formaldehyde agarose-gel electrophoresis (B). Stable expression levels of GAPDH and β-actin genes are shown (C). For further details, see the Materials and Methods section. GAPDH: Glyceraldehyde-3-phosphate dehydrogenase.
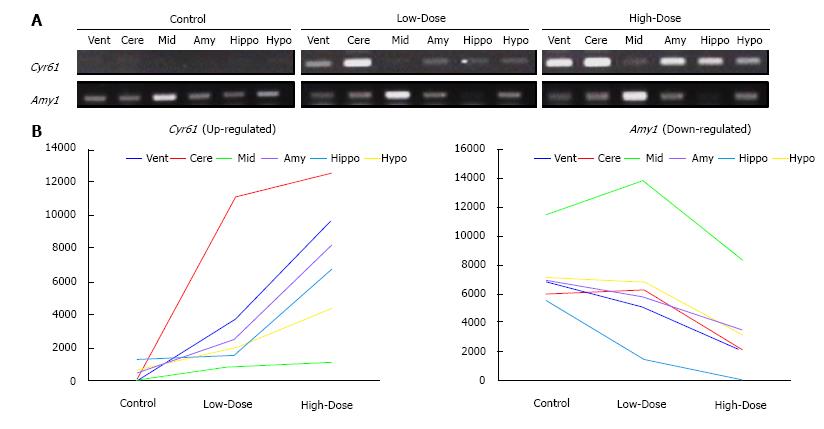
Figure 3 Reverse transcription-polymerase chain reaction analyses of Cyr61 and Amy1 genes that are differentially expressed in the six (6) brain regions by MK-801 treatment.
For the stable expression levels of GAPDH and β-actin genes, please see Figure 2C. For further details, see the Materials and Methods section. GAPDH: Glyceraldehyde-3-phosphate dehydrogenase.
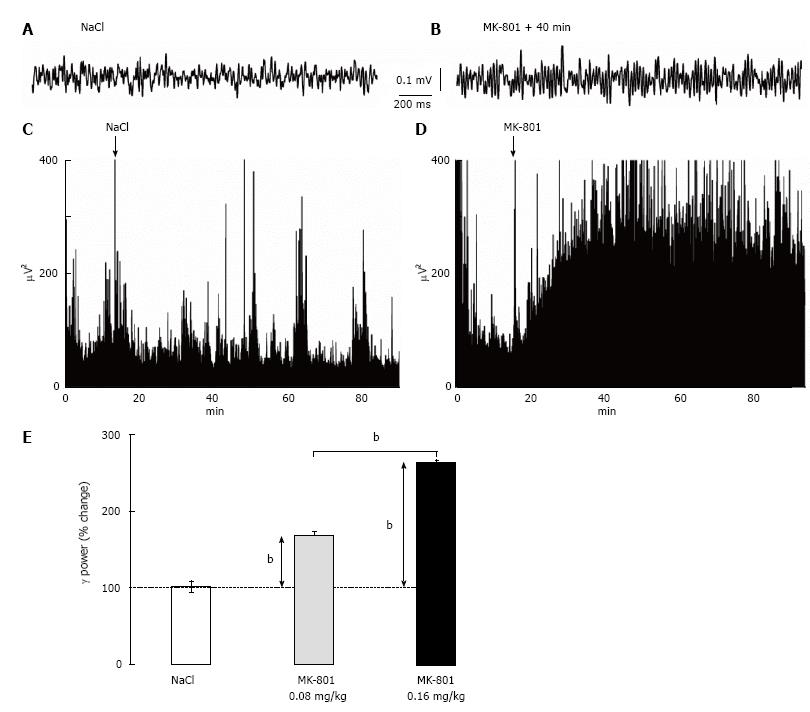
Figure 4 MK-801 increases the power of spontaneously-occurring gamma (30-80 Hz) oscillations.
A-B: Typical 2-s bouts of frontoparietal electrocorticogram (bandpass: 20-80 Hz) recorded in a free-moving awake rat under control (vehicle: NaCl, 0.9%, 1 mL/kg, A) and MK-801 (about 40 min after injection, 0.08 mg/kg, B) conditions; C-D: Each chart shows the total power (resolution: 2.4 Hz; average of 8 x 2.5-s epochs) of oscillations during a 90-min recording session, during which the rat received an injection [NaCl (C) or MK-801 (D)] at 15 min (arrow). Note that MK-801 induces a dramatic increase in power, which is still present at the end of the recording session; E: The histogram shows that MK-801 significantly (t-test, bP < 0.001) and in a dose-dependent manner increases the power during the 30 to 40 min post-injection period. All values are means ± SEM (5 rats > 100 values/rat, spectral analysis 2.5 s epochs).
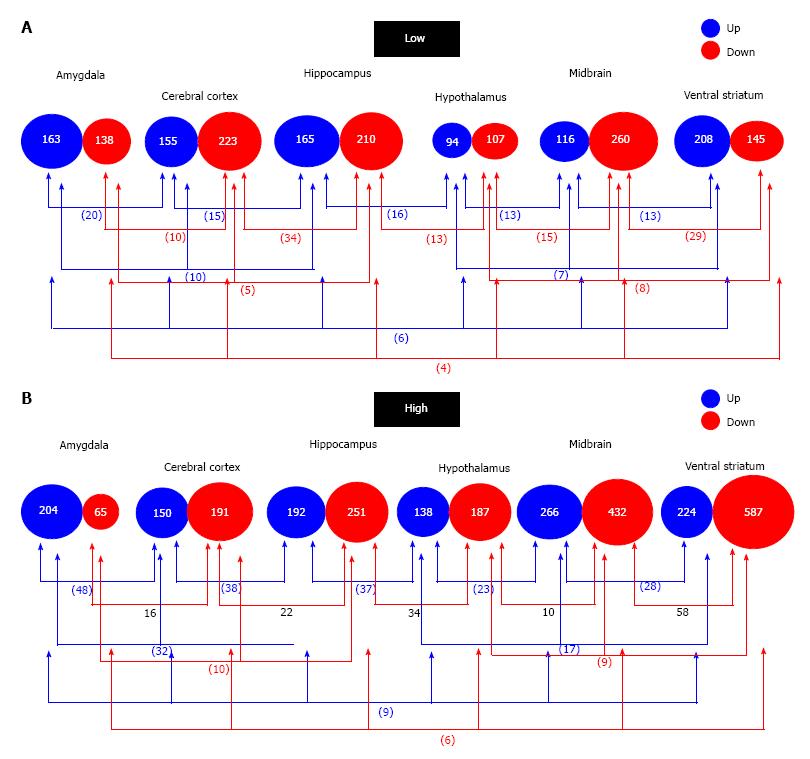
Figure 5 Number of changed genes in each brain region and the number of common genes among each region.
A: Low-dose of MK-801; B: High-dose of MK-801.
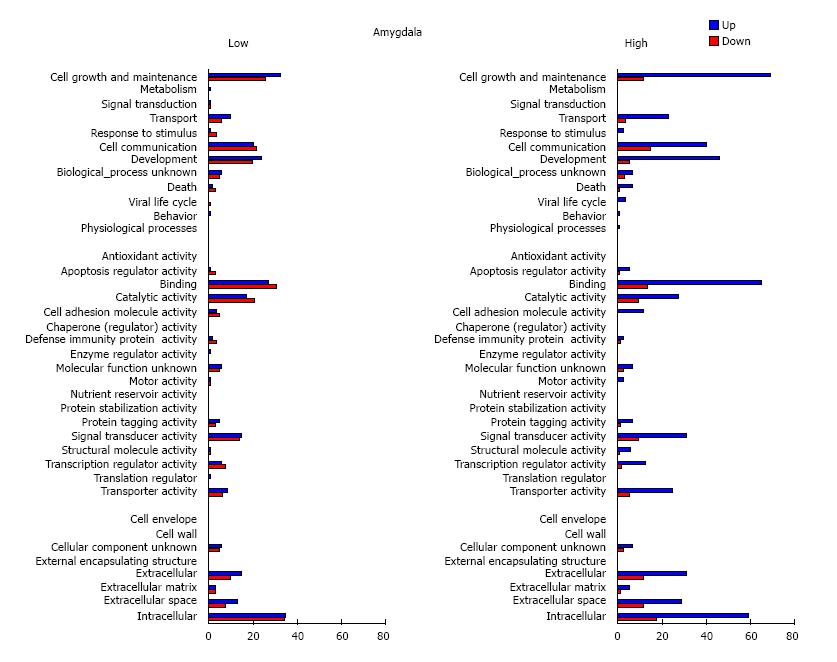
Figure 6 Functional categorization of the differentially expressed amygdala genes based on Gene Ontology.
Changed genes divided into 38 function categories in the amygdala.
- Citation: Kobayashi Y, Kulikova SP, Shibato J, Rakwal R, Satoh H, Pinault D, Masuo Y. DNA microarray unravels rapid changes in transcriptome of MK-801 treated rat brain. World J Biol Chem 2015; 6(4): 389-408
- URL: https://www.wjgnet.com/1949-8454/full/v6/i4/389.htm
- DOI: https://dx.doi.org/10.4331/wjbc.v6.i4.389


