Copyright
©The Author(s) 2015.
World J Biol Chem. Nov 26, 2015; 6(4): 366-378
Published online Nov 26, 2015. doi: 10.4331/wjbc.v6.i4.366
Published online Nov 26, 2015. doi: 10.4331/wjbc.v6.i4.366
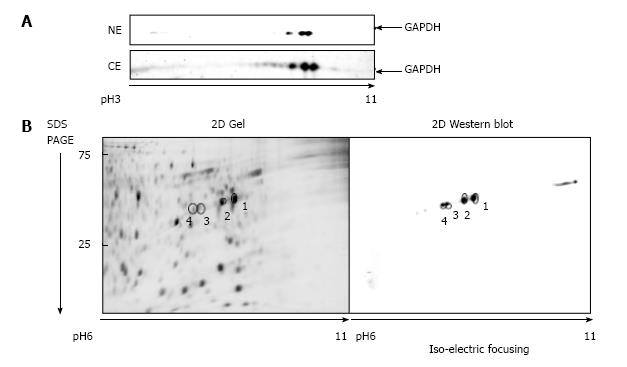
Figure 1 Glyceraldehyde 3-phosphate dehydrogenase isoforms in A549 cells.
A: 2D gel separation (pH range 3-11) of proteins from the nuclear (NE) and the cytosolic (CE) fraction of A549 cells after 1 μmol/L araC treatment for 24 h. The membrane was developed with anti-GAPDH antibody as described in “Materials and Methods”; B: Proteins from the cytosolic fraction were separated by 2D gel (pH range 6-11). Separated proteins were stained with SYPRO® Ruby (left panel), or developed with anti-GAPDH antibody (right panel). GAPDH: Glyceraldehyde 3-phosphate dehydrogenase; 2D: Two dimensional.
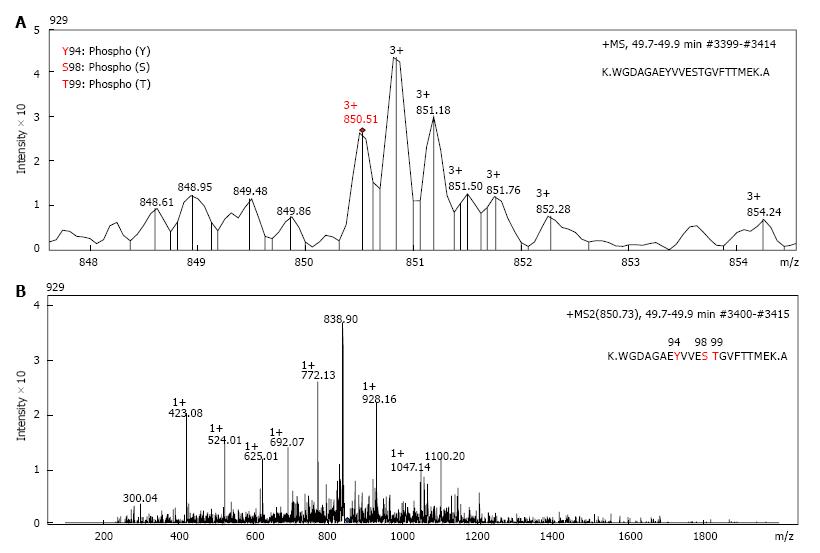
Figure 2 The tandem mass spectrometry (MS/MS) profile of glyceraldehyde 3-phosphate dehydrogenase peptides.
Proteomics characterization of a basic GAPDH isoform (spot 1 from Figure 1B) from the cytosolic fraction of A549 cells by mass spectroscopy. A: Spectrum profile of the precursor ion 850.51 m/z (MS 1) selected for further fragmentation; B: Spectrum profile of the fragmentation ions (MS 2) of the peak 850.51 m/z from panel A. Retention time and number of scans where the peptide was detected are shown in the right top part of each panel. GAPDH: Glyceraldehyde 3-phosphate. dehydrogenase.
Figure 3 Phospho-T99-glyceraldehyde 3-phosphate dehydrogenase was detected in nuclei of A549 cells after genotoxic stress.
A: 2D gel analysis of the cytosolic fraction extracted from A549 cells. Only a section of the membrane containing GAPDH isoforms is shown. Membranes were developed with anti-GAPDH antibody or anti-phospho-T99-GAPDH antibody in untreated and araC-treated cells. pH gradient is indicated under the bottom image; B: The nuclear fraction from A549 cells after treatment with araC. Only a section of the membrane containing GAPDH isoforms is shown. Membranes were developed with anti-GAPDH antibody (top image) or anti-phosphoT99-GAPDH antibody (bottom image). pH gradient is indicated under the bottom image. GAPDH: Glyceraldehyde 3-phosphate dehydrogenase; 2D: Two dimensional.
Figure 4 Kinetic analysis of wild type and mutated forms of Hisx6-tagged glyceraldehyde 3-phosphate dehydrogenase prepared in BL21 (DE3) Escherichia coli expression system.
Conditions for the glycolytic assay are indicated in “Materials and Methods”. A: Reaction was performed with 0.26 mmol/L NAD+ and varying concentrations of D-glyceraldehyde-3-phosphate (0-2 mmol/L); B: Reaction was performed with 0.51 mmol/L D-glyceraldehyde-3-phosphate and varying concentrations of NAD+ (0-2 mmol/L). Vmax and Km were calculated by non-linear regression analysis with GraphPad Prizm 4.0 as described in Materials and Methods. GAPDH: Glyceraldehyde 3-phosphate dehydrogenase.
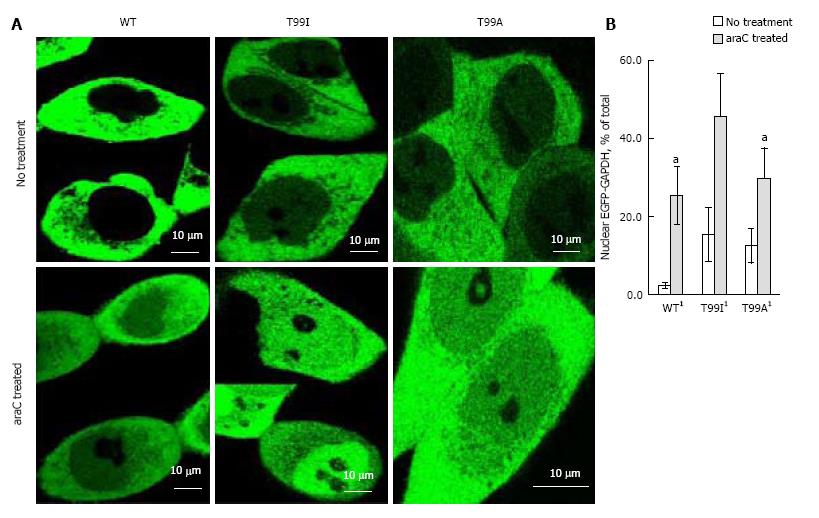
Figure 5 Nuclear accumulation of wild type and mutated enhanced green fluorescent protein-glyceraldehyde 3-phosphate dehydrogenase in live HCT116-4016 cells after transient transfections with plasmids coding for enhanced green fluorescent protein fusions with WT-glyceraldehyde 3-phosphate dehydrogenase, T99I-glyceraldehyde 3-phosphate dehydrogenase, and T99A-glyceraldehyde 3-phosphate dehydrogenase polypeptides.
A: Distribution of EGFP-GAPDH variants in HCT116-4016 cells before (upper images) and after (lower images) treatment with 1 µmol/L araC for 24 h; B: Quantitative analysis of images shown in A was performed using ImageJ 1.48 v software (NIH, United States). For statistical evaluation, pixel analysis of 20-25 cells was performed for each experiment (mean ± SE). 1Significant (P < 0.03) alteration in nuclear GFP-GAPDH between cells treated with araC and untreated cells. EGFP: Enhanced green fluorescent protein; GAPDH: Glyceraldehyde 3-phosphate dehydrogenase; GFP: Green fluorescent protein.
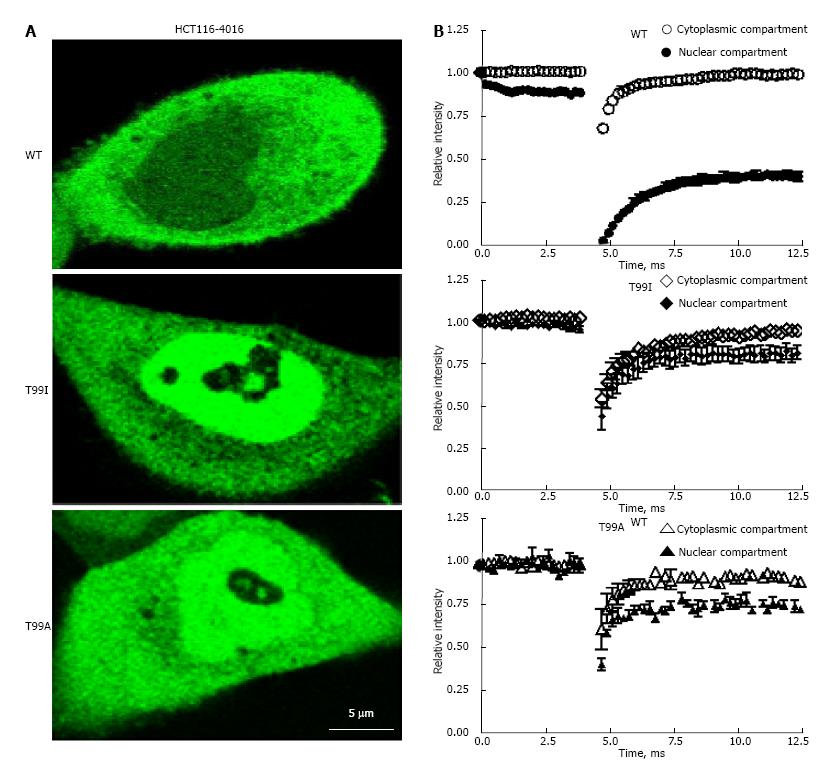
Figure 6 Intranuclear mobility of wild type and mutated variants of enhanced green fluorescent protein-glyceraldehyde 3-phosphate dehydrogenase in HCT116-4016 cells after genotoxic stress.
A: FRAP analysis of fluorescent fusion protein EGFP-GAPDH in subcellular compartments of HCT116-4016 cells. Confocal images were collected from transfected cells expressing WT-EGFP-GAPDH (WT), EGFP-GAPDH-T99I (T99I), and EGFP-GAPDH-T99A (T99A) after treatment with 1 μmol/L araC for 24 h; B: Recovery rate of wild type and mutant EGFP-GAPDH fusion proteins after photo bleaching. Open symbols, cytoplasmic compartment, and closed symbols, nuclear compartment. The dynamic parameters mobile fraction (1-Mf), half-time of equilibration t(1/2) (s), and diffusion coefficients D were calculated from FRAP experiments, as described in “Materials and Methods” and summarized in Table 3. Where not seen, the error bars are smaller than the data point symbols. EGFP: Enhanced green fluorescent protein; GAPDH: Glyceraldehyde 3-phosphate dehydrogenase; GFP: Green fluorescent protein; FRAP: Fluorescence recovery after photobleaching.
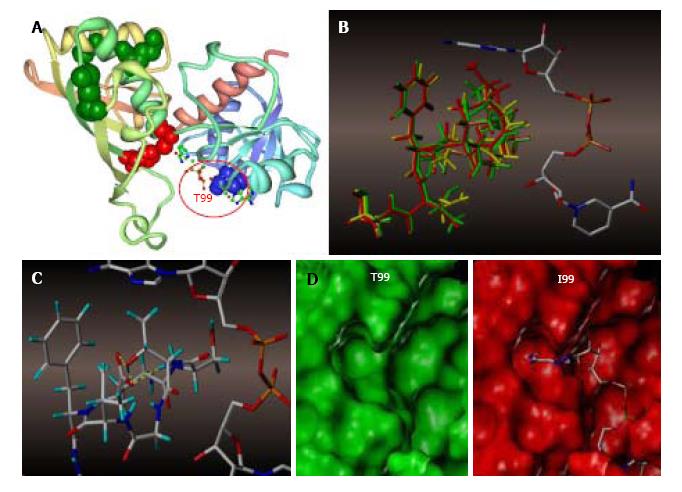
Figure 7 Molecular modeling of NAD+ binding site in human glyceraldehyde 3-phosphate dehydrogenase.
A: NAD+ binding site within a GAPDH polypeptide (circled). Only one of four GAPDH subunits is shown. T99 is shown as a space-filled amino acid; B: The results of the trajectory calculations, with the average structure for each simulation shown overlaid for T99 (green), A99 (yellow), and I99 (red), along with the NAD+ molecule bound in the active cleft. Isoleucine side chain (red) of the T99I polypeptide acquires the closest position relative to the purine ring; C: In the native T99, an intramolecular H-bond between T99 and E97 (highlighted yellow) is likely to exist which holds the loop in a restricted conformation. This hydrogen bond could be a stabilizing factor permitting NAD+ to fully occupy the upper region of the cleft; D: Side-by-side comparison of T99 (green) and I99 (red) NAD+ binding site surfaces. In I99, the average structure places the terminus of the side chain well within the Van der Waals radii of the adenine ring of NAD+, thereby displacing or blocking the cofactor from its initial association with GAPDH. GAPDH: Glyceraldehyde 3-phosphate dehydrogenase.
- Citation: Phadke M, Krynetskaia N, Mishra A, Barrero C, Merali S, Gothe SA, Krynetskiy E. Disruption of NAD+ binding site in glyceraldehyde 3-phosphate dehydrogenase affects its intranuclear interactions. World J Biol Chem 2015; 6(4): 366-378
- URL: https://www.wjgnet.com/1949-8454/full/v6/i4/366.htm
- DOI: https://dx.doi.org/10.4331/wjbc.v6.i4.366


