Copyright
©The Author(s) 2015.
World J Biol Chem. Aug 26, 2015; 6(3): 249-264
Published online Aug 26, 2015. doi: 10.4331/wjbc.v6.i3.249
Published online Aug 26, 2015. doi: 10.4331/wjbc.v6.i3.249
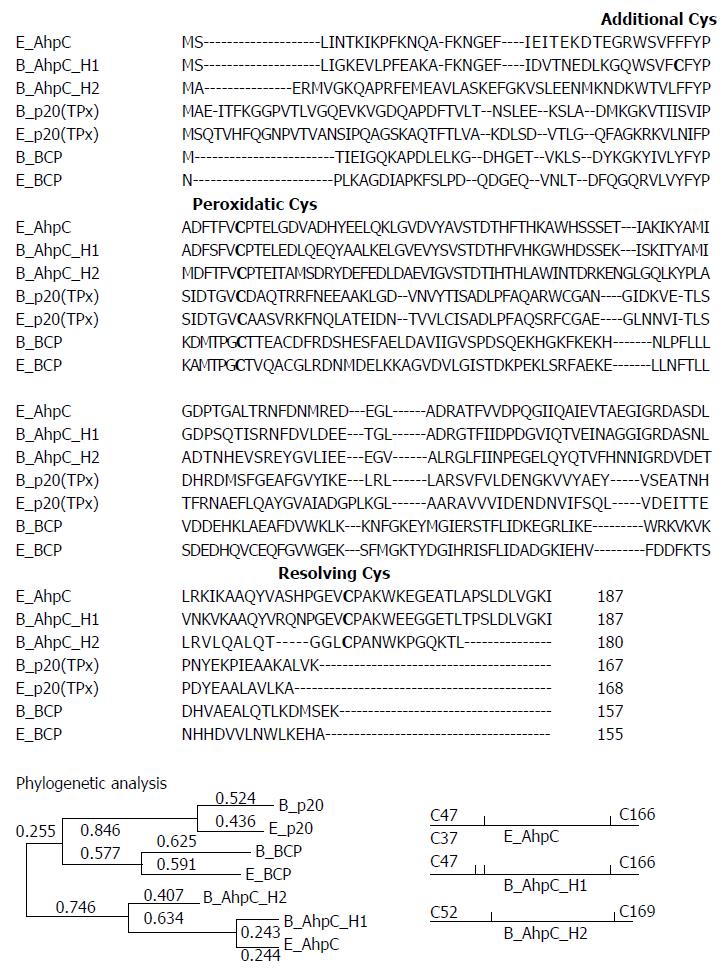
Figure 1 Amino acid sequence alignment of Bacillus subtilis and Escherichia coli peroxiredoxins.
B. subtilis database was searched using amino acid sequences around conserved N-terminal Cys residues as a query. In addition to reported bacterial genes encoding BCP and TPx enzymes, two putative AhpC-encoding genes were identified, and four B. subtilis and three E. coli Prx sequences were aligned. The two conserved Cys residues, N-terminal peroxidatic and C-terminal resolving Cys, among the AhpC proteins are shown as shaded bold letters. Proteins homologous to E. coli AhpC were identified using the ClustalW 2.1 multiple sequence alignment. The phylogenetic tree was generated by using MEGA version 6 The tree is drawn to scale, with branch lengths measured in the number of substitutions per site (next to the branches). The analysis involved 7 amino acid sequences. All positions containing gaps and missing data were eliminated. There were a total of 143 positions in the final dataset. Position of Cys residues in AhpC proteins is shown at the bottom right panel. E_BCP, E. coli BCP (accession number AAC75533); E_p20 (TPx), E. coli TPx (accession number EDV68400); E_AhpC, E. coli AhpC (accession NP_415138); B_ahpC_H1, B. subtilis AhpC homolog 1 (accession number BAA11268); B_AhpC_H2, B. subtilis AhpC homolog 2 (accession number WP_019258276); B_BCP, B. subtilis BCP (accession number AAC75533); and B_p20 (TPx), B. subtilis TPx (accession NP_390827).
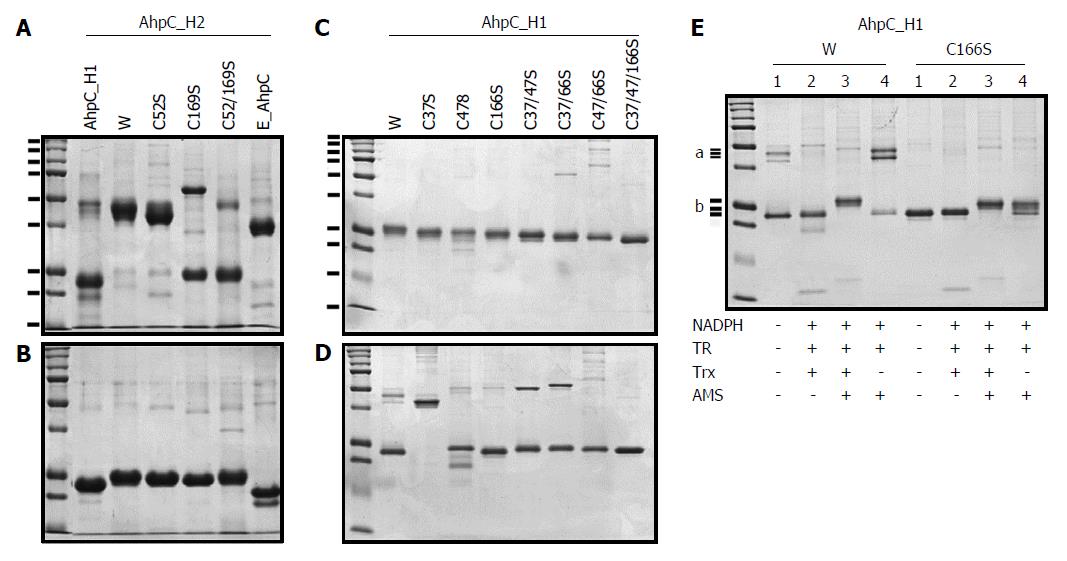
Figure 2 SDS-PAGE analyses of AhpC_H1 and AhpC_H2 proteins and their mutants carrying Cys→Ser substitutions.
The wild-type (lane W) and mutated AhpC_H2 and AhpC_H1, and E. coli AhpC proteins were separated in non-reducing (A) and reducing (B) 12% SDS-PAGE gels; first lanes show molecular weight markers (15, 20, 25, 37, 50, 75, 100, 150, and 250 kDa). TCEP/AMS-treated (C) and non-treated (D) wild-type (lane W) and mutated AhpC_H1 proteins were separated in non-reducing 14% SDS-PAGE gels. AhpC_H1 and its C166S mutant reduced or not with the Trx system containing Trx 1, Trx reductase (TR), and NADPH were modified with a sulfhydryl group-specific reagent AMS and separated in non-reducing 14% SDS-PAGE gels (E). a marks the position of a single AhpC_H1 band (W, lane 1) and double bands (W, lane 4). b marks three positions of the AhpC_H1 band after the treatments indicated at the bottom. First lanes in B1, B2, and C show molecular weight markers (10, 15, 20, 25, 37, 50, 75, 100, 150, 250 kDa).
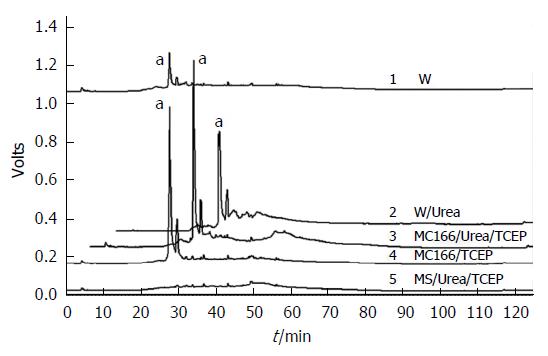
Figure 3 Reversed-phase high-performance liquid chromatography analysis of fluorescently labeled trypsin-digested AhpC_H1.
AhpC_H1 was modified with sulfhydryl-reactive DyLight 405 maleimide, digested with TPCK-treated trypsin in the presence or absence of 2 M urea, and analyzed by reversed-phase HPLC; fluorescence was monitored at 527 nm. Fluorescent peak (a) corresponds to a peptide containing free Cys residue conjugated with the fluorescent dye. W: Wild-type AhpC_H1; MC166: C37/47S double mutant; MS: Cys37/47/166S triple mutant.
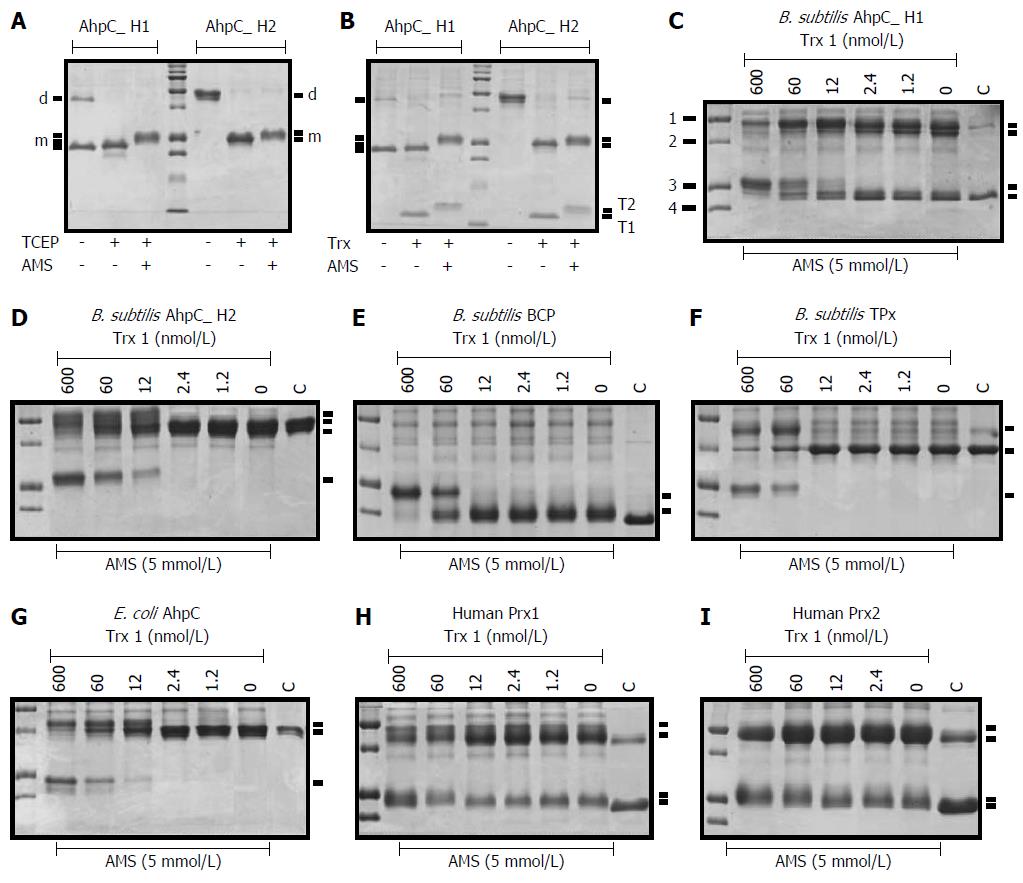
Figure 4 Non-reducing SDS-PAGE of peroxiredoxins reduced with the Trx system.
(A, B) AhpC_H1 and AhpC H2 were incubated without or with 2 mnol/L TCEP (A) or Trx system (B) for 30 min at 30 °C, followed by incubation with AMS for 30 min at 30 °C. The reaction was terminated by adding SDS sample buffer, and proteins were separated in 16% non-reducing SDS-PAGE gels. Protein migration pattern in A is the same as in B, suggesting that the Trx system reduced disulfide bonds in both proteins; d and m mark the position of dimeric and monomeric, respectively, AhpC_H1 and AhpC_H2. T1 and T2 denote the oxidized and reduced/modified Trx 1 proteins, respectively. Middle lanes show molecular weight markers (10, 15, 20, 25, 37, 50, 75, 100, 150, and 250 kDa). Trx, the Trx system; (C-F) Conversion of different Prxs from the oxidized to reduced form by the Trx system. 1, 2, 3, and 4 indicate molecular weight markers of 50, 37, 25, and 20 kDa, respectively.
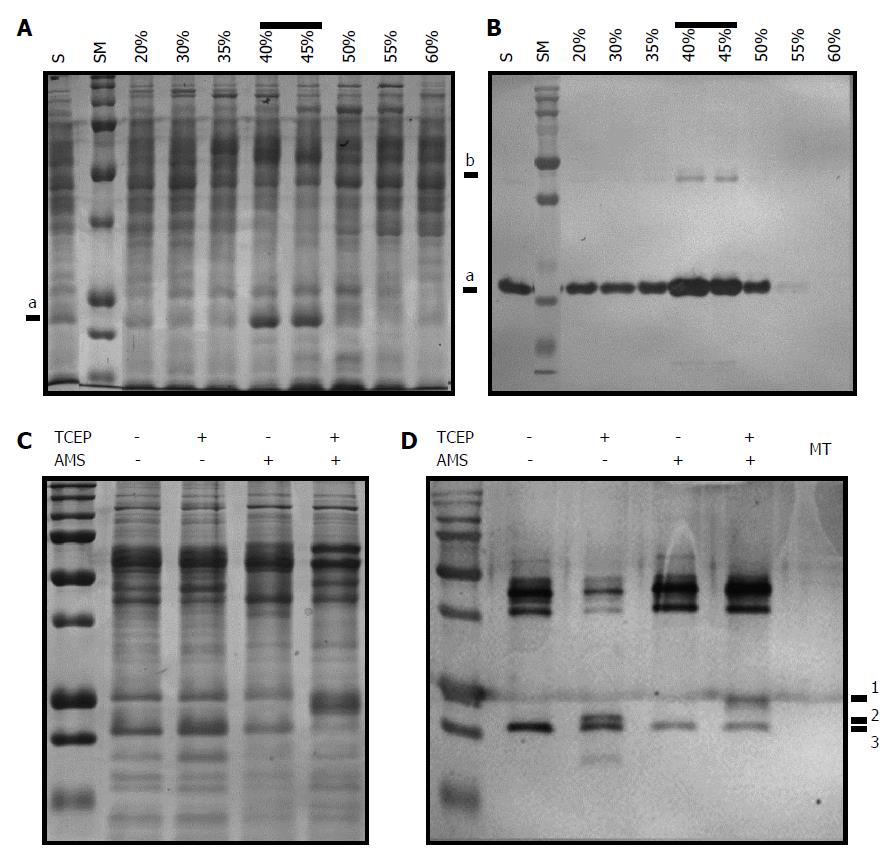
Figure 5 Identification of intramolecular disulfide linkage in AhpC_H1 from B.
subtilis. A, B: Soluble fraction of B. subtilis overnight cultures was precipitated with 30%, 35%, 40%, 45%, 50%, 55%, and 60% ammonium sulfate. After dialysis of solubilized precipitates, 20 μg of each fraction was separated in 14% reducing SDS-PAGE gel, and stained with Coomassie brilliant blue (A) or processed by western blotting using anti-AhpC_H1 antibody (for western blotting, 1 μg protein was separated). Correlation of band intensities in (A) and (B) indicates that the major band marked as a is an AhpC_H1 monomer; b marks an AhpC_H1 dimer; C: Proteins (20 μg) of the 40% fraction were incubated in the presence or absence of 2 mM TCEP, reacted with 5 mmol/L of AMS for 30 min at 30 °C, separated by non-reducing SDS-PAGE, and stained with Coomassie Brilliant Blue; D: Similarly treated proteins (100 ng) were subjected to western blotting. Triple bands (1, 2, and 3) around the position of the monomer indicate AMS modification of Сys residues after the reduction by TCEP. MT, AhpC_H1-deficient B. subtilis; the absence of the AhpC_H1 band indicates antibody specificity. SM, molecular weight markers (15, 20, 25, 37, 50, 75, 100, 150, 250 kDa).
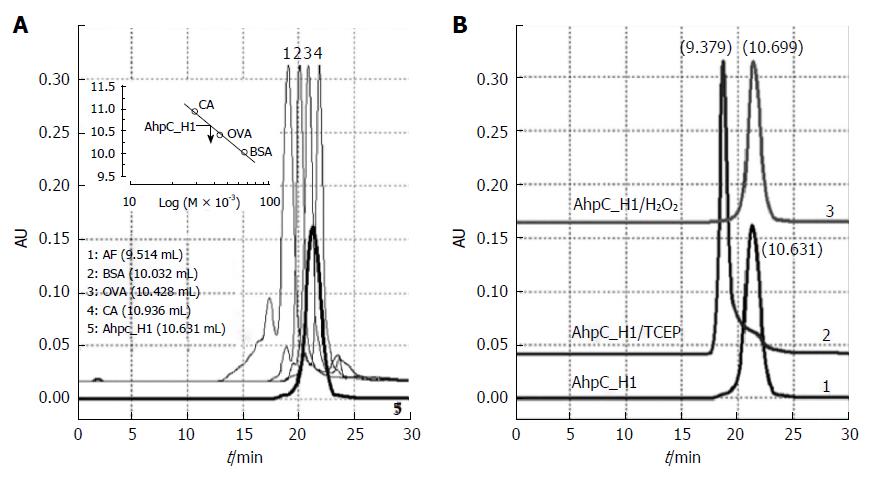
Figure 6 High-performance liquid chromatography gel-filtration chromatograms of AhpC_H1 purified from B.
subtilis. AhpC_H1 was loaded onto a ZORBAX® Pro 10/300 GF450 column and eluted with 50 mmol/L phosphate buffer, pH 7.4, containing 150 mmol/L KCl. A: AhpC_H1 elution profile (bold line, 5); protein molecular mass standards: 1, apoferritin (AF, 443 kDa); 2, bovine serum albumin (BSA, 66 kDa); 3, ovalbumin (OVA, 44 kDa); 4, carbonic anhydrase (CA, 29 kDa). Inset shows a calibration curve used to determine AhpC_H1 molecular mass; B: The profiles of TCEP-reduced AhpC_H1 (AhpC_H1/TCEP) and AhpC_H1 treated with 2 mmol/L H2O2 for 30 min at 30 °C (AhpC_H1/H2O2) were compared with that of untreated AhpC_H1. Elution volume (mL) is in parentheses. Oligomeric AhpC_H1 was eluted at 9.379 mL.
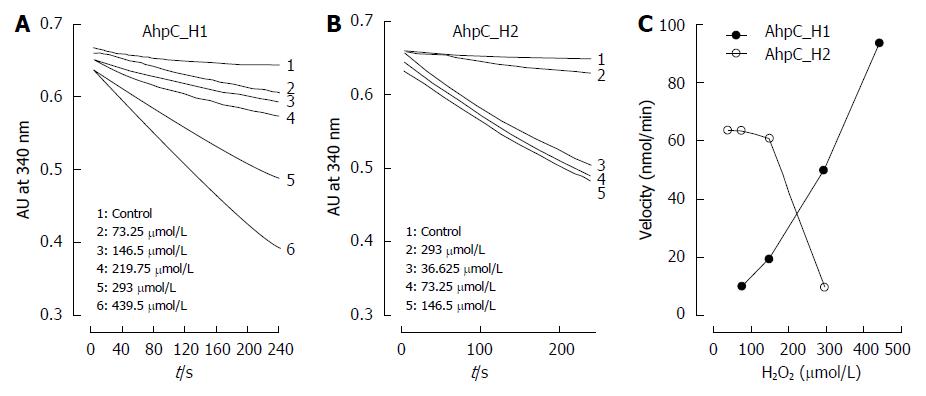
Figure 7 Susceptibility of AhpC_H1 with AhpC_H2 to inactivation by hydrogen peroxide.
Peroxidase activity of AhpC_H1 (A) and AhpC_H2 (B) was continuously monitored by the decrease in 340-nm absorbance due to NADPH oxidation at 25 °C in the presence of 50 mmol/L of Hepes-NaOH buffer, pH 7.4, containing 1 mmol/L EDTA, 100 nmol/L of E. coli Trx reductase, 0.14 mmol/L of NADPH, 5 μmol/L of E. coli Trx, 2 μmol/L of AhpC_H1 and AhpC_H2 and varying concentrations of H2O2. Control, absorbance without H2O2; C: Changes in initial peroxidase activity rate depending on H2O2 concentration. AhpC_H1 was resistant, while AhpC_H2 was sensitive to inactivation by H2O2.
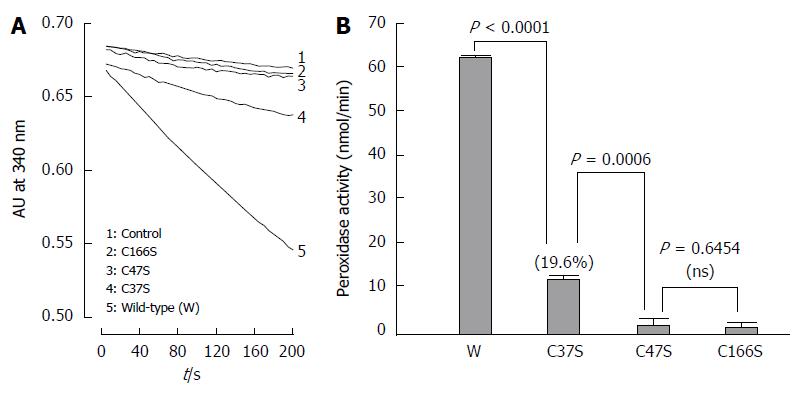
Figure 8 Trx system-supported alkyl hydroperoxide peroxidase activity of the wild-type and mutant AhpC_H1 proteins.
A: Peroxidase reaction was initiated by adding 2 μmol/L of the wild-type (W) or C37S, C47S, and C166S mutated AhpC_H1 enzymes to the reaction mixture containing 50 mmol/L Hepes-NaOH, pH 7.4, 1 mmol/L EDTA, 100 nmol/L of E. coli Trx reductase, 5 μmol/L of E. coli Trx, and 0.14 mM NADPH; the activity was continuously monitored by the decrease in 340-nm absorbance at 25 °C; B: Initial peroxidase activity rate of the wild-type and mutant AhpC_H1. The data are expressed as the mean ± standard error of three independent measurements.
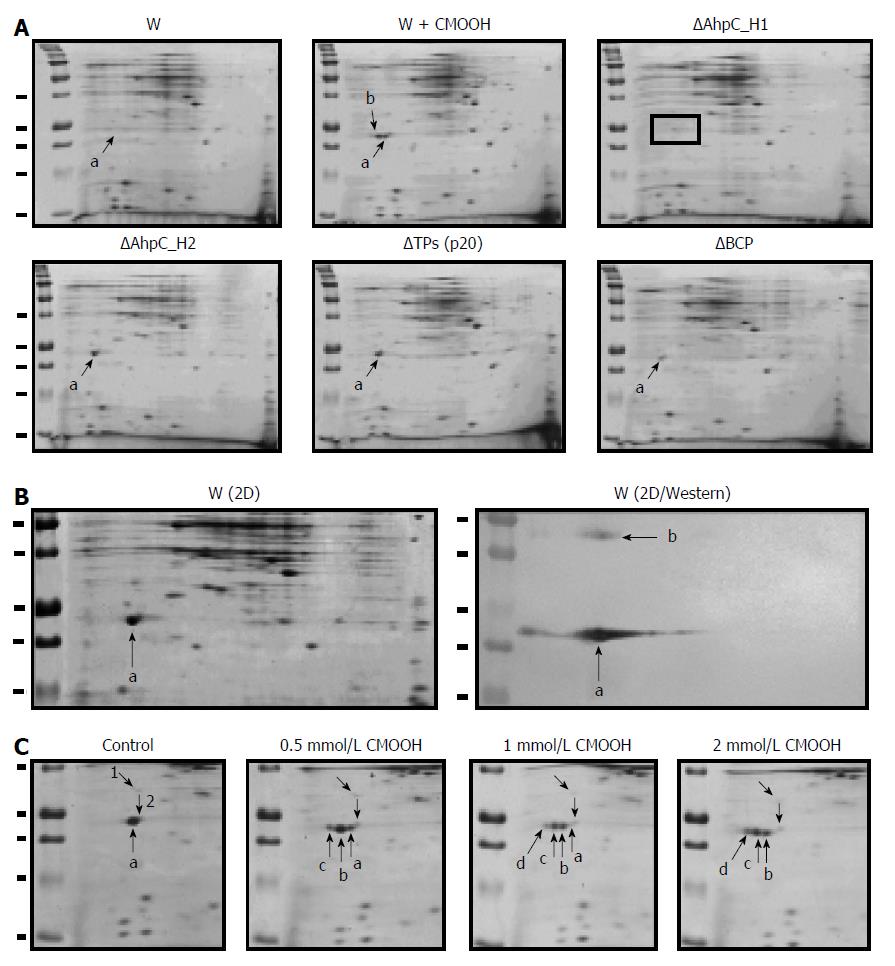
Figure 9 Expression of peroxiredoxins in the wild-type and Prx-deficient B.
subtilis strains. A: Two-dimensional (2D) electrophoresis of soluble proteins from untreated (W) and cumene hydroperoxide (CMOOH)-treated (W + CMOOH) wild-type B. subtilis, and Prx-null mutant strains. Soluble protein fraction (20 μg) obtained from exponential B. subtilis cultures treated with or without 1 mM CMOOH for 30 min was separated in 2D gels and analyzed for AhpC_H1 expression after staining with Coomassie Brilliant Blue. a indicates AhpC_H1; b indicates AhpC_H1 shift to acidic area; in AhpC_H1 deletion mutant (ΔAhpC_H1), AhpC_H1-specific signal is absent; B: B. subtilis was grown and treated as in (A), and soluble proteins (1 μg) were separated by 2D electrophoresis and stained with Coomassie Brilliant Blue (W/2D) or analyzed by western blotting using polyclonal antibodies against AhpC_H1 (2D/Western); a and b indicate the position of AhpC_H1 monomeric and dimeric forms, respectively; C: B. subtilis cultures were grown as in (A), treated with the indicated concentrations of CMOOH for 30 min, and soluble proteins were separated by 2D electrophoresis followed by Coomassie Brilliant Blue staining. a, indicates original and b, c, and d indicate oxidized AhpC_H1 proteins; 1 and 2 denote internal standards. 2D electrophoresis was performed using 4-7 pH gradients (left to right); molecular weight markers (50, 37, 25, 20, and 15 kDa) are shown in the left lines.
Figure 10 Effects of various oxidants on AhpC_H1 expression in B.
subtilis. Exponentially grown bacterial cultures were treated with indicated concentrations of H2O2, t-butyl hydroperoxide (tBOOH), cumene hydroperoxide (CMOOH), paraquat (PQ), and diamide for 45 min at 30 °C. Soluble proteins (5 μγ) were separated in 14% reducing SDS-PAGE gels, transferred to nitrocellulose membrane, and reacted with the polyclonal AhpC_H1 antibody. C0 and C45min indicate untreated B. subtilis at time 0 and after 45-min growth, respectively. SM, molecular weight markers (15, 20, 25, 37, 50, 75, 100, and 150 kDa).
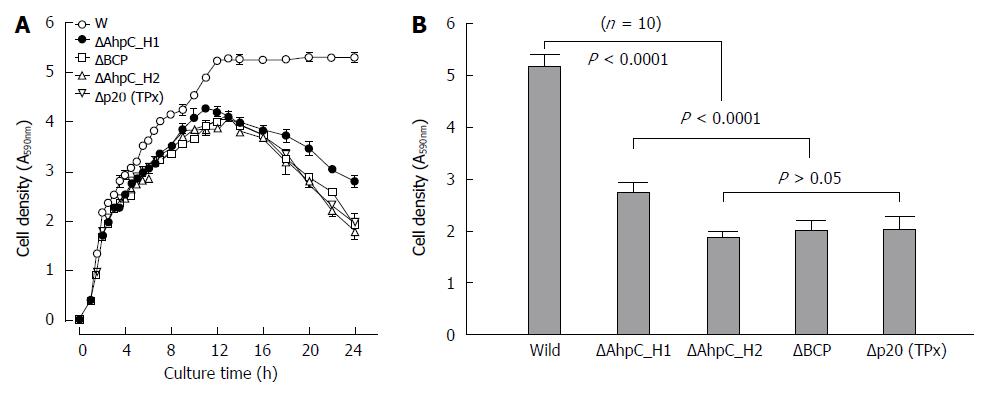
Figure 11 Growth of the wild-type and Prx-deficient ΔAhpC_H1, ΔAhpC_H2, ΔB_BCP, and ΔB_TPx B.
subtilis strains. A: Bacterial growth was monitored by the optical density at 600 nm (OD600) for up to 25 h after addition of the same cell density of exponentially grown culture in aerobic condition; the data are expressed as the mean ± standard error of five independent measurements; B: The growth the wild-type and Prx-deficient B. subtilis strains after 1 d of culture. The data are expressed as the mean ± standard deviation of 10 independent measurements.
-
Citation: Cha MK, Bae YJ, Kim KJ, Park BJ, Kim IH. Characterization of two alkyl hydroperoxide reductase C homologs alkyl hydroperoxide reductase C_H1 and alkyl hydroperoxide reductase C_H2 in
Bacillus subtilis . World J Biol Chem 2015; 6(3): 249-264 - URL: https://www.wjgnet.com/1949-8454/full/v6/i3/249.htm
- DOI: https://dx.doi.org/10.4331/wjbc.v6.i3.249


