Copyright
©The Author(s) 2015.
World J Biol Chem. Aug 26, 2015; 6(3): 121-138
Published online Aug 26, 2015. doi: 10.4331/wjbc.v6.i3.121
Published online Aug 26, 2015. doi: 10.4331/wjbc.v6.i3.121
Figure 1 Palatogenesis in mice.
Hematoxylin and eosin staining of coronal sections of the head of a wild-type mouse at embryonic day (E) 12.5 (A), E13.5 (B), and E14.5 (C, D). A: Mouse palatal shelves (p) develop from the maxillary prominences; B: By E13.5, the palatal shelves grow downward on each side of the tongue (t); C and D: At E14.5, the palatal shelves face each other along the midline above the tongue and fuse, separating the oral cavity (oc) from the nasal cavity (nc). The arrow in (D) indicates the medial edge epithelial (MEE) cells that constitute the midline epithelial seam. All animal experimental procedures were reviewed and approved by the Institutional Animal Care and Use Committees of the University of Texas Southwestern Medical Center and Tokyo Medical and Dental University. mes: Mesenchyme; epi: Epithelium.
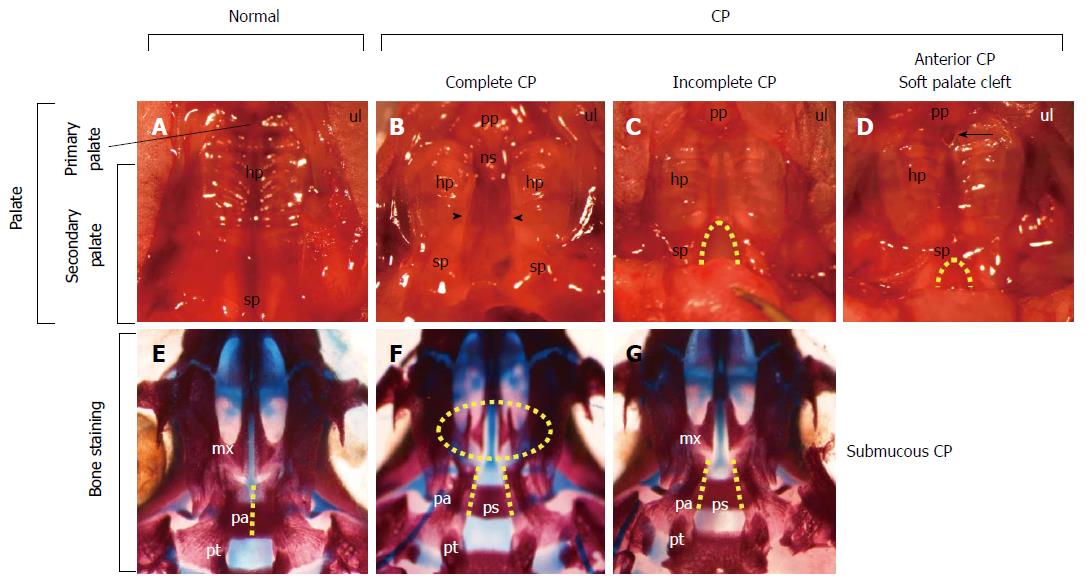
Figure 2 View of the palate from wild-type and Tbx1-/- mice with cleft palates.
A-D: Ventral view of the maxilla of newborn wild-type (A) and Tbx1-/- mice with cleft palates (B-D). The palate consists of the primary palate (pp) and the secondary palate (sp), which consists of a hard palate (hp) and a soft palate (sp) (A). Tbx1-/- mice show complete cleft palate (CP) (arrowheads in B), incomplete CP (dashed line in C), and soft palate clefts associated with anterior CP (dashed line in D). An anterior CP (an arrow in D) is present at the junction between the primary palate and secondary palate, while the posterior palate remains fused; E-G: Ventral view of the cranial base of newborn wild-type (E) and Tbx1-/- mice (F, G) stained with alizarin red for mineralized bone and alcian blue for cartilage. Fusion of the bilateral palatal bones (pa) observed in the wild-type (dashed line in E) is absent in Tbx1-/- mice (dashed lines in F, G). The palatal shelves in the maxilla (mx) of Tbx1-/- mice with complete CP (oval dashed line in F) failed to grow toward the midline. Note the visible presphenoid bone (ps) associated with CP (F, G). Modified and used with permission from Funato et al[4]. ns: Nasal septum; pt: Pterygoid bone.
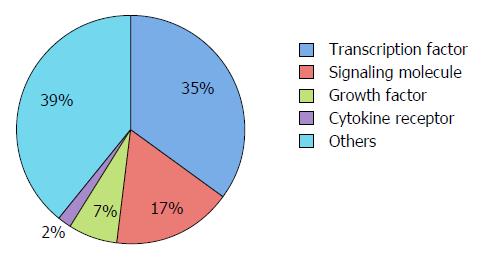
Figure 3 Gene ontology analysis of genes associated with cleft palate in mice.
Gene ontology analysis of genes associated with cleft palate in mice was performed using the PANTHER classification system (http://pantherdb.org). The most significantly enriched molecular function was the “transcription factor” (P = 1.2 × 10⁻¹²). A P value less than 0.05 was considered statistically significant.
- Citation: Funato N, Nakamura M, Yanagisawa H. Molecular basis of cleft palates in mice. World J Biol Chem 2015; 6(3): 121-138
- URL: https://www.wjgnet.com/1949-8454/full/v6/i3/121.htm
- DOI: https://dx.doi.org/10.4331/wjbc.v6.i3.121


