Copyright
©2014 Baishideng Publishing Group Inc.
World J Biol Chem. Aug 26, 2014; 5(3): 387-397
Published online Aug 26, 2014. doi: 10.4331/wjbc.v5.i3.387
Published online Aug 26, 2014. doi: 10.4331/wjbc.v5.i3.387
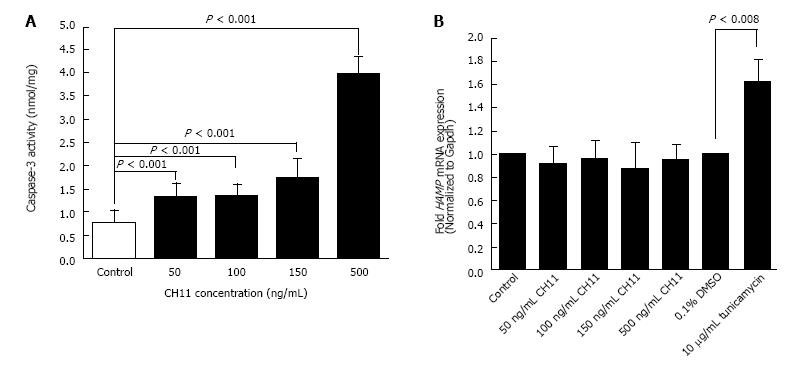
Figure 1 Caspase-3 activity and human hepcidin gene (HAMP) expression: HepG2 cells were treated with 50, 100, 150 and 500 ng/mL of CH11 antibody or solvent (control) for 12 h.
A: Induction of apoptosis was confirmed by measuring caspase-3 activity, as described in the ‘Materials and Methods’ section. Caspase-3 activity was expressed as nanomole of flurogenic substrate cleaved per milligram of cell lysate protein; B: cDNA, synthesized from RNA isolated from CH11-treated, tunicamycin-treated and respective solvent-treated cells, was employed as a template in Taqman qPCR assays to determine HAMP mRNA expression, as described in Methods. HAMP expression in CH11-treated cells was expressed as fold expression of that in control cells.
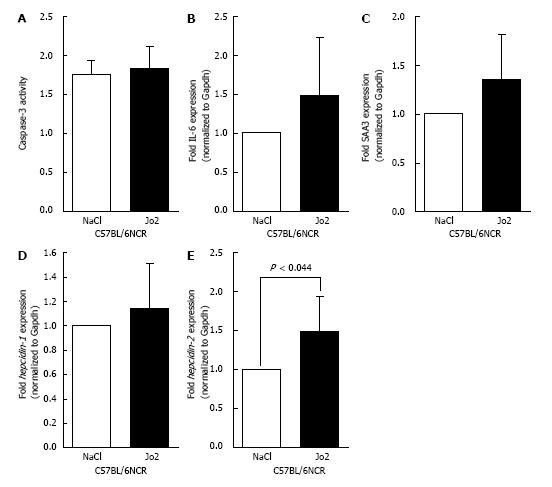
Figure 2 Caspase-3 activity, the expression of acute phase response and mouse hepcidin genes in the liver: C57BL/6NCR strain male mice, which were injected with Jo2 antibody (0.
2 µg/g b.w.) or saline (as control), were sacrificed 1 h later. A: Caspase-3 activity was measured, as described in the ‘Materials and Methods’ section. B-E: IL-6 (B), SAA3 (C), hepcidin-1 (D) and hepcidin-2 (E) gene expression was determined by qPCR, and mRNA expression in Jo2-treated mice expressed as fold change of that in control mice.
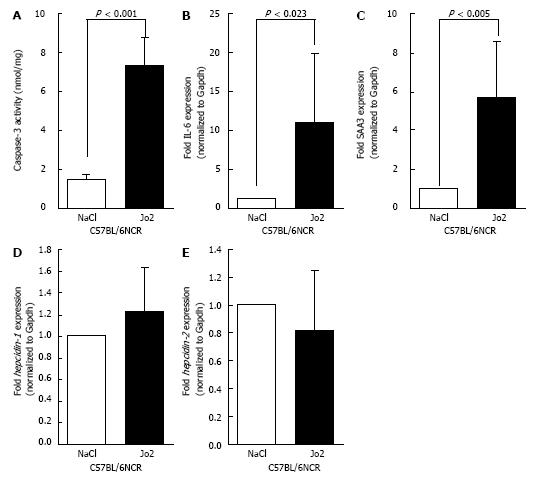
Figure 3 The effect of longer Jo2 treatment on the level of apoptosis, acute phase response and hepcidin gene expression: C57BL/6NCR male mice, which were injected with Jo2 (0.
2 μg/g b.w.) or saline (control), were sacrificed 6 h later. A-C: Cell lysates and RNA isolated from the livers were employed in caspase-3 assays (A) or to synthesize cDNA as a template for SYB green qPCR assays to determine IL-6 (B) or SAA3 (C) gene expression; D, E: Hepcidin-1 (D) and hepcidin-2 (E) mRNA expression was determined by Taqman qPCR. Gene expression in Jo2-injected mice was expressed as fold change of that in control mice.
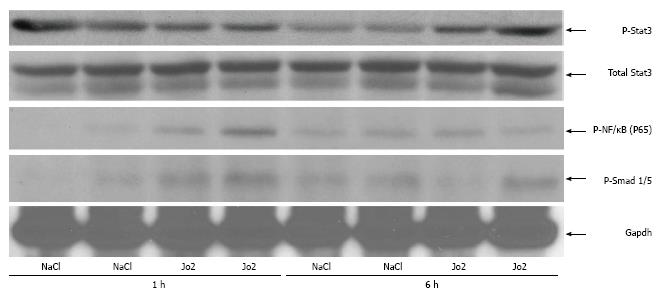
Figure 4 Phosphorylation of Stat3, NF-κB (P65) and Smad 1/5 in the liver.
Whole cell lysates prepared from the livers of C57BL/6NCR mice injected with Jo2 (0.2 μg/g b.w.) and sacrificed after 1 or 6 h were employed for western blotting using anti-phospho--Stat3 (P-Stat3), anti-total Stat3, anti-phospho-P65 (P65) and anti-phospho-Smad1/5 antibodies, as described in Material and Methods. Anti-Gapdh antibody was used as protein loading control.
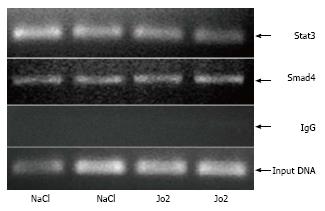
Figure 5 Chromatin immunoprecipitation assays.
The binding of Stat3 or Smad4 to the hepcidin-1 promoter in the livers of C57BL/6NCR mice, which were injected with Jo2 (0.2 μg/g b.w.) or saline (control) and sacrificed 6 h later, was determined by ChIP assays, as described in Material and Methods. Total input DNA was used as control to evaluate the amount of chromatin.
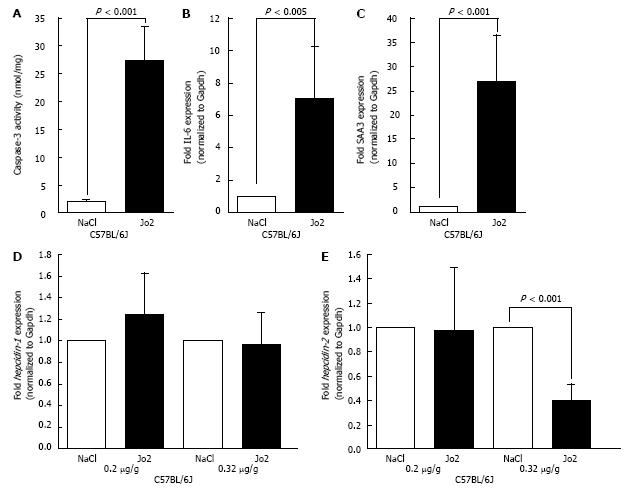
Figure 6 The effect of Jo2 on apoptosis, acute phase response and hepcidin gene expression in C57BL/6J mice.
C57BL/6J male mice (n = 21) were injected with 0.2 μg/g b.w. and 0.32 μg/g b.w. Jo2 or saline and sacrificed 6 h later. Cell lysates and RNA isolated from the livers were employed in caspase-3 assays (A) or to synthesize cDNA as a template for SYB green qPCR assays to determine IL-6 (B) or SAA3 (C) gene expression. Hepcidin-1 (D) and hepcidin-2 (E) mRNA expression was determined by Taqman qPCR. Gene expression in Jo-2 injected mice was expressed as fold change of that in control mice.
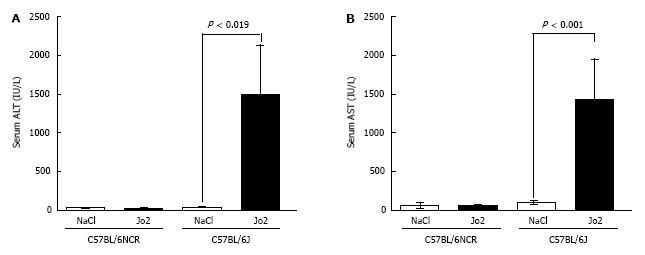
Figure 7 Comparison of serum liver enzyme levels in Jo2-injected C57BL/6J and C57BL/6NCR mice.
Mice injected with Jo2 (0.2 μg/g b.w.) were sacrificed 6 h later. Serum ALT (A) and AST (B) enzymes were measured, as described in “Materials and Methods”.
- Citation: Lu S, Zmijewski E, Gollan J, Harrison-Findik DD. Apoptosis induced by Fas signaling does not alter hepatic hepcidin expression. World J Biol Chem 2014; 5(3): 387-397
- URL: https://www.wjgnet.com/1949-8454/full/v5/i3/387.htm
- DOI: https://dx.doi.org/10.4331/wjbc.v5.i3.387


