Copyright
©2014 Baishideng Publishing Group Inc.
World J Biol Chem. Aug 26, 2014; 5(3): 377-386
Published online Aug 26, 2014. doi: 10.4331/wjbc.v5.i3.377
Published online Aug 26, 2014. doi: 10.4331/wjbc.v5.i3.377
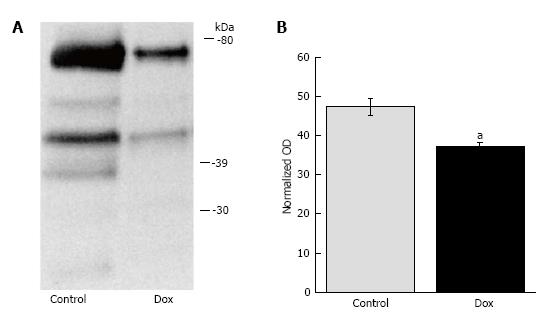
Figure 1 Proteome lysine acetylation status.
A: Representative Western blot showing doxorubicin (Dox)-induced proteome lysine deacetylation; B: Graphical representation of OD units determined by whole lane analysis and normalized to Ponceau staining. aP < 0.050, control vs Dox.
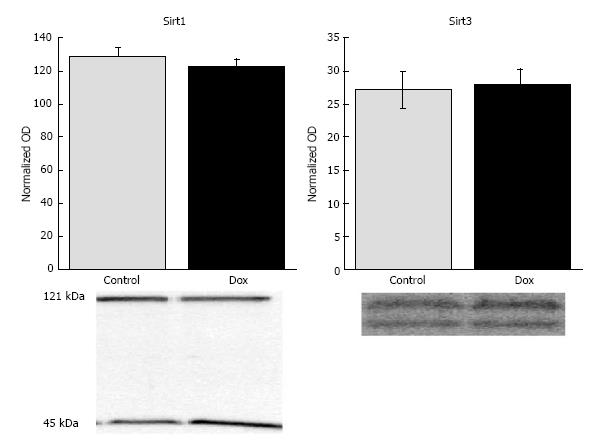
Figure 2 Protein content of Sirt1 and Sirt3.
Doxorubicin (Dox) did not affect the expression of Sirt1 or Sirt 3 in liver of treated animals. Representative Western blot shows 120 kDa Sirt1. A 45 kDa species detected by the Sirt1 antibody is also shown. Sirt: Sirtuin.
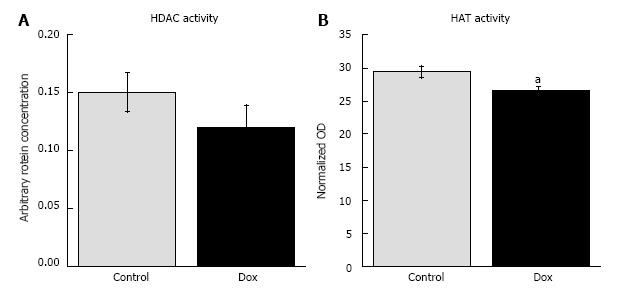
Figure 3 Histone deacetylase and histone acetyltransferase activity.
A: Conventional histone deacetylase (HDAC) activity was not affected by doxorubicin (Dox) treatment; B: Dox decreased hepatic histone acetyltransferase (HAT) activity. aP < 0.050, 0.209 ± 0.006 vs 0.189 ± 0.004.
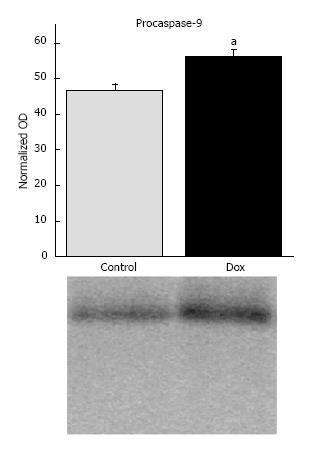
Figure 4 Protein content of procaspase-9.
Doxorubicin (Dox) increased the hepatic expression of procaspase-9. Representative Western blots show the band corresponding to procaspase-9; no bands of lower molecular weight representing cleavage products were present. aP < 0.050, control vs Dox.
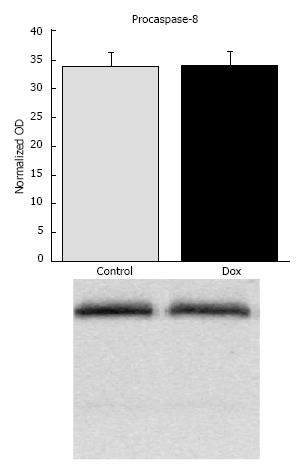
Figure 5 Protein content of procaspase-8.
Doxorubicin (Dox) did not affect hepatic content of procaspase-8. Furthermore, there was no difference in the presence of lower molecular weight bands between treatment groups.
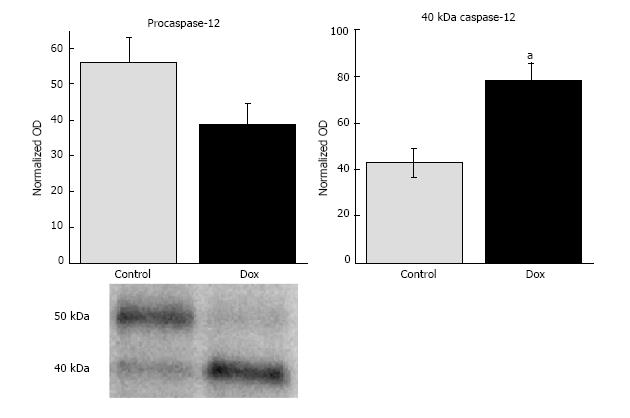
Figure 6 Protein content of procaspase-12 and 40 kDa cleavage product.
Doxorubicin (Dox) treatment did not significantly affect the hepatic content of procaspase-12. However, Dox did induce activation of caspase-12 leading to increased content of the 40 kDa cleavage product. Representative Western blot shows the 50 kDa procaspase-12 and the 40 kDa cleaved product. aP < 0.050, Dox vs control.
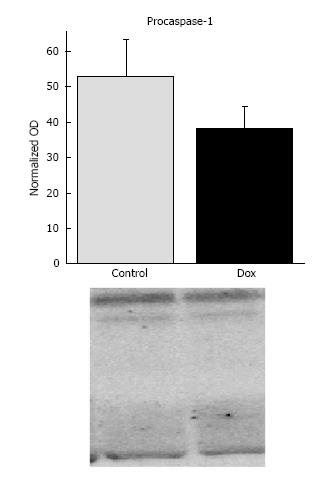
Figure 7 Protein content of procaspase-1.
Doxorubicin (Dox) treatment did not affect the hepatic content of procaspase-1. Furthermore, there was no difference in the presence of lower molecular weight bands between treatment groups.
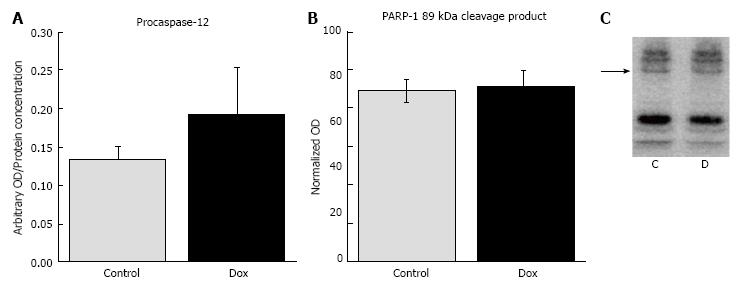
Figure 8 Markers of apoptosis.
A: Caspase-3 activity was not affected by Dox treatment; B: Graphical representation of results for the 89 kDa cleavage product of poly (ADP-ribose) polymerase-1 (PARP-1); C: Representative Western blot of PARP-1 cleavage. The arrow indicates the 89 kDa cleavage product. C: Control; D: Dox.
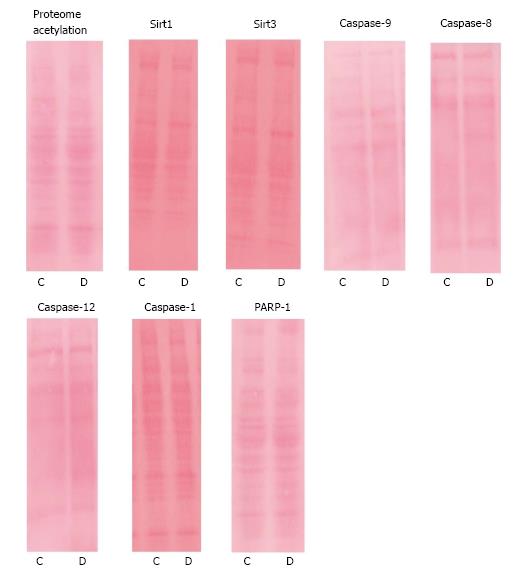
Figure 9 Ponceau staining.
Ponceau staining of samples shown in Western blots photos. C: Control; D: Dox.
- Citation: Dirks-Naylor AJ, Kouzi SA, Bero JD, Tran NT, Yang S, Mabolo R. Effects of acute doxorubicin treatment on hepatic proteome lysine acetylation status and the apoptotic environment. World J Biol Chem 2014; 5(3): 377-386
- URL: https://www.wjgnet.com/1949-8454/full/v5/i3/377.htm
- DOI: https://dx.doi.org/10.4331/wjbc.v5.i3.377


