Copyright
©2014 Baishideng Publishing Group Inc.
World J Biol Chem. Aug 26, 2014; 5(3): 334-345
Published online Aug 26, 2014. doi: 10.4331/wjbc.v5.i3.334
Published online Aug 26, 2014. doi: 10.4331/wjbc.v5.i3.334
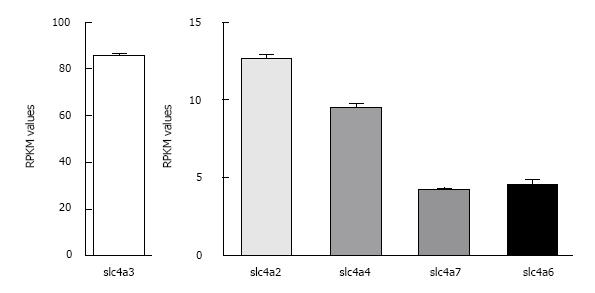
Figure 1 Relative expression levels of the major Cl-/HCO3- exchangers and Na+/HCO3- cotransporters in mouse heart.
RPKM values ± SE as determined by RNA Seq analysis (see Table 1 legend) are shown for the most abundant known HCO3- transporters in wild-type FVB/N mouse hearts (n = 4). Note the difference in scale for AE3 and the other transporters.
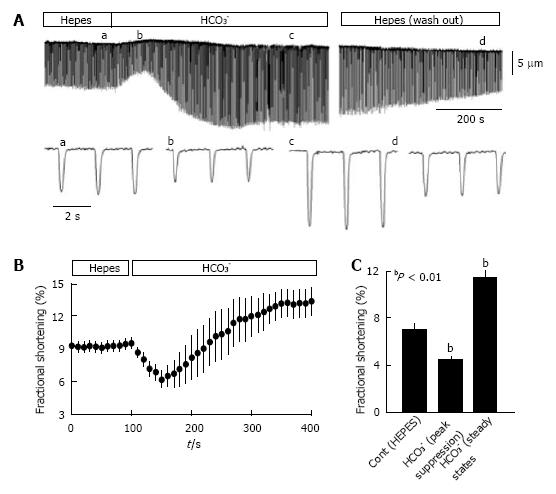
Figure 2 Isolated myocytes exhibit greater contractility in CO2/HCO3- buffer than in HEPES buffer.
Ventricular myocytes from rat hearts were enzymatically dissociated using Langendorff perfusion[104] and myocyte mechanics were analyzed at room temperature (24 °C), with stimulation at 0.5 Hz as described previously[107]. Myocytes were switched between HEPES-buffered Tyrode’s solution (in mmol/L: NaCl 140, KCl 5.4, MgCl2 1, CaCl2 1.8, glucose 10, and Na-HEPES 5; pH = 7.4; bubbled with 100% O2) and HCO3--buffered Krebs solution (in mmol/L: NaCl 120, NaHCO3- 25, KCl 4.2, KH2PO4 1.2, MgCl2 1, CaCl2 1.8, and glucose 10; pH = 7.4 when bubbled with 95% O2 and 5% CO2). A: Representative contraction tracing of a myocyte bathed in HEPES buffer, then switched to HCO3- buffer, and then returned to HEPES buffer; the lower tracings show an expanded scale for the indicated (a-d) time points. The lower panels show the time course of fractional shortening (B) and average fractional shortening (C) of myocytes (n = 19) in HEPES buffer and then switched to HCO3--containing buffer. Experiments were performed using myocytes from 3 hearts and statistical analysis was conducted using a paired t-test. Values are means ± SE.
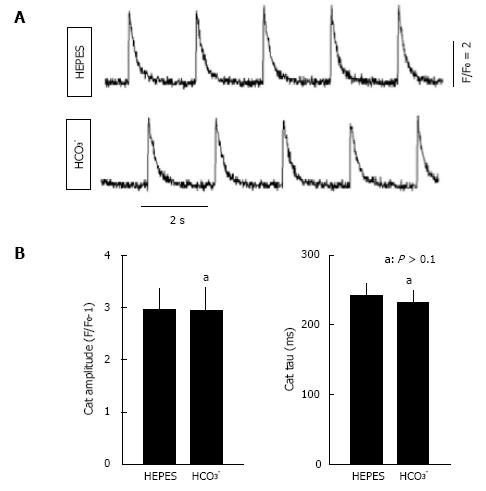
Figure 3 Ca2+ transient analysis in isolated rat myocytes bathed in CO2/HCO3- buffer and in HEPES buffer.
For recording of Ca2+ transients, isolated ventricular myocytes were loaded with fluo-4 acetoxymethyl ester (5 μmol/L, Molecular Probes, Eugene, OR) and activated with field stimulation at 0.5 Hz. Fluorescence signals were measured using a Nikon TE 2000 microscope and an InCyt Standard PM photometry system (Intracellular Imaging, Cincinnati, OH) as described previously[104]. A: Representative Ca2+ transients in HEPES and HCO3--containing buffers; B: Average Ca2+ transient (CaT) amplitudes and tau values, a measure of the rate of decay of the Ca2+ transient in HEPES and HCO3--containing buffers (n = 12). The same cells were imaged in both buffers. Myocytes were from the same preparations used in Figure 2, with statistical analyses performed using a paired t-test. No significant differences were observed.
- Citation: Wang HS, Chen Y, Vairamani K, Shull GE. Critical role of bicarbonate and bicarbonate transporters in cardiac function. World J Biol Chem 2014; 5(3): 334-345
- URL: https://www.wjgnet.com/1949-8454/full/v5/i3/334.htm
- DOI: https://dx.doi.org/10.4331/wjbc.v5.i3.334


