Copyright
©2014 Baishideng Publishing Group Inc.
World J Biol Chem. May 26, 2014; 5(2): 254-268
Published online May 26, 2014. doi: 10.4331/wjbc.v5.i2.254
Published online May 26, 2014. doi: 10.4331/wjbc.v5.i2.254
Figure 1 Structures of retinal analogues.
A: 9-cis-retinal; B: 11-cis-retinal; C: 13-cis-retinal; D: all-trans-retinal.
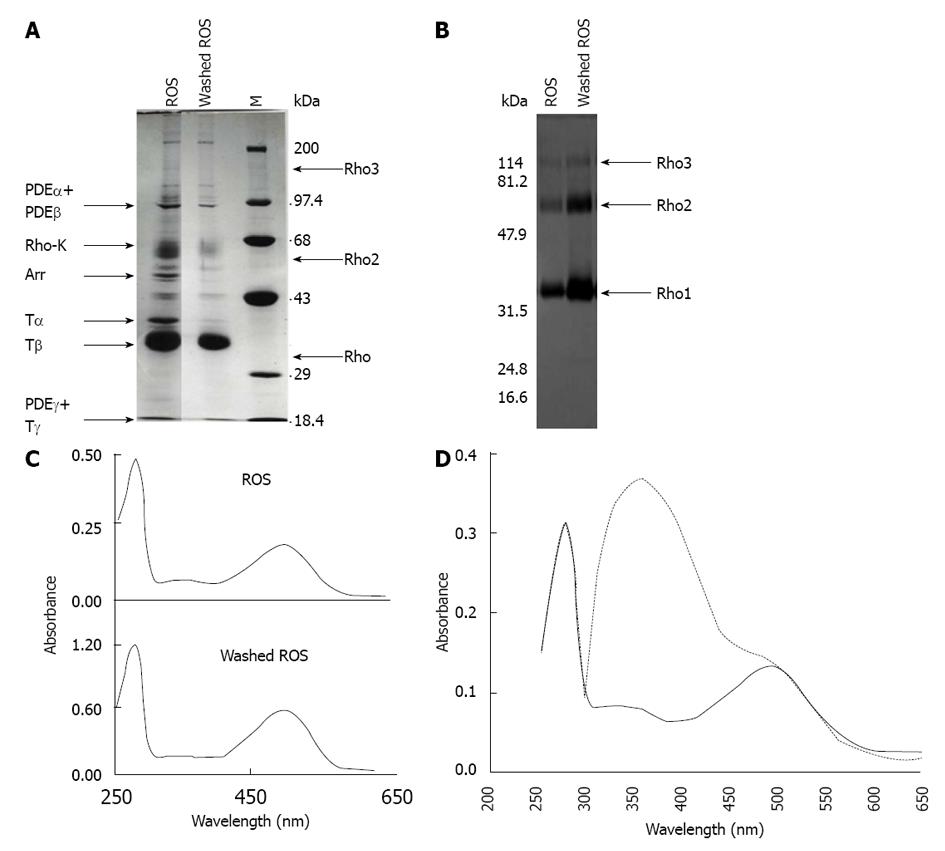
Figure 2 Isolation of rod outer segments, preparation of washed rod outer segments membranes, and reconstitution of rhodopsin.
A: ROS were isolated from frozen bovine retinas and were hypotonically washed in the dark until no peripheral proteins were released. Arrows indicate the migration of rhodopsin (Rho), rhodopsin oligomers (Rho2 and Rho3), α-, β- and γ-subunits of the cGMP phosphodiesterase PDE6 (PDEα, PDEβ and PDEγ), α-, β- and γ-subunits of transducin (Tα, Tβ and Tγ), rhodopsin kinase (Rho-K), and arrestin-1 (Arr); B: ROS and dark-depleted ROS membranes were separated by SDS-PAGE, electrotransferred to a nitrocellulose filter and analyzed using polyclonal anti-rhodopsin antibodies. Arrows point out the migration of rhodopsin (Rho), rhodopsin dimers (Rho2), and rhodopsin trimers (Rho3). C: Absorption spectra of solubilized ROS and washed-ROS membranes in the dark; D: Regeneration of rhodopsin. A sample of depleted ROS membranes was bleached with hydroxylamine and incubated with an excess of 11-cis-retinal. Shown is the UV/visible spectra of rhodopsin in the dark, before (dashed line) and after (continuous line) removing the excess of 11-cis-retinal by washing with BSA. M: Molecular weight markers; ROS: Rod outer segments.
Figure 3 Absorption spectra of rhodopsin and rhodopsin analogues.
Absorption spectrum of 9-cis-retinal-rhodopsin (9-cis-Rho) (A), rhodopsin (11-cis-Rho) (B) and 13-cis-retinal-rhodopsin (13-cis-Rho) (C) in the dark (continuous line) and under illumination (dashed line). Shown are the maximum wavelengths for each pigment.
Figure 4 Purification of transducin and arrestin-1, and preparation of an enriched fraction of rhodopsin kinase.
A: Transducin was purified to homogeneity on a DEAE-cellulose column. The elution profile was monitored at 280 nm (■). Fractions were analyzed for [8-3H] GMPpNp binding activity (CPM) in the absence (○, continuous line) or presence (○, dashed line) of light-activated rhodopsin (as dark-depleted ROS membranes). Fractions were also examined by SDS-PAGE (Inset, top) and Western blot using anti-transducin polyclonal antibodies (Inset, bottom). Lanes a, b, c, d, e, f, and g correspond to column fractions Nº 155, 160, 165, 170, 175, 180 and 185, respectively. Arrows indicate the migration of α-, β- and γ-subunits of transducin (Tα, Tβ and Tγ); B: Autoradiography showing the light-induced in vitro phosphorylation of rhodopsin by rhodopsin kinase (Rho-K). Left, Coomassie blue staining; Right, Autoradiography. Samples of intact ROS membranes, a partially purified fraction of Rho-K, or a mixture of dark-depleted ROS membranes together with the enriched fraction of Rho-K were incubated with [γ-32P] ATP under light conditions as described in Materials and Methods. Arrows indicate the migration of phosphorylated rhodopsin (Rho), rhodopsin dimers (Rho2), rhodopsin trimers (Rho3) and rhodopsin tetramers (Rho4). A polypeptide band of 80 kDa was phosphorylated in the Rho-K enriched fraction. M: Molecular weight markers; C: Arrestin-1 was purified to homogeneity after three consecutive chromatography steps, a DEAE-cellulose column, a heparin-sepharose column eluted with a gradient of phytic acid, and a second heparin-sepharose column eluted by increasing the salt concentration in the buffer. Shown is the elution profile of the last heparin-sepharose column, which was monitored at 280 nm (•). Fractions were inspected by SDS-PAGE (Inset, top) and Western blot using anti-arrestin-1 polyclonal antibodies (Inset, bottom). Lanes a, b, c, d, e, f, g, h, i, and j correspond to column fractions Nº 17, 21, 23, 25, 27, 29, 31, 33, 35, and 36. Arrows indicate the migration of arrestin-1 (Arr). ROS: Rod outer segments.
Figure 5 Activation of transducin by reconstituted rhodopsin and rhodopsin analogues.
Binding of guanine nucleotides to transducin was evaluated by Millipore filtration using [8-3H] GMPpNp. Dark and white bars correspond to experiments performed under dark and light conditions, respectively. Duplicate assays of three independent experiments were carried out. Mean ± SD are reported. Differences with P-values < 0.05 were considered significant.
Figure 6 Ability of the reconstituted rhodopsin and rhodopsin analogues to serve as substrates for rhodopsin kinase.
A: Coomassie blue staining; B: Autoradiography. Arrows indicate the migration of rhodopsin (Rho) and phosphorylated Rho (Rho-P); C: Densitometry of the autoradiograms shown in B. Dark and white bars correspond to experiments performed under dark and light conditions, respectively. Mean ± SD of three independent experiments are reported. Differences with P-values below 0.05 were considered significant.1: 9-cis-Rho; 2: 11-cis-Rho; 3: 13-cis-Rho.
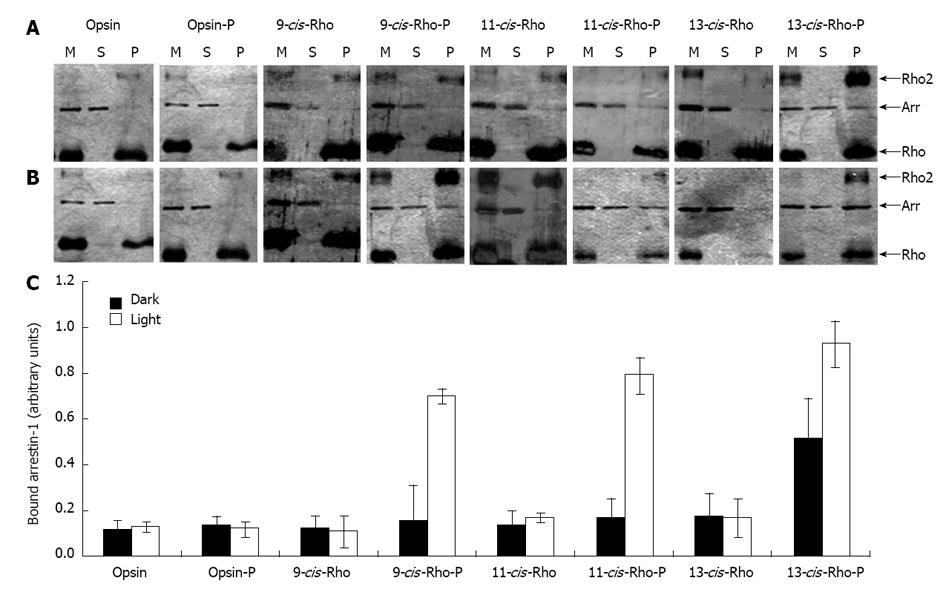
Figure 7 Ability of arrestin-1 to interact with the reconstituted rhodopsin and rhodopsin analogues.
Arrestin-1 was combined with membranes containing opsin, phosphorylated opsin (opsin-P), isorhodopsin (9-cis-Rho), phosphorylated isorhodopsin (9-cis-Rho-P), rhodopsin (11-cis-Rho), phosphorylated rhodopsin (11-cis-Rho-P), 13-cis-retinal-rhodopsin (13-cis-Rho), and phosphorylated 13-cis-retinal-rhodopsin (13-cis-Rho-P), under dark (Panel A) and light (Panel B) conditions. The mixtures (M) were centrifuged and aliquots of each mixture and of the resulting supernatants (S) and pellets (P) were separated by SDS-PAGE. Gels were colored by silver staining. In Panel C, the amount of arrestin-1 that interacted with the phosphorylated pigments in the pellet fraction was quantified by densitometry. Mean ± SD of three independent experiments are reported. Differences with P-values < 0.05 were considered significant Arrows indicate the migration of rhodopsin (Rho), arrestin-1 (Arr), and rhodopsin dimers (Rho2).
- Citation: Araujo NA, Sanz-Rodríguez CE, Bubis J. Binding of rhodopsin and rhodopsin analogues to transducin, rhodopsin kinase and arrestin-1. World J Biol Chem 2014; 5(2): 254-268
- URL: https://www.wjgnet.com/1949-8454/full/v5/i2/254.htm
- DOI: https://dx.doi.org/10.4331/wjbc.v5.i2.254


