Copyright
©2013 Baishideng Publishing Group Co.
World J Biol Chem. Nov 26, 2013; 4(4): 141-147
Published online Nov 26, 2013. doi: 10.4331/wjbc.v4.i4.141
Published online Nov 26, 2013. doi: 10.4331/wjbc.v4.i4.141
Figure 1 Alterations in amino acid concentrations in ayahuasca-treated rats.
Hippocampus (A) and Amygdale (B). The bars represent mean ± SD of amino acid concentration. ASP: Aspartate; GLU: Glutamate; GLN: Glutamine; GLY: Glycine; TAU: Taurine; GABA: γ-aminobutyruc acid. Analysis of variance followed by Scheffé test and aP < 0.05 vs saline.
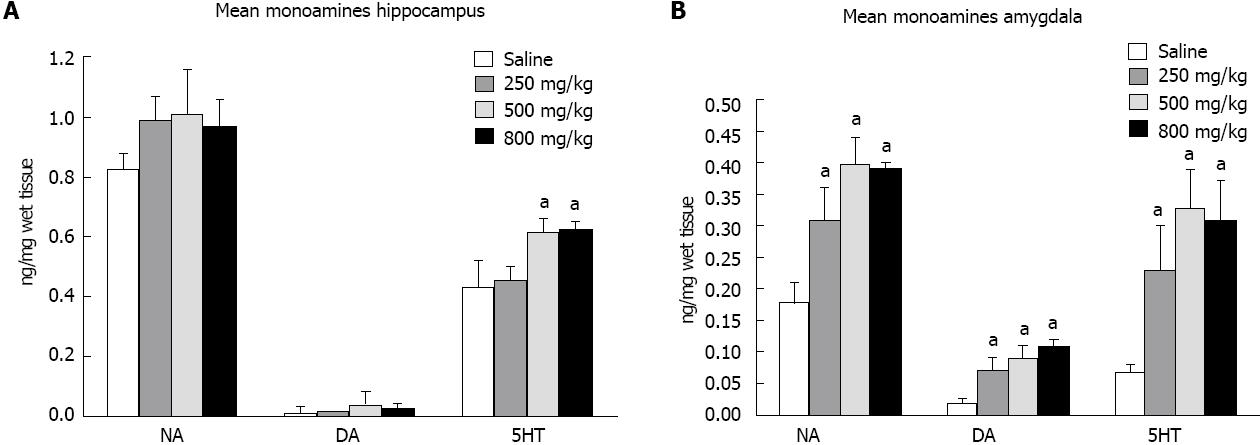
Figure 2 Alterations in monoamine concentrations of ayahuasca-treated rats.
Hippocampus (A) and Amygdale (B). The bars represent mean ± SD. Amino acid concentration: NA (NE): Norepinephrine; DA: Dopamine; 5HT: 5-hydroxytryptamine. Analysis of variance followed by Scheffe test and aP < 0.05 vs saline.
Figure 3 Utilization rate of monoamines.
Hippocampus (A) and Amygdale (B). The utilization rate was estimated as a ratio between metabolite/ neurotransmitter concentrations: VMA: 4-hydroxy-3-methoxy mandelic acid; NA: Norepinephrine; DA: Dopamine; 5HIAA: 5-hydroxyindoleacetic acid; HVA: 4-hydroxy-3-methoxy-phenylacetic acid; 5HT: 5-hydroxytryptamine. The bars represent mean ± SD of ratio. The results were evaluated by Analysis of variance followed by Scheffé test. (aP < 0.05 vs saline).
- Citation: Castro-Neto EF, Cunha RHD, Silveira DXD, Yonamine M, Gouveia TLF, Cavalheiro EA, Amado D, Naffah-Mazzacoratti MDG. Changes in aminoacidergic and monoaminergic neurotransmission in the hippocampus and amygdala of rats after ayahuasca ingestion. World J Biol Chem 2013; 4(4): 141-147
- URL: https://www.wjgnet.com/1949-8454/full/v4/i4/141.htm
- DOI: https://dx.doi.org/10.4331/wjbc.v4.i4.141


