Copyright
©2011 Baishideng Publishing Group Co.
World J Biol Chem. Dec 26, 2011; 2(12): 252-260
Published online Dec 26, 2011. doi: 10.4331/wjbc.v2.i12.252
Published online Dec 26, 2011. doi: 10.4331/wjbc.v2.i12.252
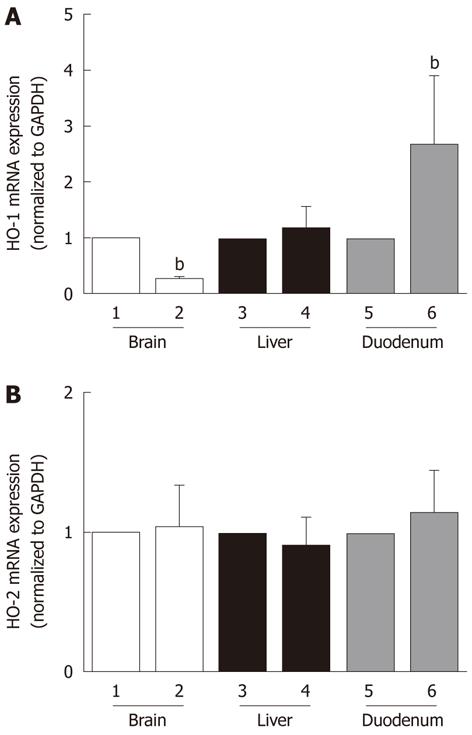
Figure 1 Effect of chronic alcohol exposure on heme oxygenase expression.
Heme oxygenase (HO)-1 (A) and HO-2 (B) mRNA expression in the brain (lanes 1 and 2), liver (lanes 3 and 4) and duodenum (lanes 5 and 6) of C57BL/6 wild-type mice pair-fed with regular (control) (lanes 1, 3 and 5) or ethanol-containing (lanes 2, 4 and 6) L. De Carli diets for 4 wk was measured by real-time polymerase chain reaction. HO expression in alcohol-treated mice was expressed as fold expression of that in control mice. bP < 0.01.
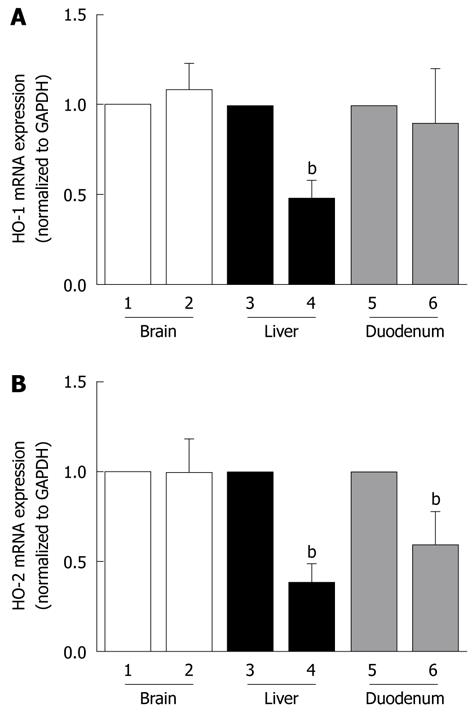
Figure 2 Effect of acute alcohol exposure on heme oxygenase expression.
Heme oxygenase (HO)-1 (A) and HO-2 (B) mRNA expression in the brain (lanes 1 and 2), liver (lanes 3 and 4) and duodenum (lanes 5 and 6) of C57BL/6 wild-type mice fed with either plain water, as controls (lanes 1, 3 and 5) or 10% ethanol in the drinking water (lanes 2, 4 and 6) for 7 d was measured by real-time polymerase chain reaction. HO expression in alcohol-treated mice was expressed as fold expression of that in control mice. bP < 0.01.
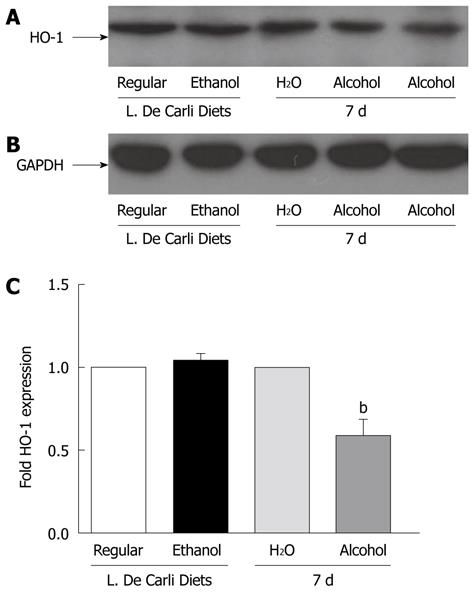
Figure 3 Effect of chronic and acute alcohol exposure on heme oxygenase-1 protein expression.
Sixty micrograms of whole cell lysate proteins isolated from the livers of C57BL/6 wild-type mice either pair-fed with regular or ethanol-containing L. De Carli diets for 4 wk or fed with plain water or 10% ethanol (alcohol) for 7 d were resolved by SDS-PAGE. A: Heme oxygenase (HO)-1 expression was determined by western blotting; B: An anti-GAPDH antibody was used to confirm equal protein loading; C: Autoradiographs were scanned by a densitometer, and HO-1 expression in each sample was quantified by normalizing to GAPDH protein expression. Normalized HO-1 expression in alcohol-treated mice was expressed as fold expression of that in control mice. bP < 0.01.
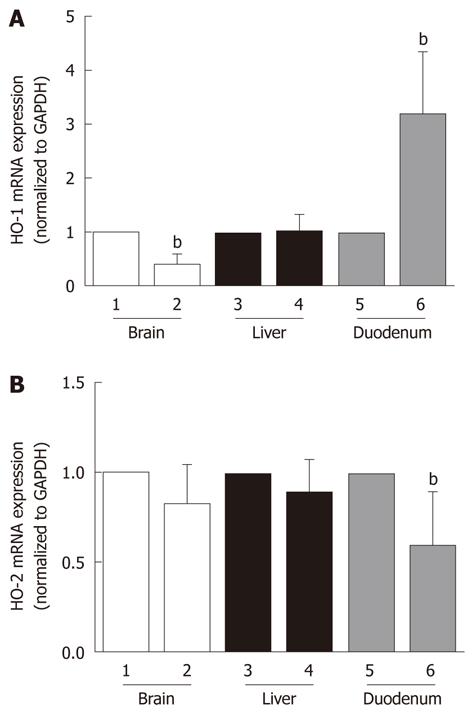
Figure 4 MnSOD knockout mice (Sod2+/-) and heme oxygenase expression.
Heme oxygenase (HO)-1 (A) and HO-2 (B) mRNA expression in the brain (lanes 1 and 2), liver (lanes 3 and 4) and duodenum (lanes 5 and 6) of Sod2+/- mice fed with plain water as control (lanes 1, 3 and 5) or 10% ethanol in drinking water (lanes 2, 4 and 6) for 7 d was measured by real-time polymerase chain reaction. HO expression in alcohol-treated Sod2+/- mice was expressed as fold expression of that in control Sod2+/- mice fed with plain water. bP < 0.01.
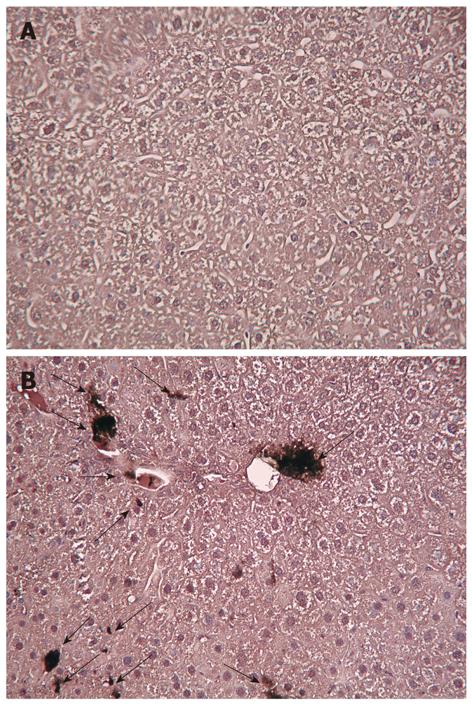
Figure 5 Oxidative stress in MnSOD knockout mice (Sod2+/-).
Immunoperoxidase staining of liver sections from negative littermate control (A) and Sod2+/- mice (B) by an anti-8-OHdG antibody. The arrows indicate examples of 8-OHdG-positive staining (original magnification 20 ×).
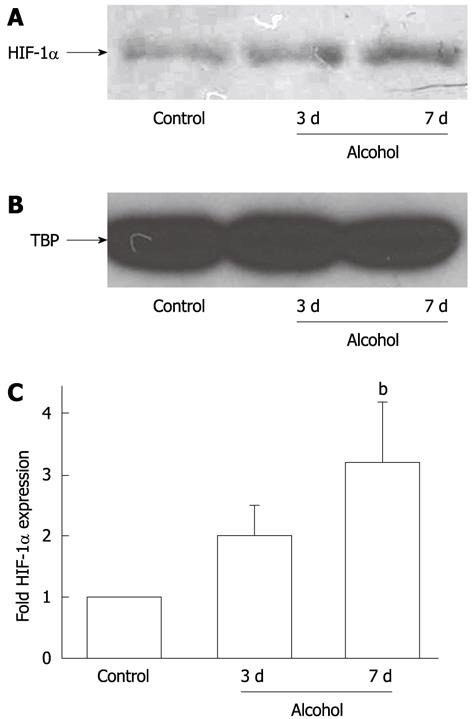
Figure 6 Alcohol and hypoxia inducible factor-1α.
Twenty micrograms of nuclear proteins isolated from the livers of C57BL/6 wild-type mice fed with plain water (control) or 10% ethanol for 3 or 7 d were resolved by SDS-PAGE. A: Hypoxia inducible factor (HIF)-1α expression was determined by western blotting; B: An anti-TATA-binding protein (TBP) antibody was used to confirm equal protein loading; C: Autoradiographs were scanned by a densitometer, and HIF-1α expression in each sample was quantified by normalizing to TBP protein expression. Normalized HIF-1α expression in alcohol-treated mice was expressed as fold expression of that in water-fed control mice. bP < 0.01.
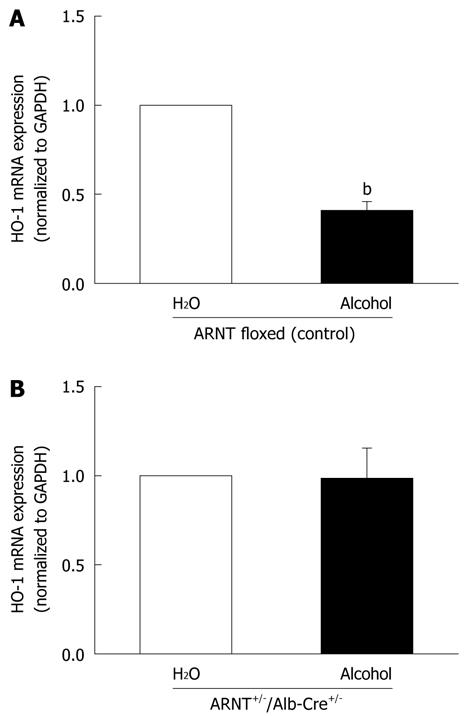
Figure 7 Heme oxygenase expression in ARNT (hypoxia inducible factor-1β) knockout mice.
Heme oxygenase (HO)-1 mRNA expression in the livers of (A) ARNT floxed control mice and (B) liver-specific ARNT heterozygous knockout mice (ARNT+/-/Alb-Cre+/-), fed with plain water or 10% ethanol in drinking water for 7 d was measured by real-time polymerase chain reaction. HO expression in alcohol-treated mice was expressed as fold expression of that in mice fed with plain water. bP < 0.01.
- Citation: Gerjevic LN, Lu S, Chaky JP, Harrison-Findik DD. Regulation of heme oxygenase expression by alcohol, hypoxia and oxidative stress. World J Biol Chem 2011; 2(12): 252-260
- URL: https://www.wjgnet.com/1949-8454/full/v2/i12/252.htm
- DOI: https://dx.doi.org/10.4331/wjbc.v2.i12.252


