Copyright
©2011 Baishideng Publishing Group Co.
World J Biol Chem. Jan 26, 2011; 2(1): 14-24
Published online Jan 26, 2011. doi: 10.4331/wjbc.v2.i1.14
Published online Jan 26, 2011. doi: 10.4331/wjbc.v2.i1.14
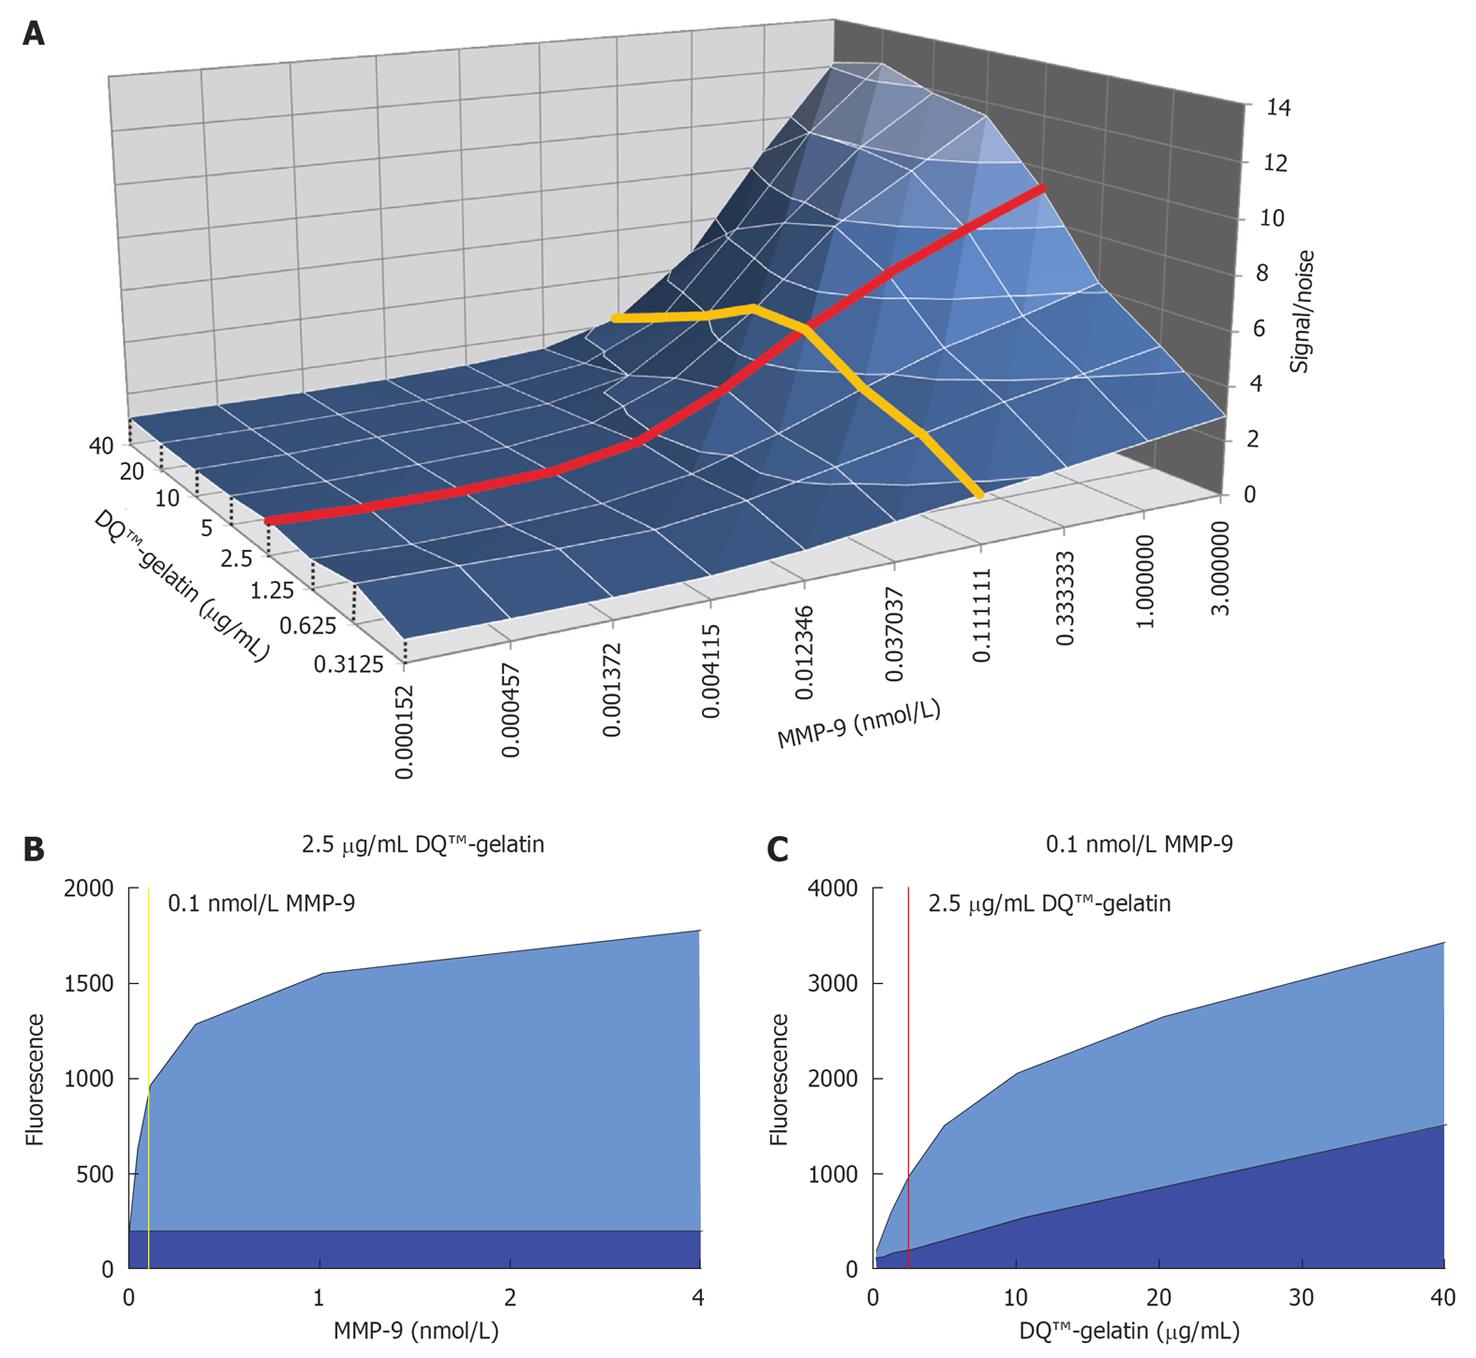
Figure 1 Optimization of enzyme and substrate concentrations.
A: 3D surface representation of the signal fluorescence divided by the noise fluorescence (signal/noise) as a function of the enzyme [matrix metalloproteinase (MMP)-9 FL] and substrate (DQ™-gelatin) concentration. Data were obtained after an incubation period of 2 h. The red line represents the signal-to-noise ratio as a function of variable enzyme concentration and at a constant substrate concentration of 2.5 μg/mL. The yellow line shows the signal-to-noise ratio at variable substrate concentrations and at a constant enzyme concentration of approximately 0.1 nmol/L. These enzyme and substrate concentrations were chosen for further testing; B: The fluorescence signal (light blue surface) and noise fluorescence (dark blue surface) under different enzyme concentrations and at a constant substrate concentration of 2.5 μg/mL is shown; C: The fluorescence signal (light blue surface) and noise fluorescence (dark blue surface) under different substrate concentrations and at a constant concentration of 0.1 nmol/L MMP-9 FL is plotted.
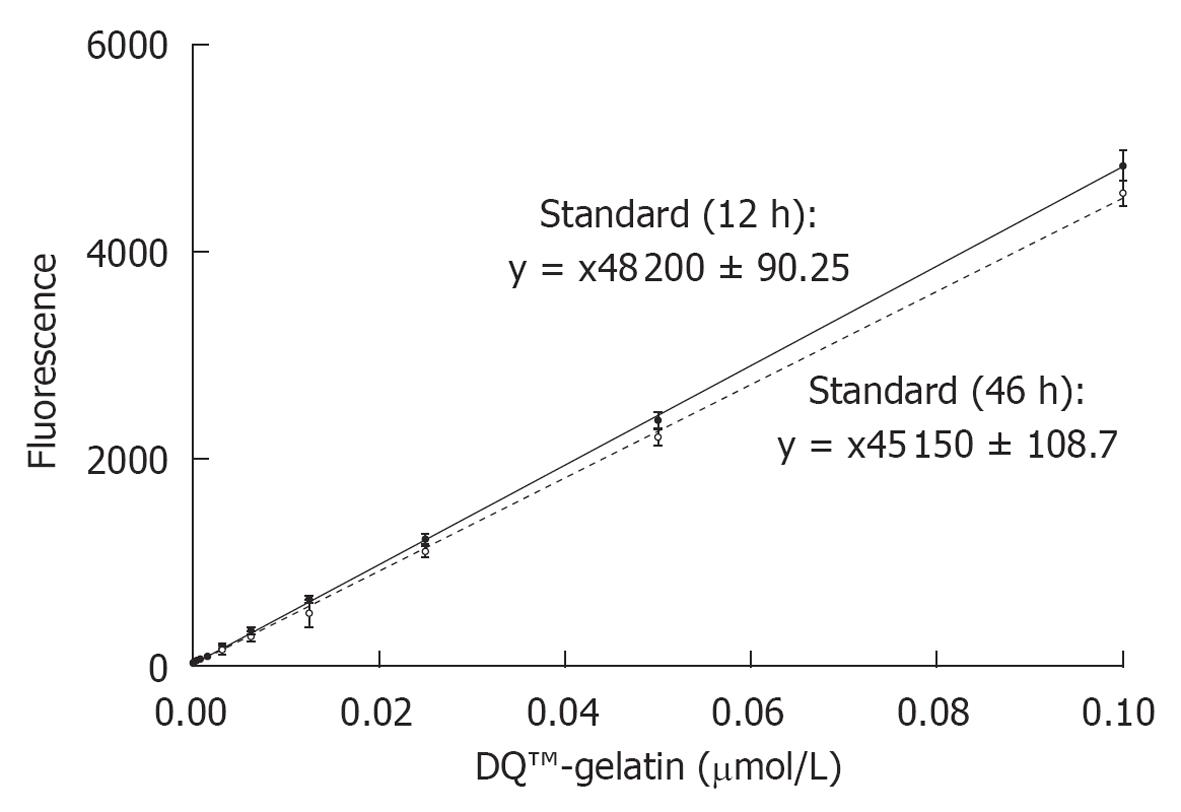
Figure 2 Standard curves of the correlations between fluorescence and product (DQ™-gelatin) concentration.
The full line represents a linear regression of fluorescence data obtained after 12 h incubation. The dashed line represents a linear regression of the fluorescence data obtained after 46 h. The drop in fluorescence was significant (P < 0.05). Data represent mean ± SE (n = 32).
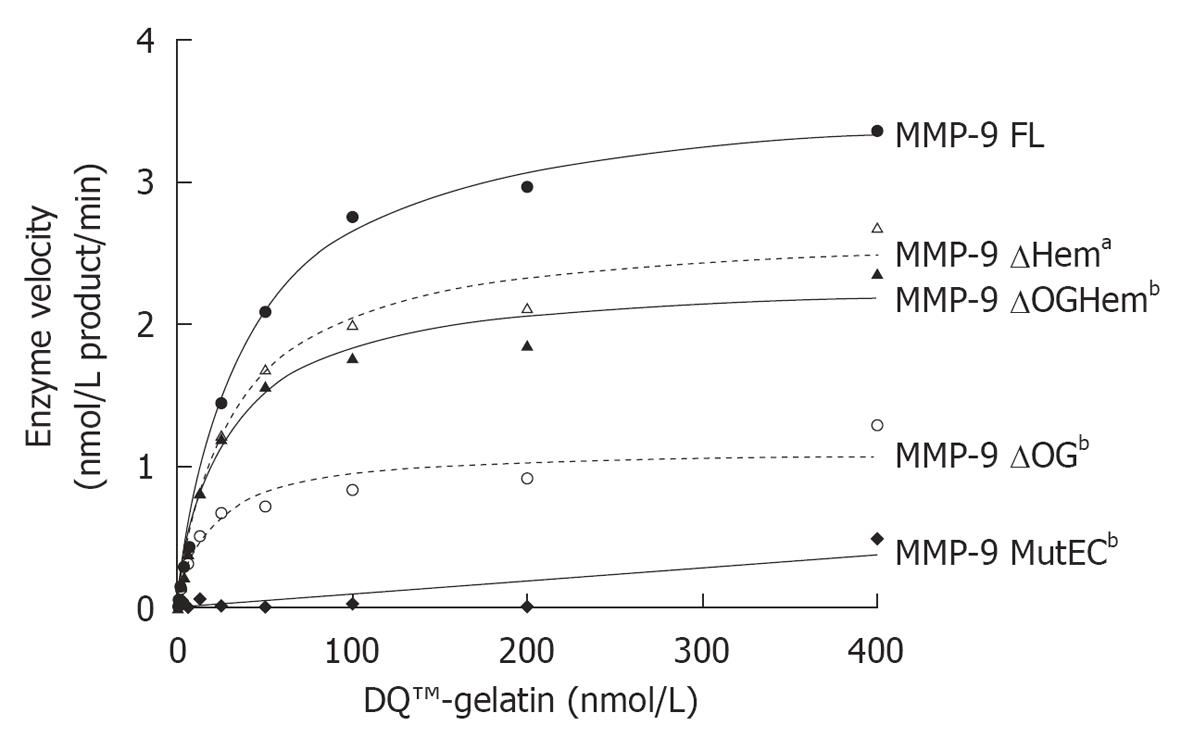
Figure 3 Enzyme velocity as a function of the amount of substrate (nmol/L DQ™-gelatin) (at a concentration of 1 nmol/L).
Prism 5 (GraphPad Software, Inc) was used to fit the data with the corresponding Michaelis-Menten curve and to calculate the Vmax and KM values (Table 2). By using a Wilcoxon signed rank test we determined that all mutants had a significantly different activity from that of matrix metalloproteinase (MMP)-9 FL (aP < 0.05, bP < 0.01). The graphs are representative of three independent experiments.
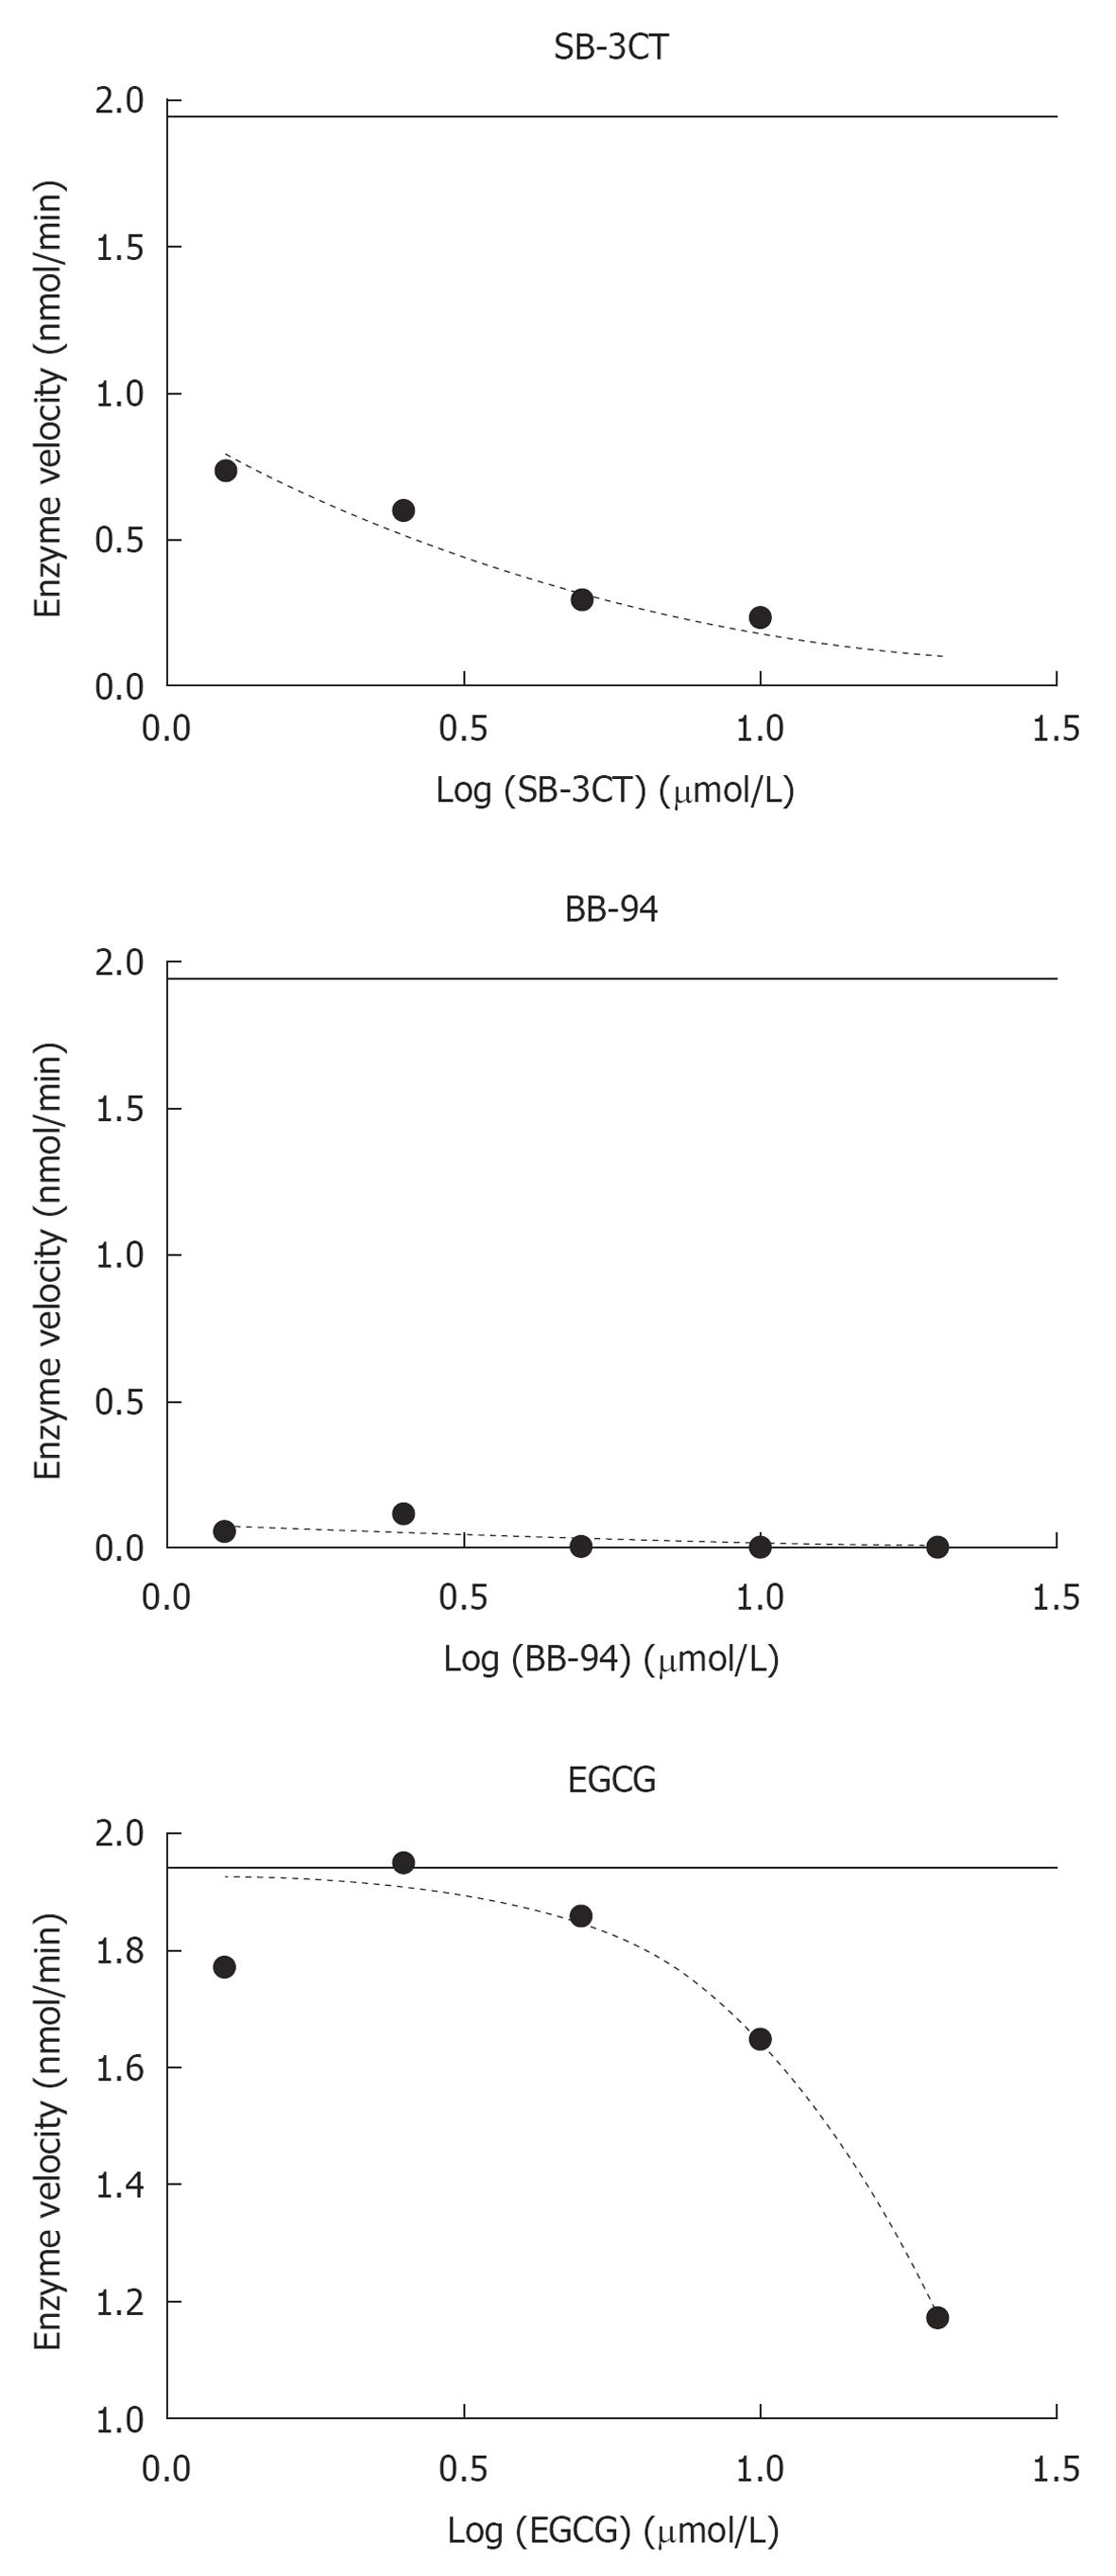
Figure 4 Dose-response curves of the inhibitory activities of SB-3CT, BB-94 and EGCG.
With GraphPad prism software, the IC50 of SB-3CT and BB-94 was predicted to be in the nmol/L range and the IC50 of EGCG in the μmol/L range. The data points correspond to inhibitor concentrations of: 1.25, 2.5, 5, 10 and 20 μmol/L, respectively. The horizontal line shows the enzyme velocity in the absence of inhibitor.
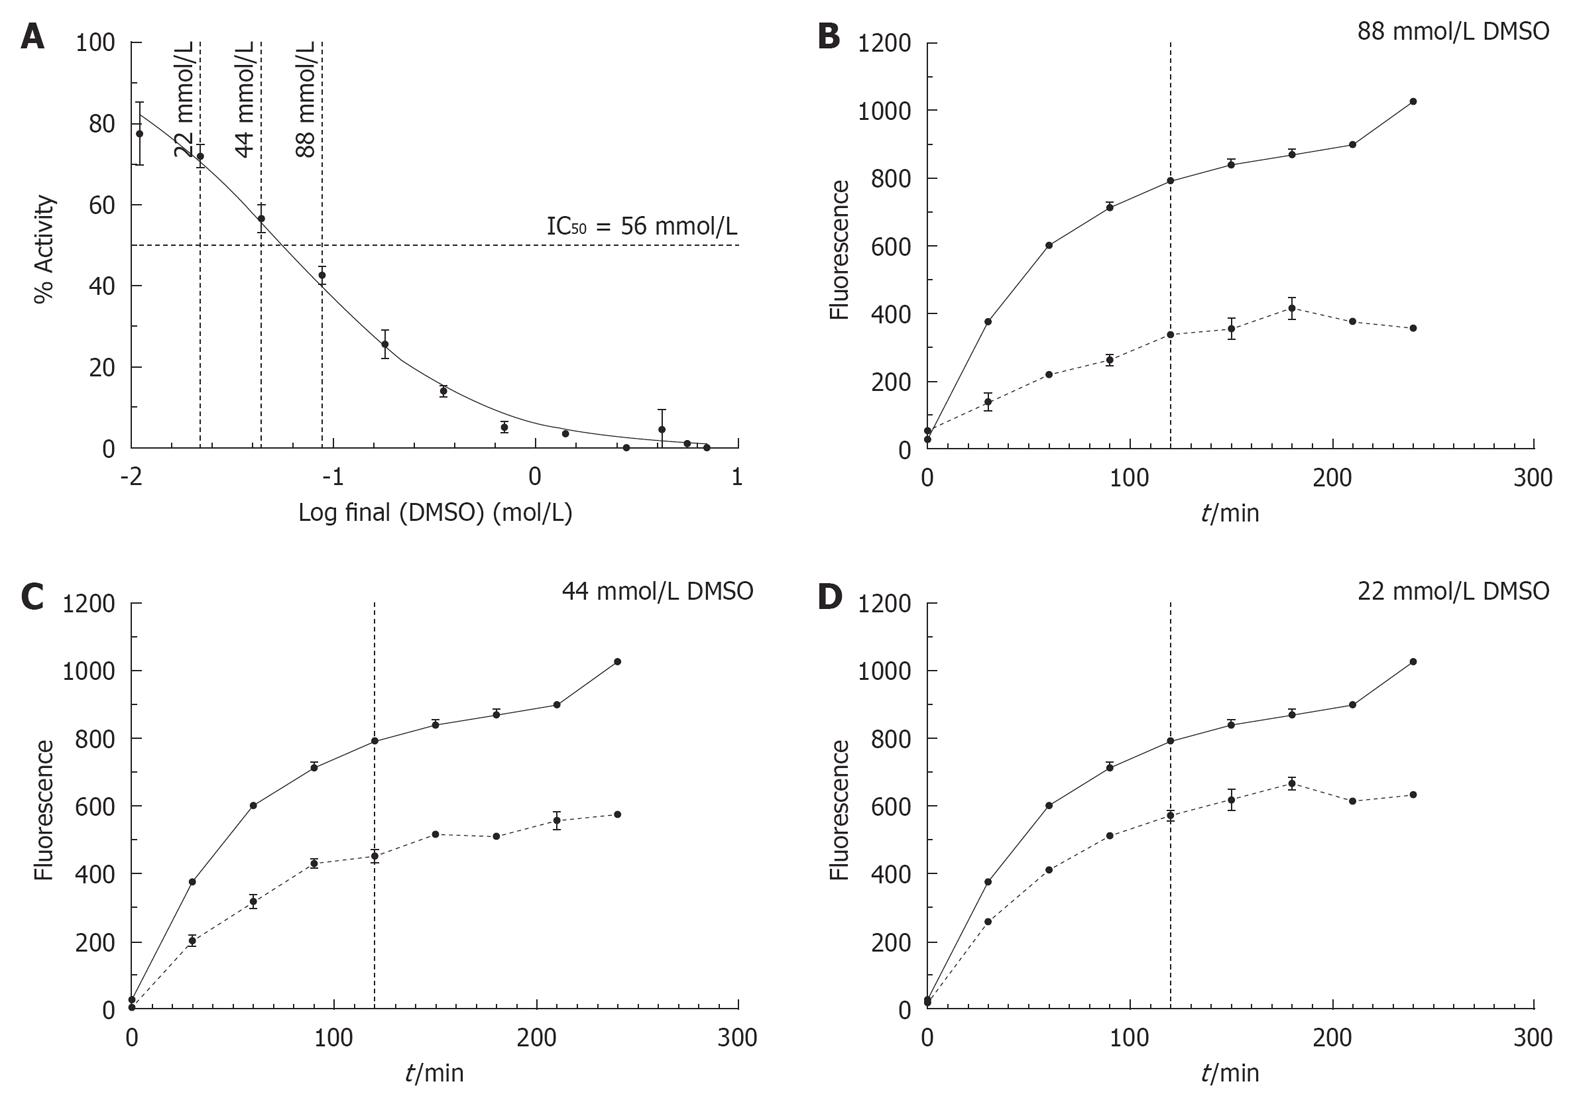
Figure 5 The influence of DMSO on the conversion of DQ™-gelatin into fluorogenic gelatin by matrix metalloproteinase-9.
A: By using a non-linear fit, an IC50 of 56 mmol/L DMSO (R2 = 0.9867) (horizontal dotted line) was determined. The vertical striped lines represent the concentrations used in panels B, C and D; B: Influences of 88 mmol/L (0.6% DMSO), 44 mmol/L (0.3% DMSO) and 22 mmol/L DMSO (0.15% DMSO) on the fluorescence changes at different time points. The solid lines show the fluorescence evolutions measured in the absence of DMSO, the striped lines show the fluorescence measured in the presence of DMSO at the indicated concentrations. The vertical dotted lines represent fluorescence data measured after 2 h.
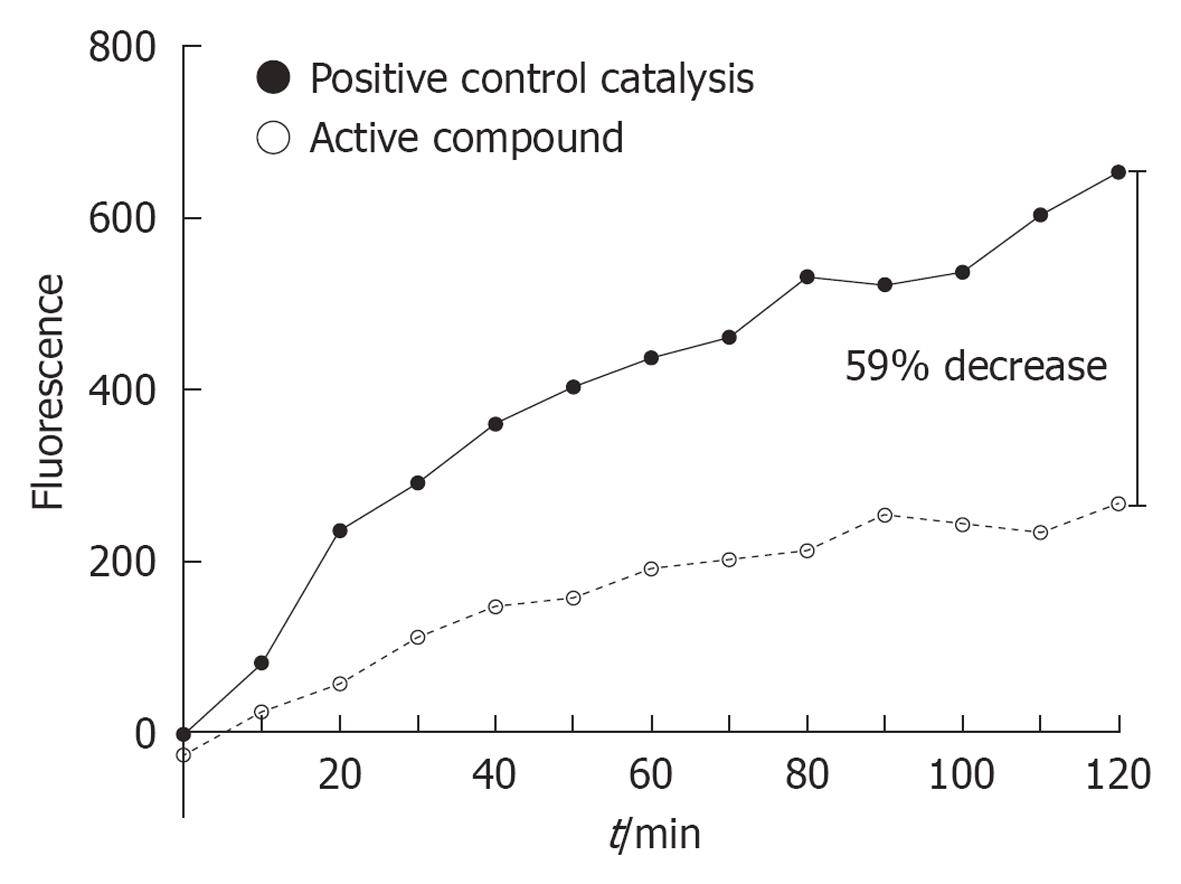
Figure 6 Typical increase in fluorescence (per time unit) between the positive control catalysis and in the presence of an active compound (ChemBridge, 6994210).
The percentage inhibition was measured after 2 h.
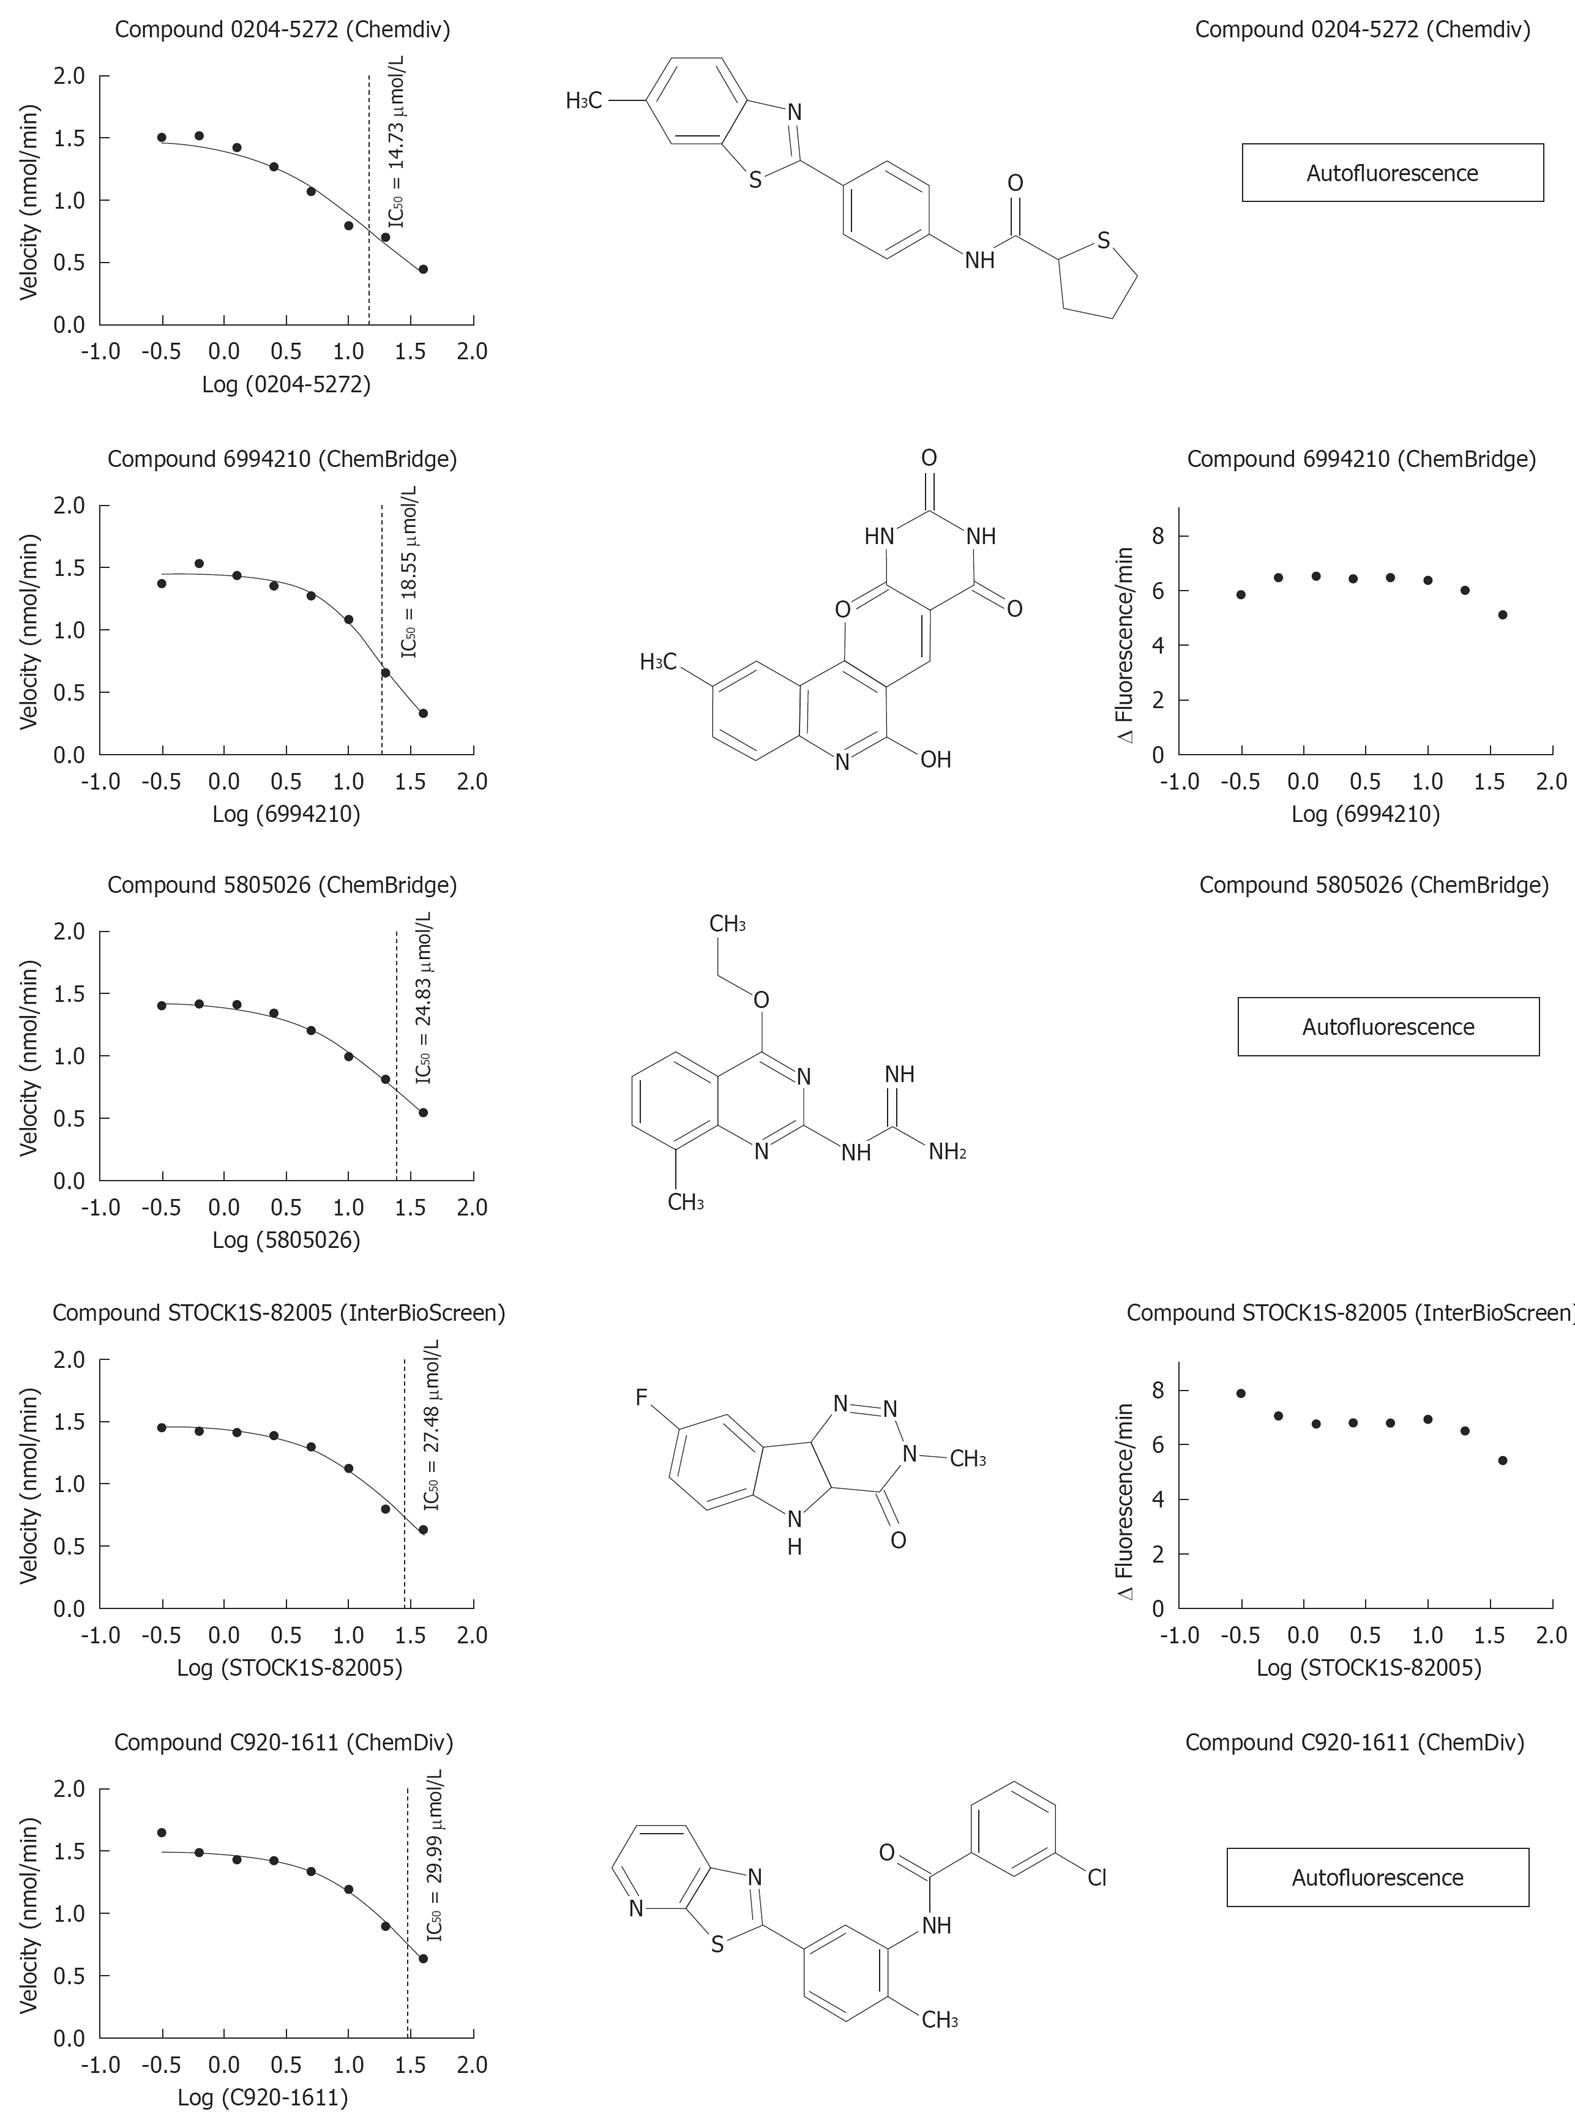
Figure 7 Dose-response graph, IC50 and molecular structure of the 5 most active compounds (IC50 < 40 μmol/L) on conversion of DQ™-gelatin and a fluorescent peptide by matrix metalloproteinase-9.
The results obtained with the DQ™-gelatin assay (including the IC50s) are shown in the left column. The chemical structures are shown in the central column. Data with the fluorescent peptide are shown in the right column.
- Citation: Vandooren J, Geurts N, Martens E, Steen PEVD, Jonghe SD, Herdewijn P, Opdenakker G. Gelatin degradation assay reveals MMP-9 inhibitors and function of O-glycosylated domain. World J Biol Chem 2011; 2(1): 14-24
- URL: https://www.wjgnet.com/1949-8454/full/v2/i1/14.htm
- DOI: https://dx.doi.org/10.4331/wjbc.v2.i1.14


