Copyright
©The Author(s) 2022.
World J Biol Chem. Mar 27, 2022; 13(2): 47-65
Published online Mar 27, 2022. doi: 10.4331/wjbc.v13.i2.47
Published online Mar 27, 2022. doi: 10.4331/wjbc.v13.i2.47
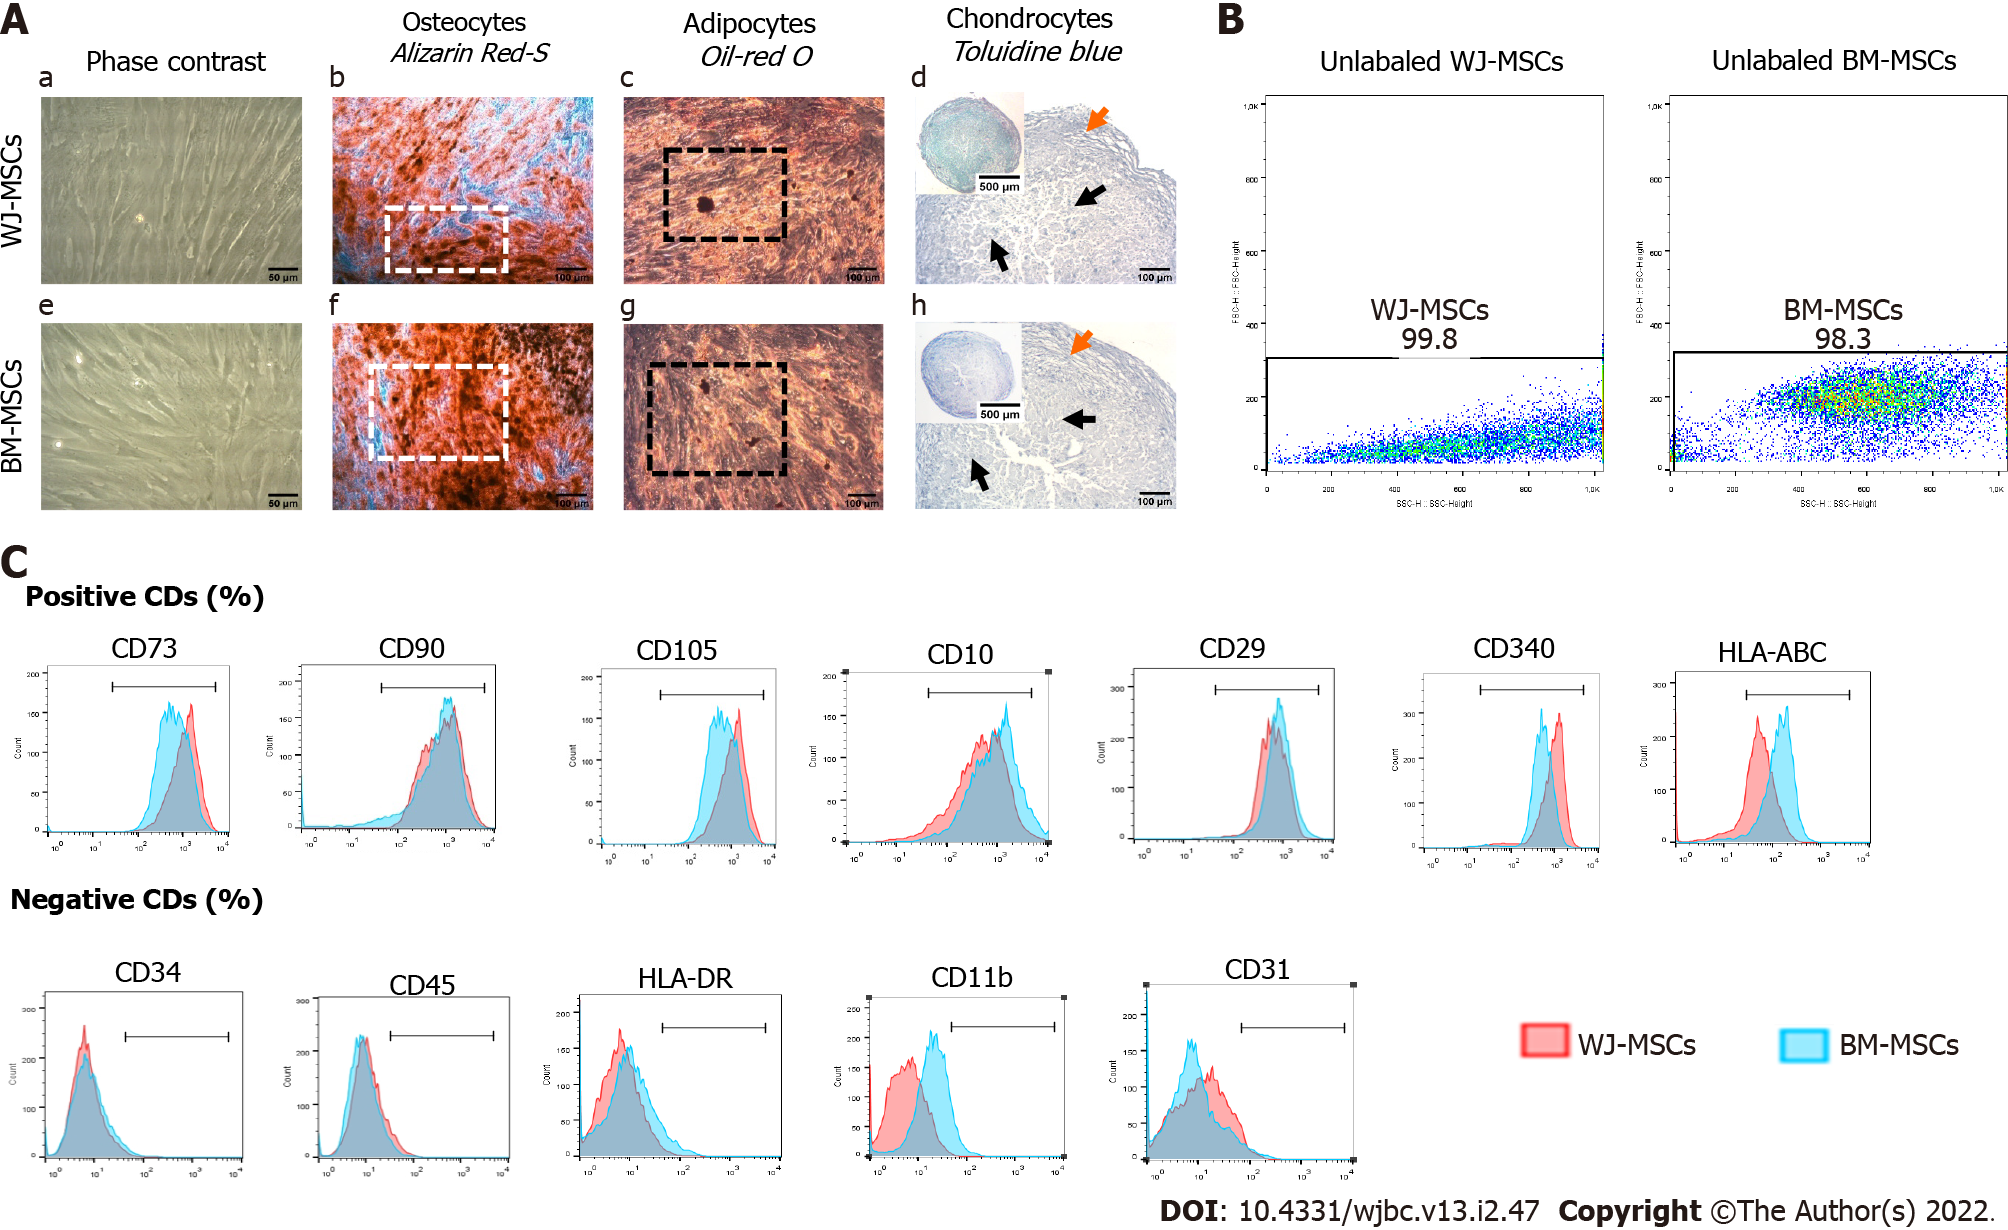
Figure 1 Evaluation of characteristics of Wharton’s Jelly and bone marrow-mesenchymal stromal cells.
A: Morphological characteristics of mesenchymal stromal cells (MSCs) derived from Wharton’s Jelly (WJ) tissue and bone marrow (BM). MSCs from both sources were characterized as spindle-shaped cells with a few internal vacuoles. Both WJ and BM-MSCs were successfully differentiated to “osteocytes”, “adipocytes”, and “chondrocytes”. White squares and black squares indicate the presence of calcium deposits and oil droplets, respectively. Black and orange arrows indicate the differentiated and undifferentiated state, respectively. a and e: Original magnification 20 ×, scale bars = 50 μm; b-d and f-h: Original magnification 10 ×, scale bars = 100 μm; B: Unlabeled WJ and BM-MSCs; C: Evaluation of CD marker expression by WJ and BM-MSCs. BM: Bone marrow; MSCs: Mesenchymal stromal cells; WJ: Wharton’s Jelly.
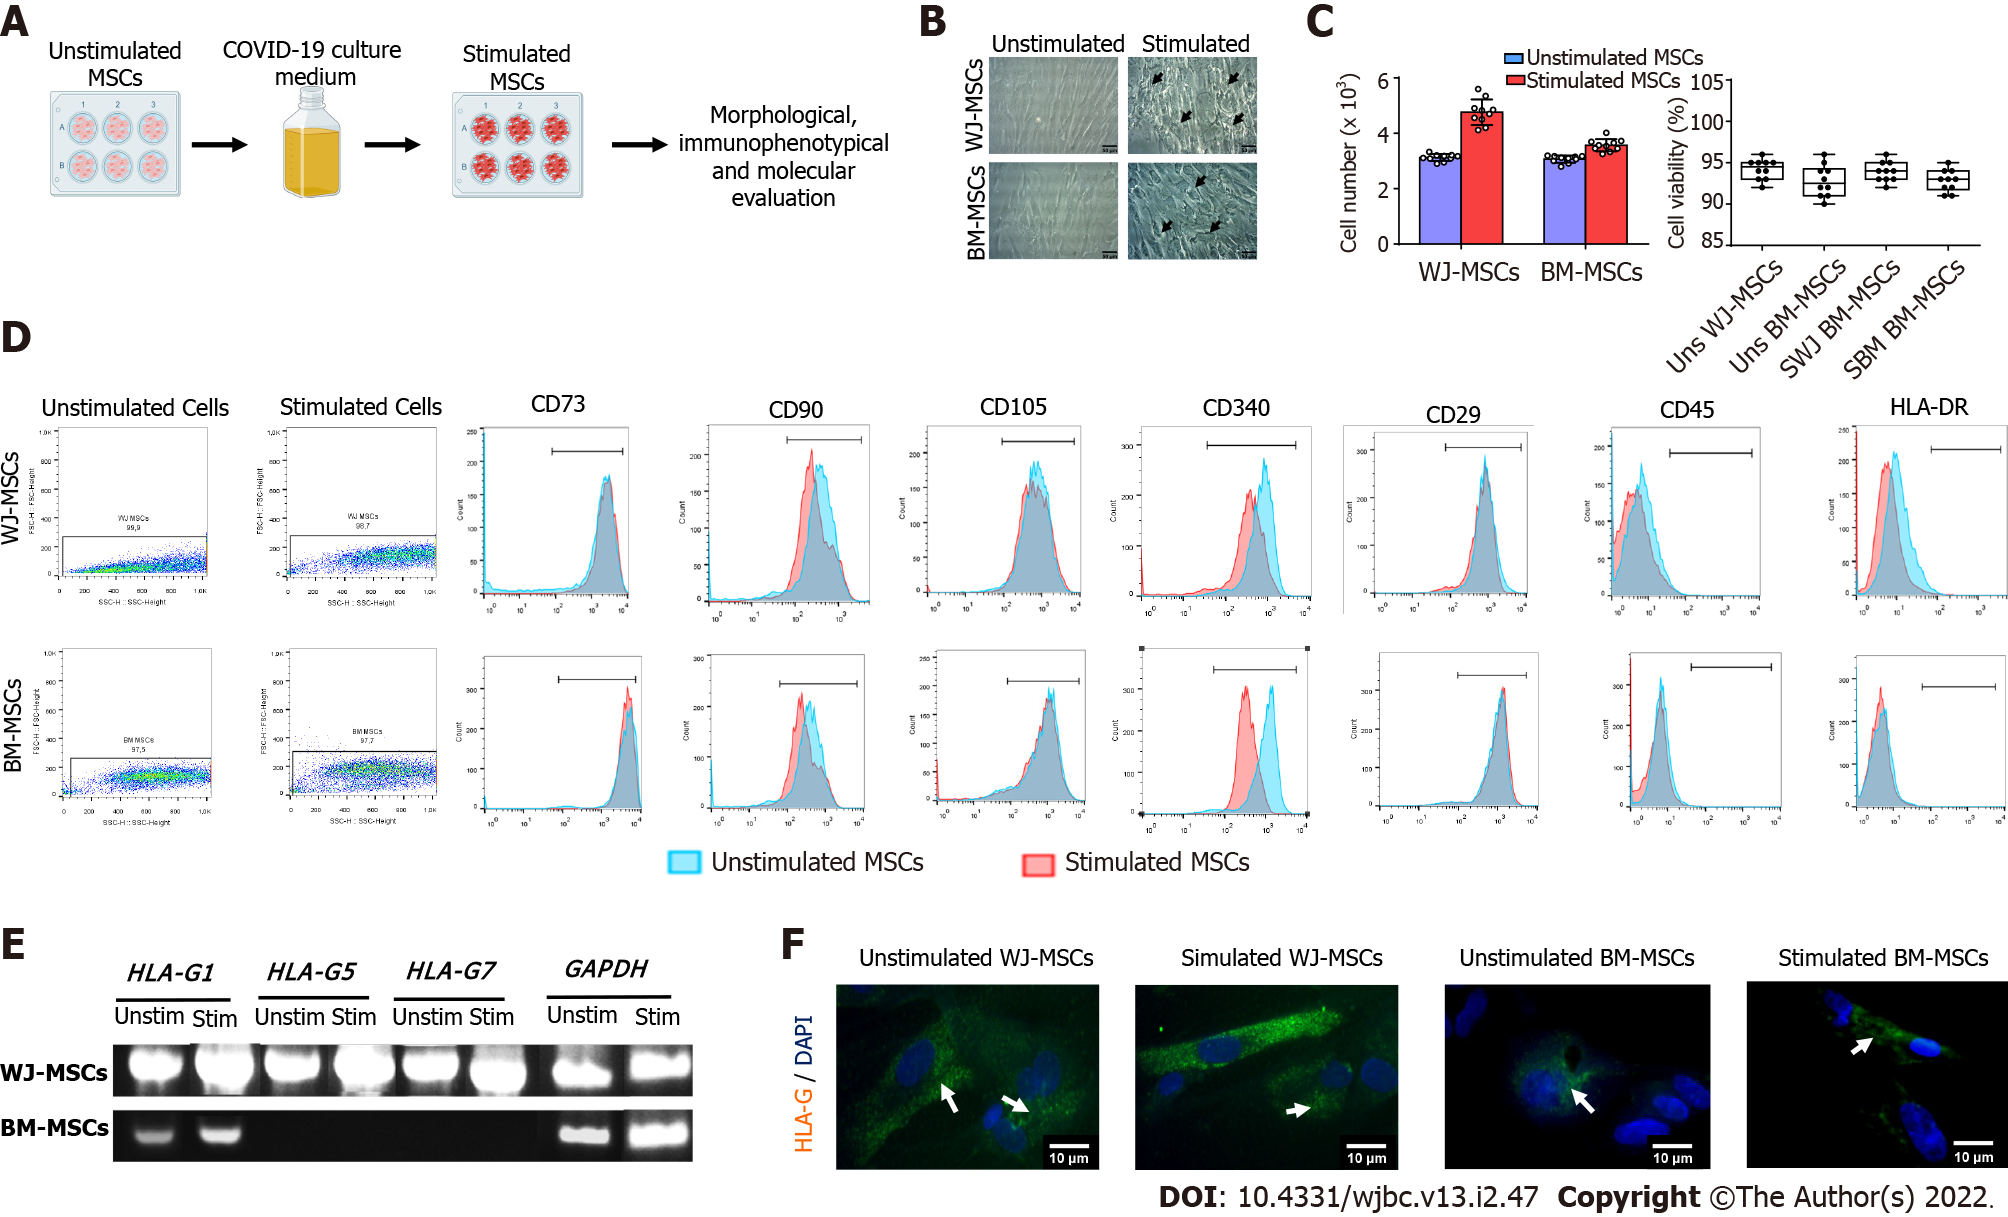
Figure 2 Comprehensive characterization of characteristics of stimulated Wharton’s Jelly and bone marrow mesenchymal stromal cells.
A: Experimental workflow; B: Morphological analysis of characteristics of unstimulated and stimulated Wharton’s Jelly (WJ) and bone marrow-mesenchymal stromal cells (BM-MSCs). Original magnification 20 ×, scale bars = 50 μm; C: Determination of cell proliferation and viability. Statistically significant differences were observed in cell proliferation between stimulated and unstimulated WJ-MSCs (P < 0.05) and stimulated and unstimulated BM-MSCs (P < 0.05). No statistically significant difference was observed in cell viability either in an unstimulated or stimulated state (P = 0.873); D: Immunophenotypic analysis of stimulated and unstimulated WJ and BM-MSCs. Over 95% of WJ and BM-MSCs in both states expressed CD73, CD90, CD105, CD29, and CD340, and less than 2% expressed CD34 and CD45; E: Determination of HLA-G isoforms (HLA-G1, G5, and G7) in unstimulated and stimulated MSCs from both sources; F: Indirect immunofluorescence against HLA-G1 in combination with DAPI stain was performed on unstimulated and stimulated WJ and BM-MSCs. Original magnification 63 ×, scale bars = 10 μm. BM: Bone marrow; MSCs: Mesenchymal stromal cells; WJ: Wharton’s Jelly.
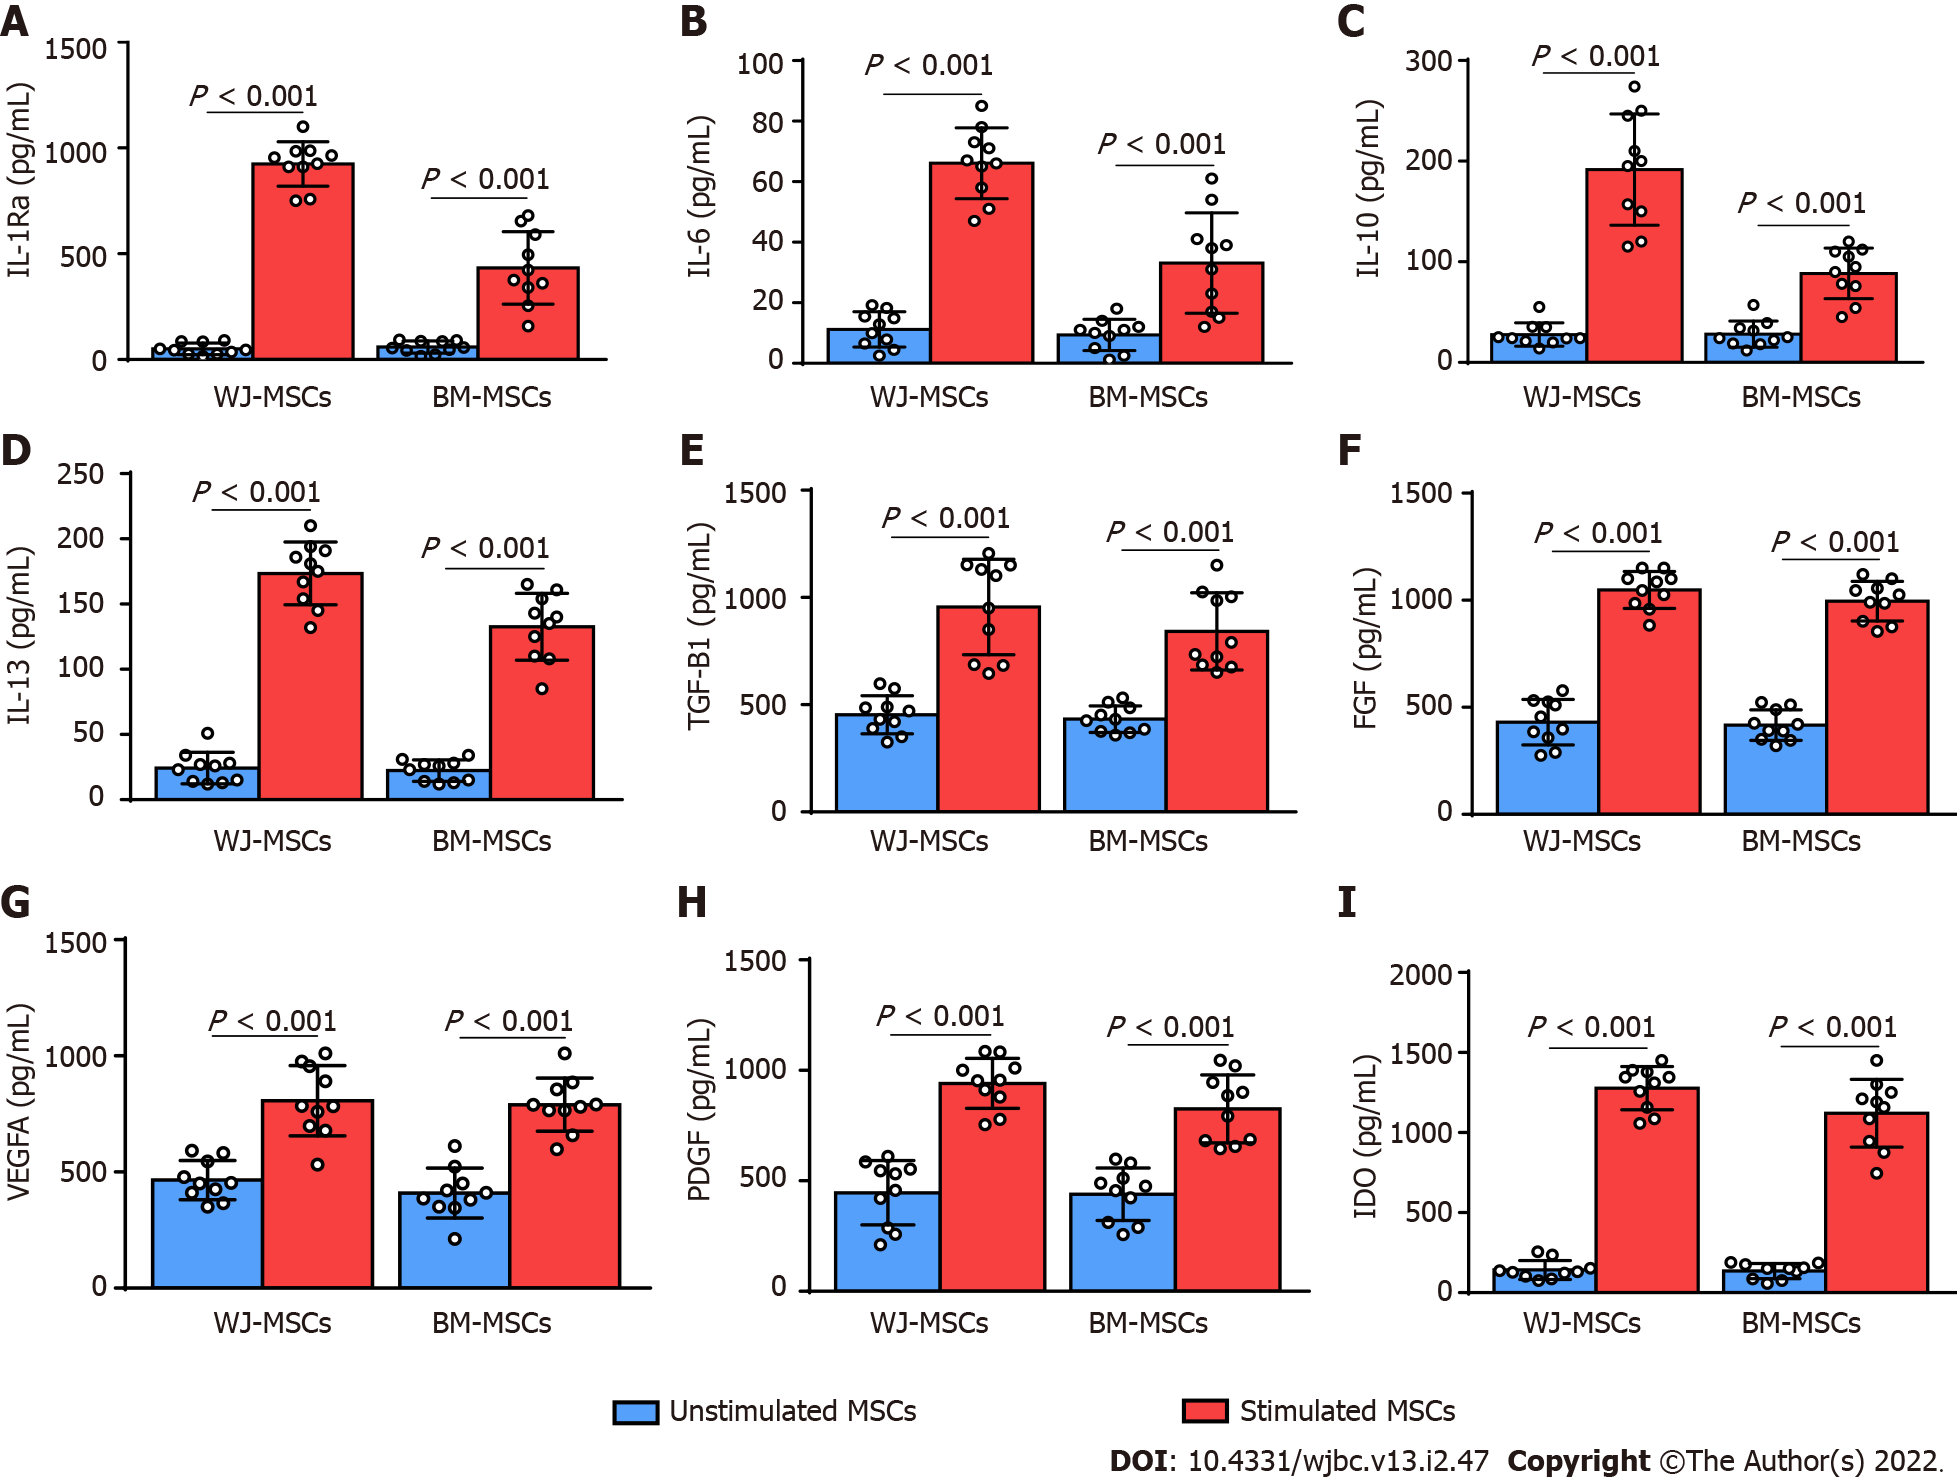
Figure 3 Quantification of immunosuppressive agents after 12 h from the initial activation with coronavirus disease 2019 patient serum.
A-D: Quantification of cytokines including IL-1Ra, IL-6, IL-10, and IL-13 in unstimulated and stimulated Wharton’s Jelly (WJ) and bone marrow-mesenchymal stromal cells (BM-MSCs); E-H: Quantification of growth factors including TGF-b1, FGF, VEGFA, and PDGF in unstimulated and stimulated WJ and BM-MSCs; I: Quantification of indoleamine-2,3-dioxygenase in unstimulated and stimulated WJ and BM-MSCs. BM: Bone marrow; MSCs: Mesenchymal stromal cells; WJ: Wharton’s Jelly.
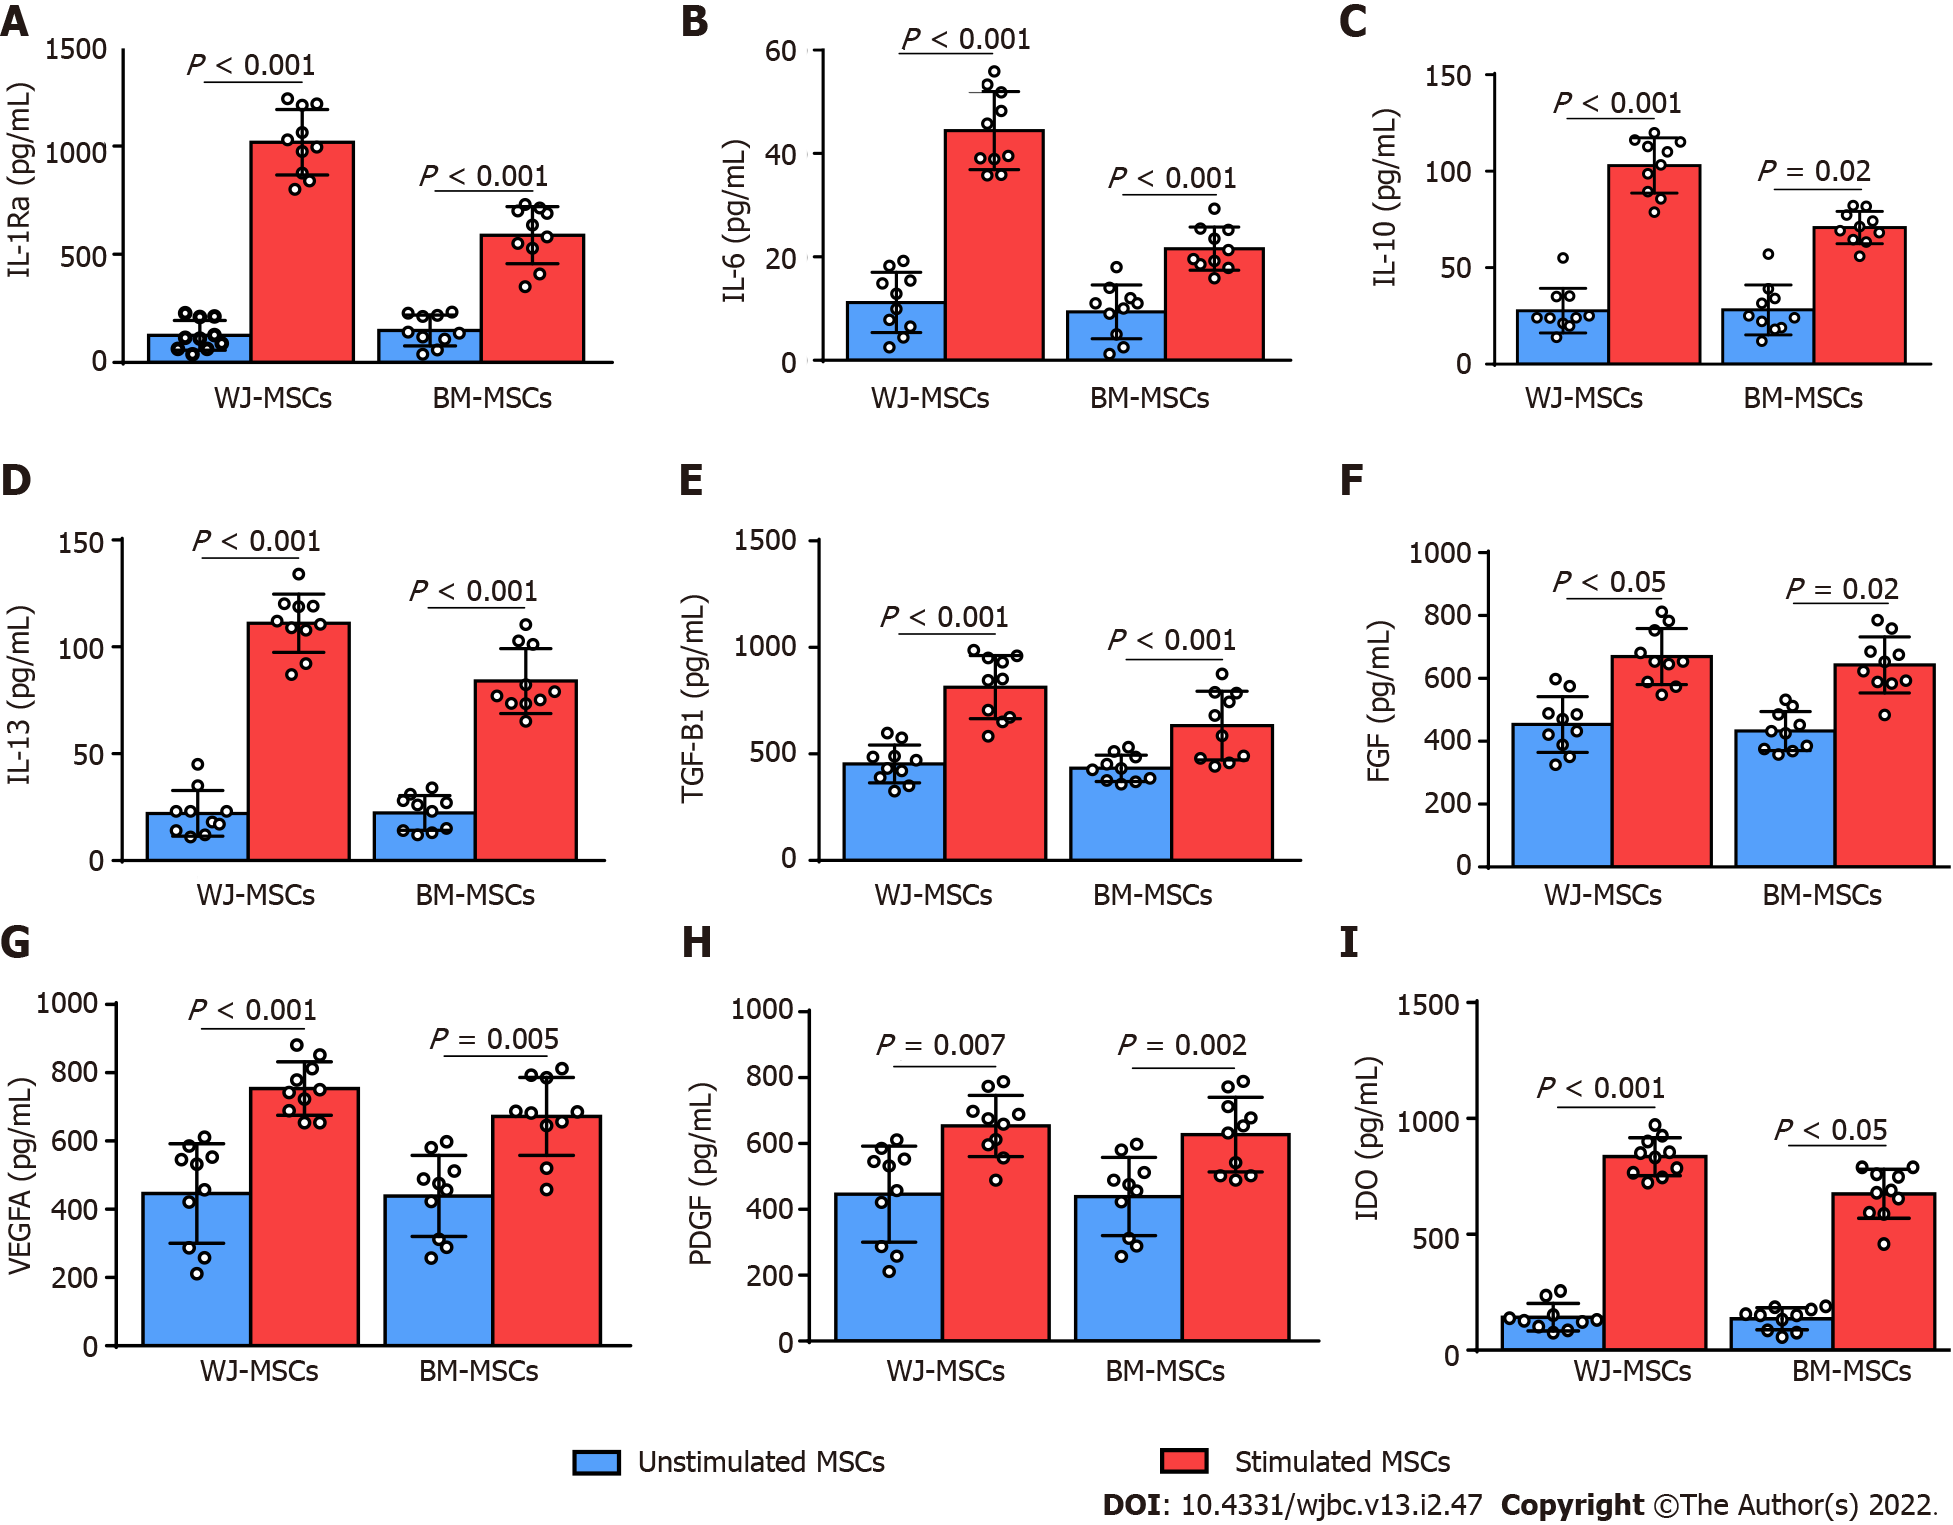
Figure 4 Quantification of immunosuppressive agents after 24 h from the initial activation with coronavirus disease 2019 patient serum.
A-D: Quantification of cytokines including IL-1Ra, IL-6, IL-10, and IL-13 in unstimulated and stimulated Wharton’s Jelly (WJ) and bone marrow mesenchymal stromal cells (BM-MSCs); E-H: Quantification of growth factors including TGF-b1, FGF, VEGFA, and PDGF in unstimulated and stimulated WJ and BM-MSCs; I: Quantification of IDO in unstimulated and stimulated WJ and BM-MSCs. BM: Bone marrow; MSCs: Mesenchymal stromal cells; WJ: Wharton’s Jelly.
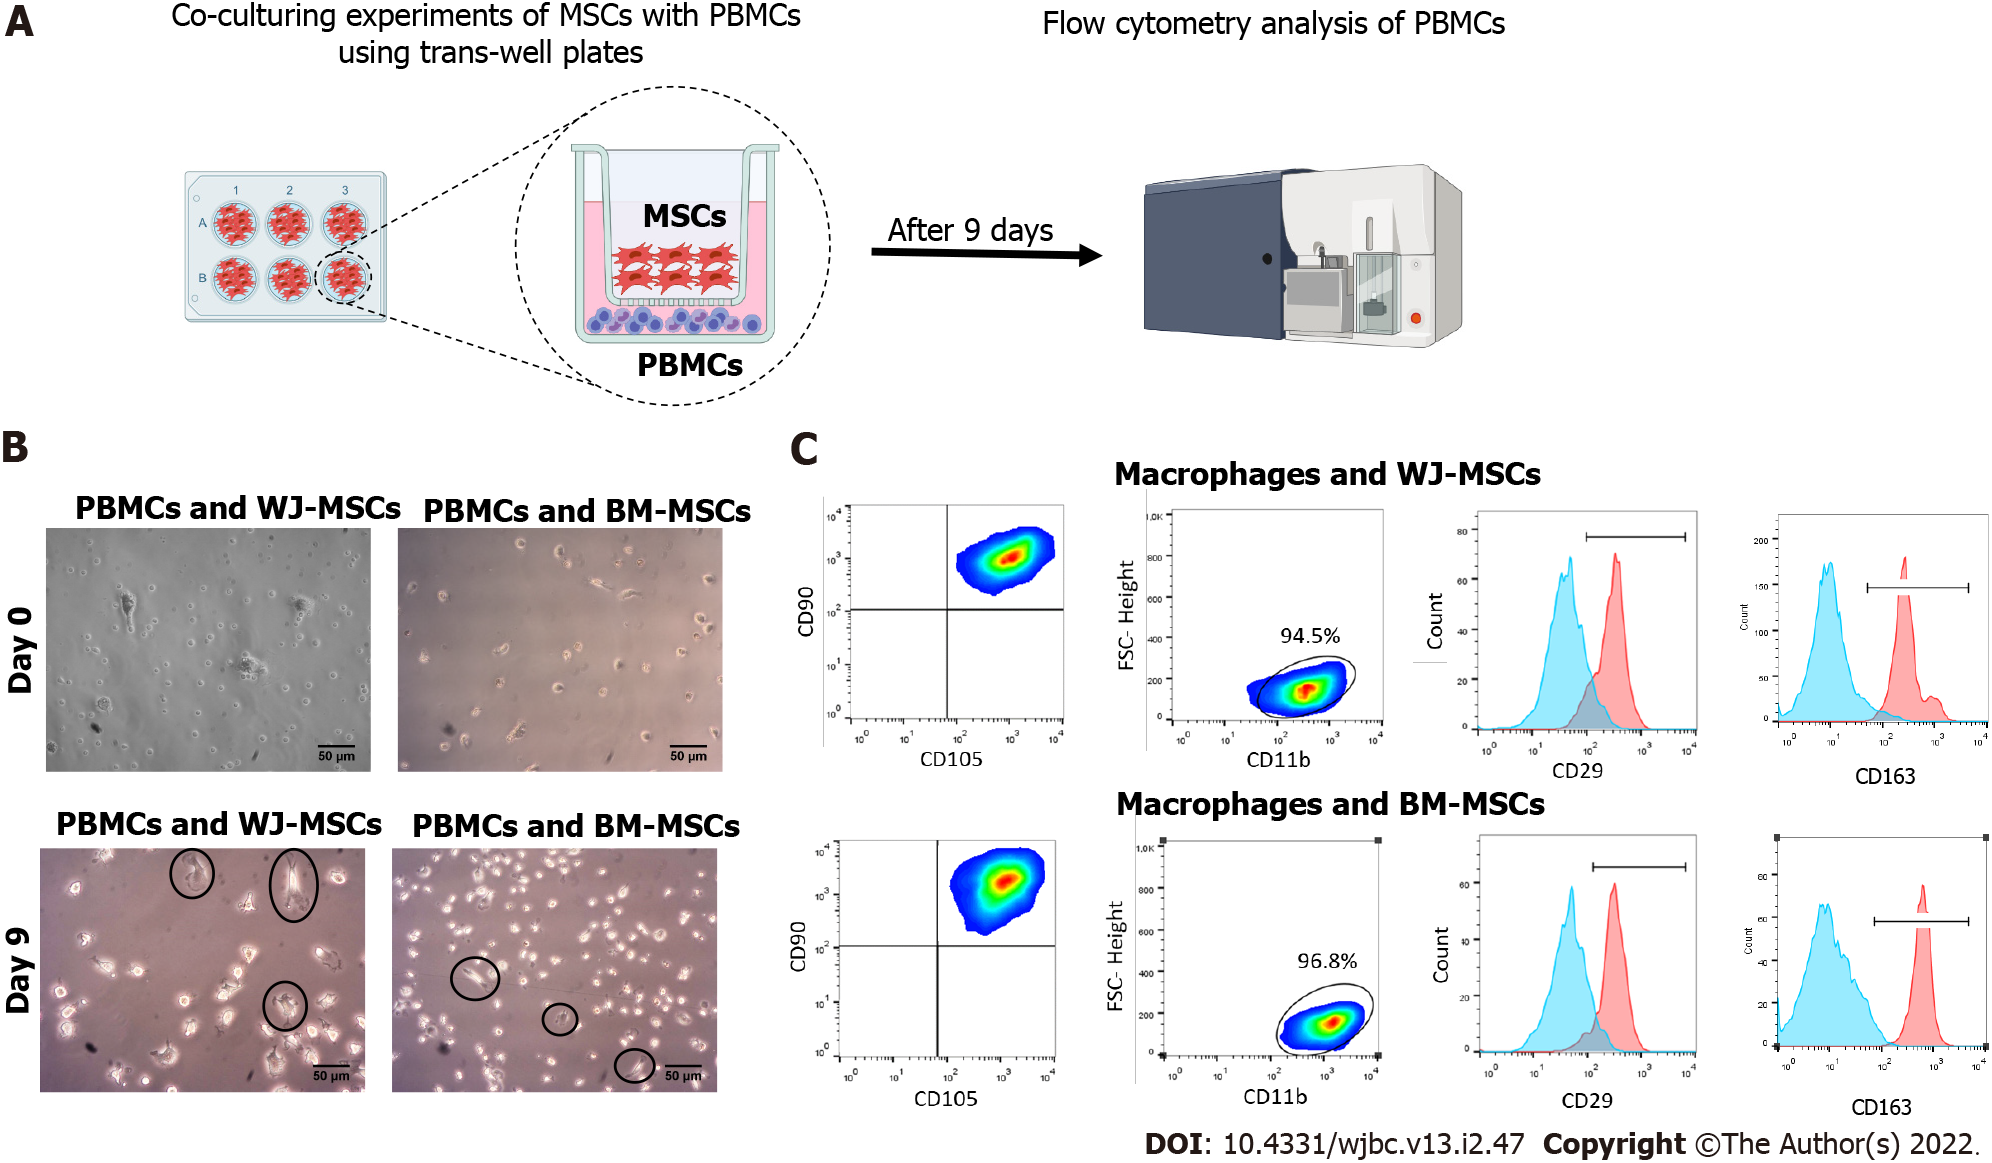
Figure 5 Co-culturing experiments of M1 macrophages with stimulated Wharton’s Jelly and bone marrow-mesenchymal stromal cells.
A: Schematic representation of the experimental workflow; B: Macrophage morphology was changed 9 d after co-culture either with Wharton’s Jelly or bone marrow-mesenchymal stromal cells. After 9 d, macrophages exhibited a more elongated shape and plastic adherence. Black arrows indicate the presence of elongated plastic adherent cells; C: Flow cytometry analysis showed the positive expression of CD45, CD14, and CD11b by the differentiated macrophages. After 9 d, the macrophages exhibited an increase in the CD29 and CD163 expression, compared to the cells at day 0. Statistically significant differences regarding the CD29 and CD163 were observed in M2 compared to M1 macrophages (P < 0.001). BM: Bone marrow; MSCs: Mesenchymal stromal cells; WJ: Wharton’s Jelly; PBMCs: Peripheral blood mononuclear cells.
- Citation: Mallis P, Chatzistamatiou T, Dimou Z, Sarri EF, Georgiou E, Salagianni M, Triantafyllia V, Andreakos E, Stavropoulos-Giokas C, Michalopoulos E. Mesenchymal stromal cell delivery as a potential therapeutic strategy against COVID-19: Promising evidence from in vitro results. World J Biol Chem 2022; 13(2): 47-65
- URL: https://www.wjgnet.com/1949-8454/full/v13/i2/47.htm
- DOI: https://dx.doi.org/10.4331/wjbc.v13.i2.47


