Copyright
©2010 Baishideng Publishing Group Co.
World J Biol Chem. May 26, 2010; 1(5): 95-102
Published online May 26, 2010. doi: 10.4331/wjbc.v1.i5.95
Published online May 26, 2010. doi: 10.4331/wjbc.v1.i5.95
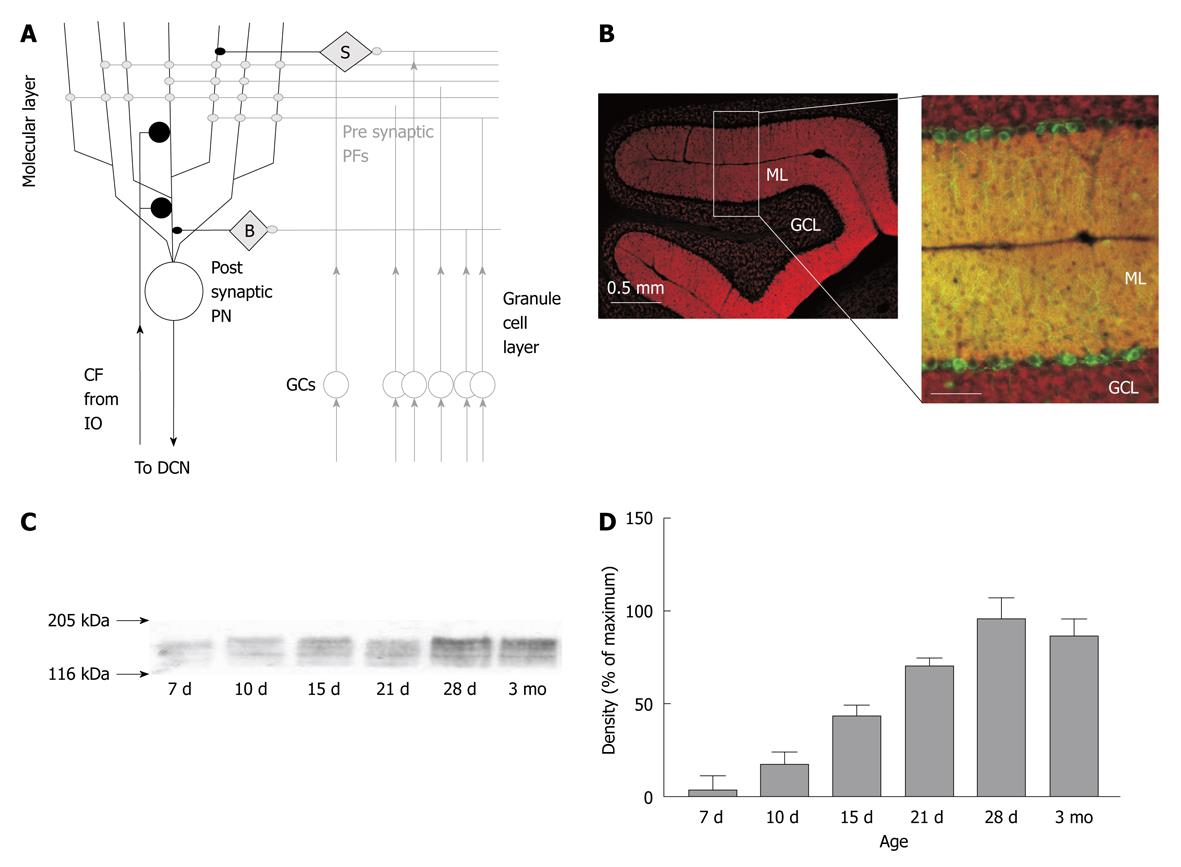
Figure 1 Expression of PMCA2 in the cerebellar cortex.
A: Schematic of cerebellar cortex circuitry and the synapses therein. PN: Purkinje neuron; PF: Parallel fibre; CF: Climbing fibre; GC: Granule cells; IO: Inferior olive; B: Basket cell molecular layer interneuron; S: Stellate cell molecular layer (ML) interneuron; DCN: Deep cerebellar nuclei; B: PMCA2 expression in PNs and GCs from mouse. Left panel is a low magnification image of a sagittal section of the cerebellar cortex, showing rich expression of PMCA2 (red) in the ML and the weaker level of PMCA2 expression in the granule cell layer (GCL). The right panel shows at higher magnification the same pattern of PMCA2 expression in the ML and GCL (red), now with the PNs identified by their expression of parvalbumin, shown in green, and the overlapping expression of PN PV and PMCA2 as yellow, scale bar is 100 microns; C: Increased expression of PMCA2 during increasing post natal days of rat development as detected by western blot (i.e. protein immunoblot) from cerebellar tissue. Arrows represent the approximate position of the molecular weight markers; D: A quantitative estimate of PMCA2 expression from Western blots from cerebellar tissue from up to 4 animals at each time point; values are normalized to maximal expression of PMCA2 in the cerebellum and bars represent mean and error bars ± SE.
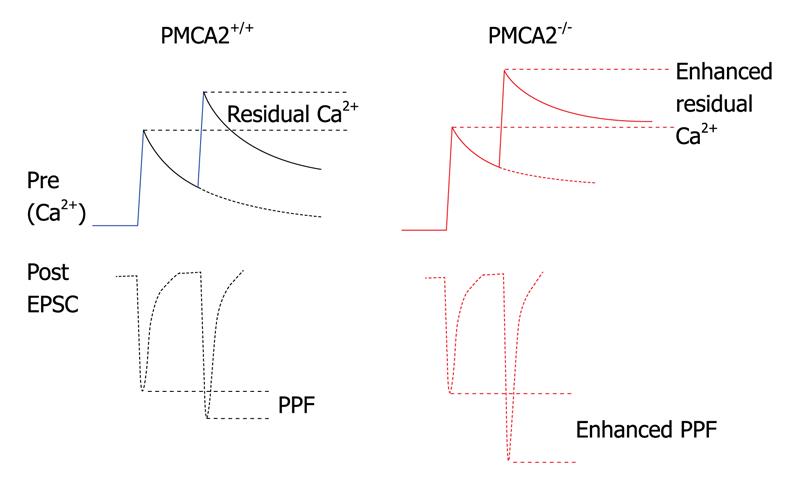
Figure 2 Schematic of the influence of deletion of PMCA2 on “residual” calcium at the PF to PN synapse.
Upper solid traces represent the calcium concentration dynamics in the pre-synaptic terminal in response to a paired stimulation of the PFs; calcium rises once and then again a few milliseconds later. Lower dotted line trace represents the excitatory post synaptic current (EPSC) on the post-synaptic side as a consequence of glutamate released during the rise in calcium in the pre-synaptic terminal; note the larger second EPSC coinciding with the larger peak calcium, the paired pulse facilitation (PPF). In red, in the PMCA2 knockout tissue, calcium rises in the pre-synaptic terminal but then decays more slowly, meaning that on the second stimulation, calcium rises even higher; this is seen as an increase in the peak calcium and also the residual calcium. As a consequence, the second EPSC, dotted lines, lower trace, is larger in amplitude, since more glutamate was released from the PF terminal as a consequence of increased calcium. The recovery of the facilitated EPSCs is also slowed in the PMCA2-/- cerebellum, as residual calcium stays elevated for a longer time in the absence of the PMCA2.
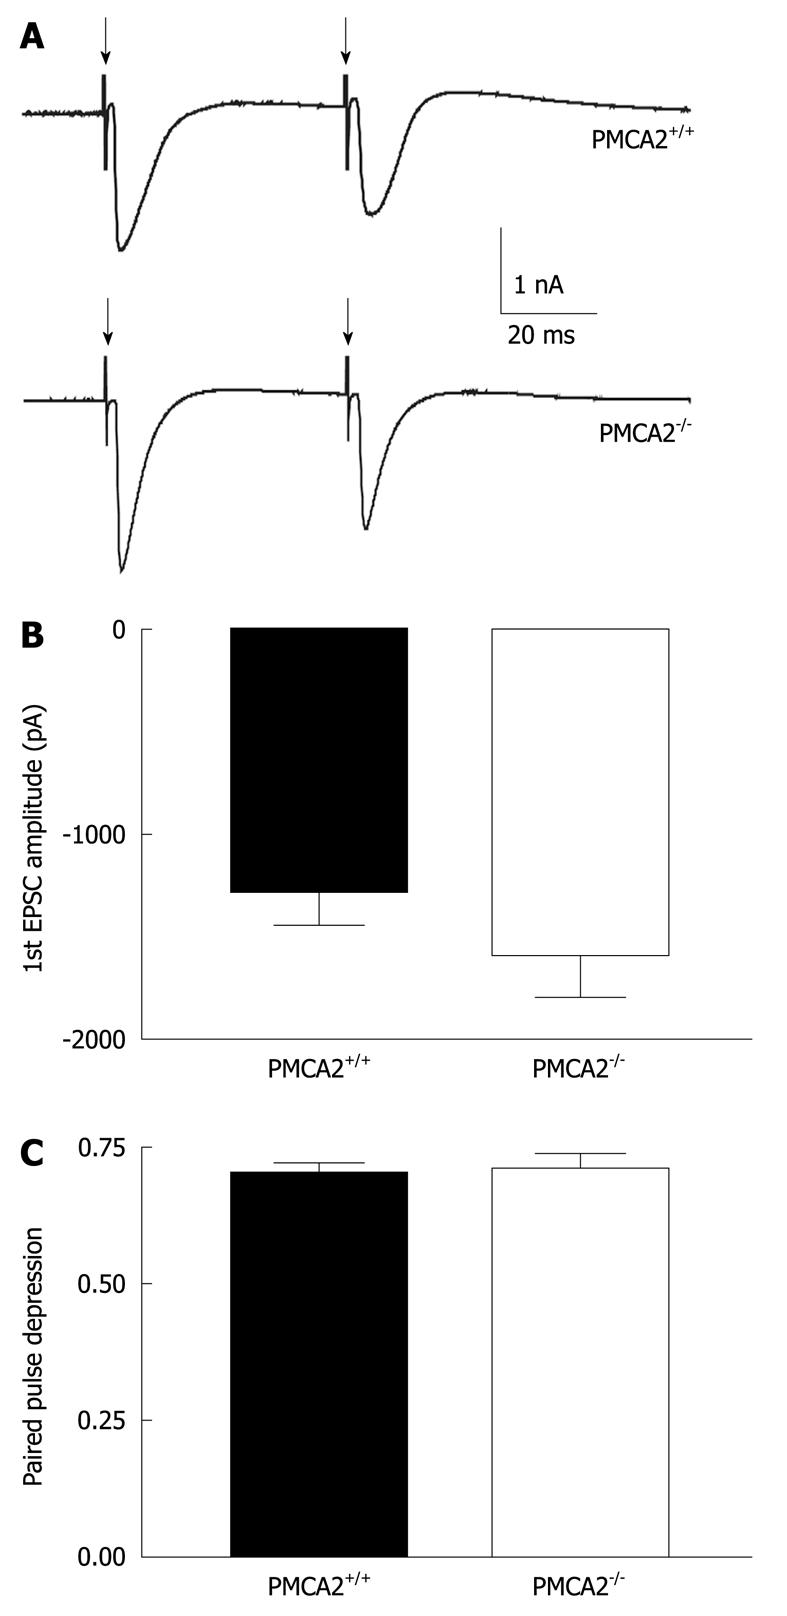
Figure 3 Intact CF evoked excitatory post-synaptic currents in PMCA2-/- PNs.
A: Representative traces of CF-evoked excitatory post-synaptic currents, EPSCs (stimulation shown by downward arrows) from individual mouse PNs voltage clamped at -20 mV. Patch electrodes contained 5mM QX314 to prevent the occurrence of Na+ dependent action potentials. Note that the second response, EPSC was smaller than the first, indicating a relative depression of the second EPSC (paired pulse depression) consistent with the high release probability of glutamate at the CF synapse[21]; B: There was no significant difference in the amplitude of the first EPSC; C: No significant difference in the extent of paired pulse depression. Values are mean ± SE error bars.
Figure 4 Metabotropic glutamate receptor currents are reduced in PNs from PMCA2-/- mice.
Given the interaction between metabotropic glutamate receptors (mGluR1) and PMCA2[24] we tested mGluR1 function using an electrophysiological assay. A: Representative traces of mGluR1 dependent inward currents in response to increasing numbers of 100 Hz stimulation to the PFs[36]. The timing of the stimulation is shown by the vertical arrows. As the number of stimulations increased, the amplitude of the evoked inward current increased, as is evident in the wild type PMCA2+/+ example. In the wild type, the responses to 0, 3, 5, 7 and 9 stimuli are shown for a single cell and for the PMCA2-/- cell the responses to 0, 3, 5, 7, 8 and 9 stimuli are shown. The responses from PMCA2-/- PNs were much reduced both in size and peak response; note the smaller vertical amplitude scale bar in the lower panel. These recordings were made with other ionotropic excitatory and inhibitory synaptic events, pharmacologically blocked, and also in the presence of TBOA to enhance available glutamate by preventing its uptake[26]; as expected the inward currents were abolished by the application of the mGluR1 antagonist, 10 μmol/L CPPCOEt, n = 6. mGluR currents were unaffected by the application of the PMCA inhibitor 10 μmol/L carboxyeosin, n = 3, P = 0.6 paired t-test, data not shown; B: The combined mean data where the increase in the amplitude of the mGluR current in wild type PMCA2+/+ PNs is evident as the number of stimuli increased. Values are mean and error bars are SE, error bars are within the size of the open symbols in the case of the PMCA2-/- data.
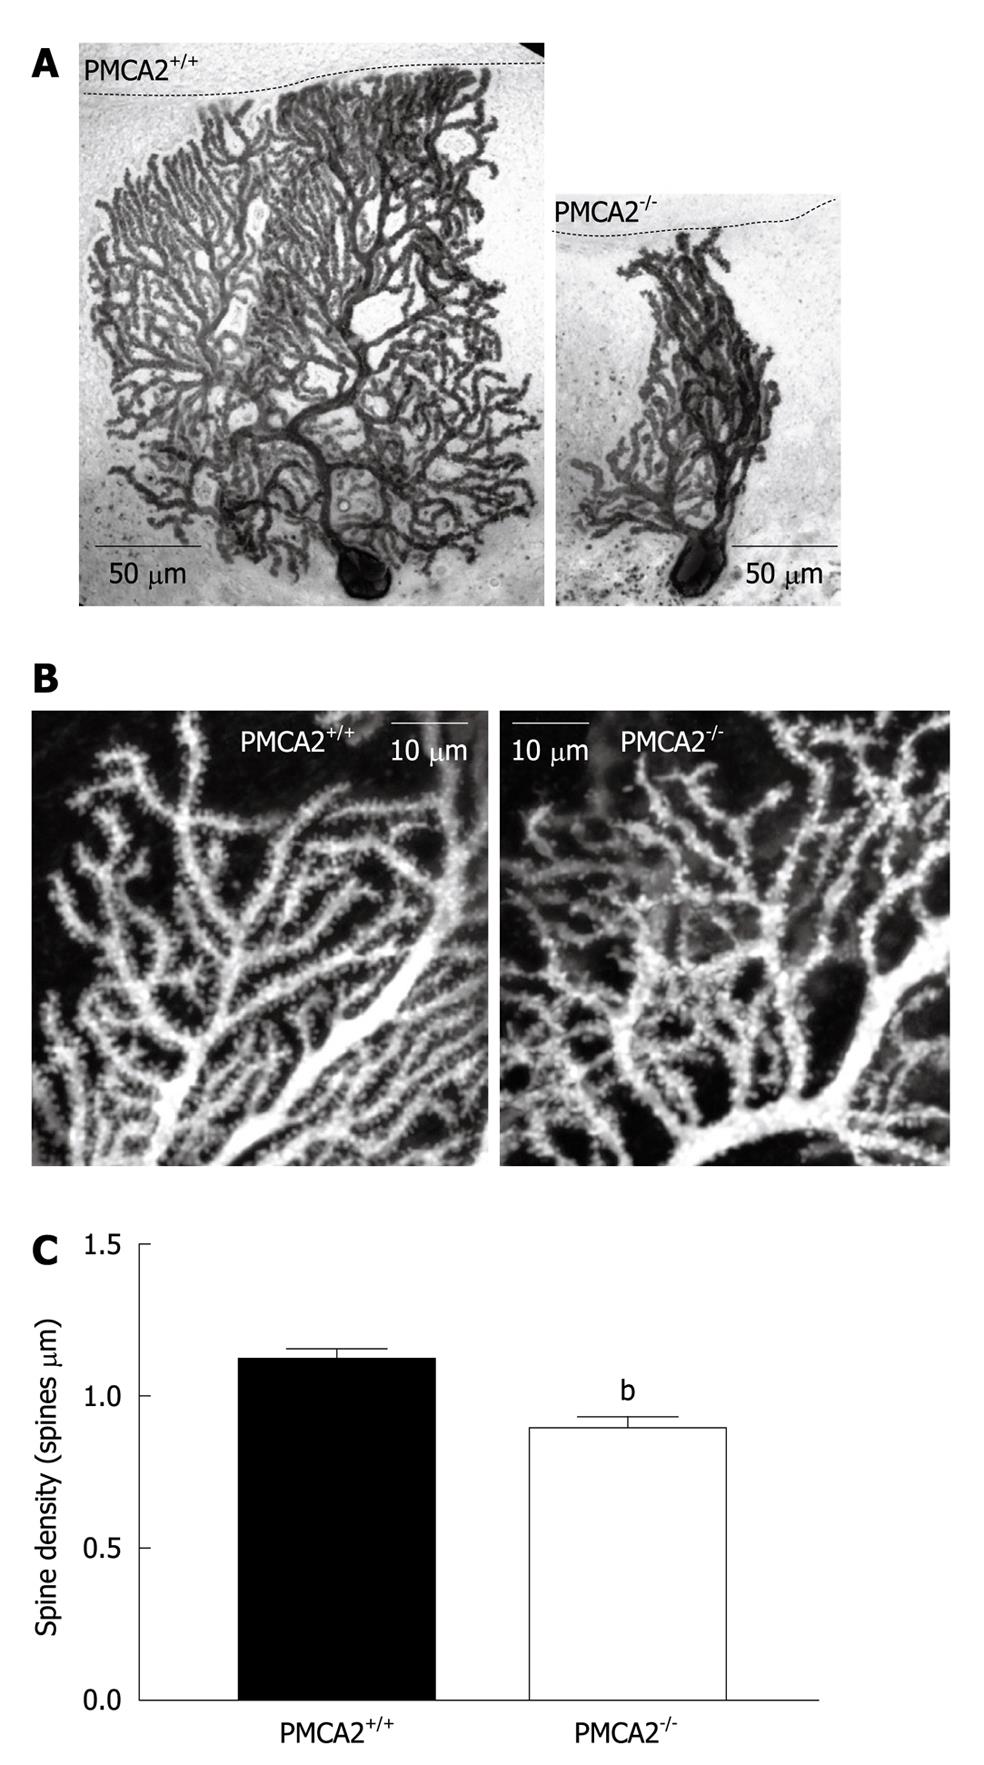
Figure 5 Dendritic morphology of PMCA2-/- PN dendrites is severely disrupted.
A: Representative PNs from wild type PMCA2+/+ (left) and PMCA2-/- (right) cerebellum. Note the reduced thickness of the ML in PMCA2-/- cerebellar cortex, as indicated by the black dashed line and the disorganized dendritic tree. PNs had been previously filled with biocytin during electrophysiological patch clamp recordings. Images shown here are after post-hoc identification of the cells with an anti-biocytin antibody; B: Higher resolution images show the tertiary dendrites in more detail from PNs collected in the same way as in (A). Images are reconstructed from a stack of 20 consecutive confocal slices at 0.1 μm intervals. Spines are visible along these tertiary dendrites in both examples, but the spines on the PMCA2-/- dendrites are less ordered and have lower density. C: The mean values from combined data from more than 90 segments of dendrite are shown, error bars are SE, bP < 0.001.
- Citation: Huang H, Nagaraja RY, Garside ML, Akemann W, Knöpfel T, Empson RM. Contribution of plasma membrane Ca2+ ATPase to cerebellar synapse function. World J Biol Chem 2010; 1(5): 95-102
- URL: https://www.wjgnet.com/1949-8454/full/v1/i5/95.htm
- DOI: https://dx.doi.org/10.4331/wjbc.v1.i5.95


