Copyright
©2010 Baishideng Publishing Group Co.
World J Biol Chem. Apr 26, 2010; 1(4): 41-54
Published online Apr 26, 2010. doi: 10.4331/wjbc.v1.i4.41
Published online Apr 26, 2010. doi: 10.4331/wjbc.v1.i4.41
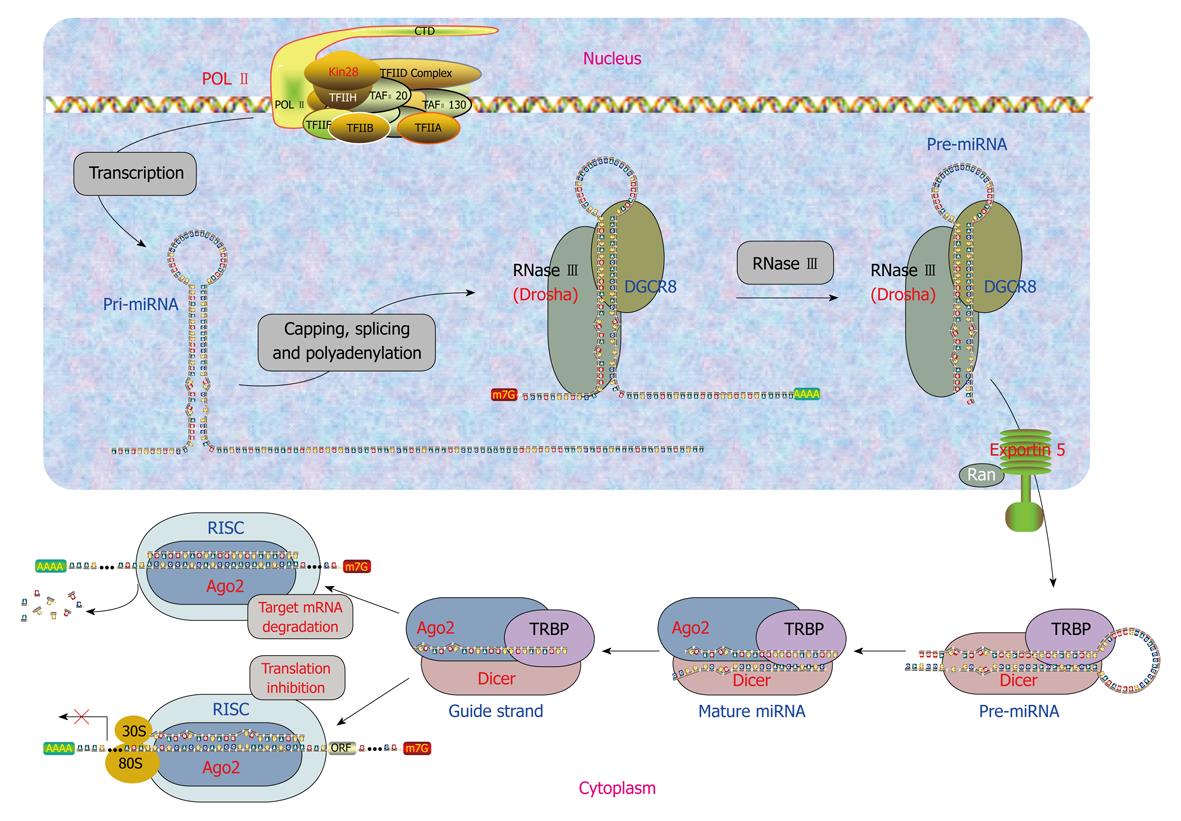
Figure 1 Diagram illustrating the biogenesis pathway of intergenic microRNAs (miRNAs).
Intergenic miRNAs have their own genes and their transcription is likely driven by Pol II. Pol II: polymerase II; Ago: Argonaute protein-2.
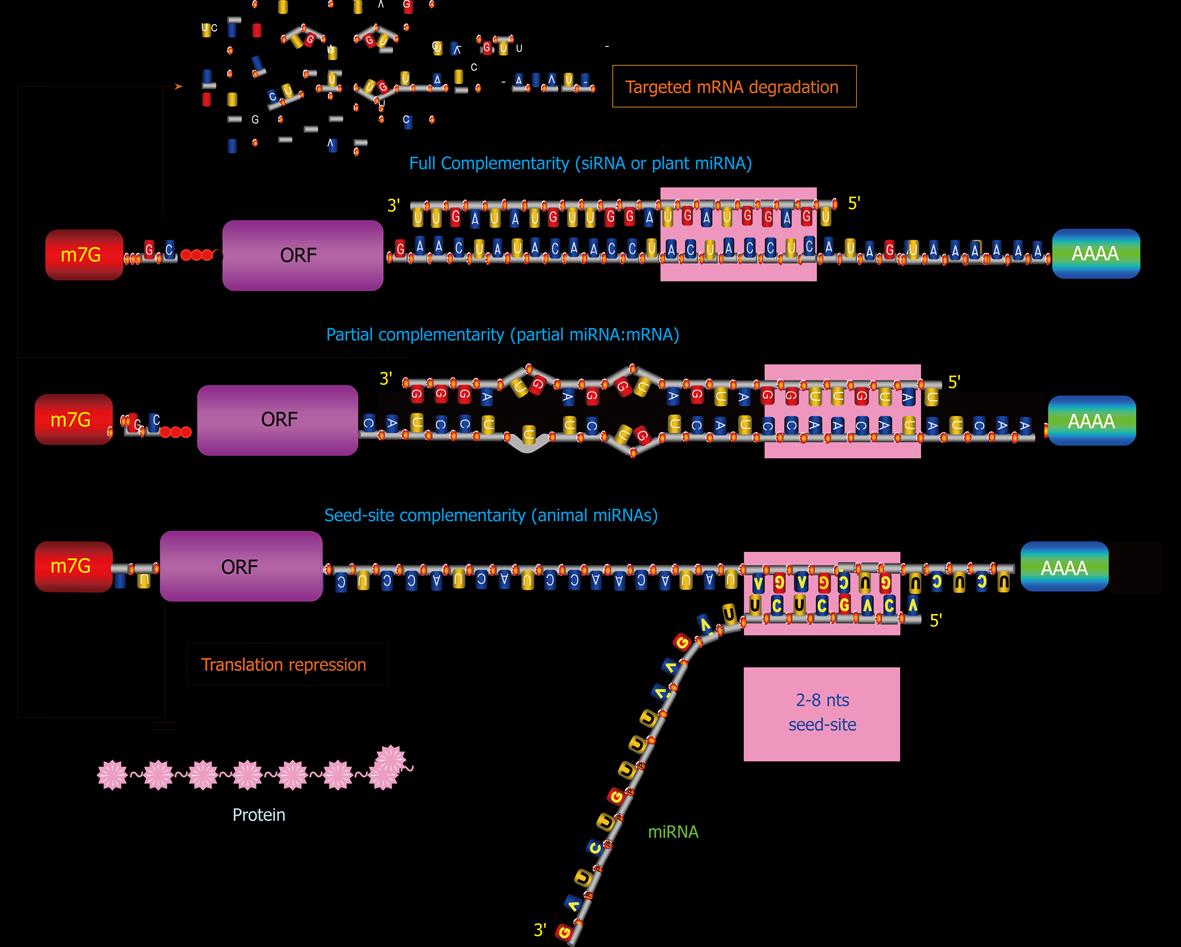
Figure 2 Schematic illustration of mechanisms of action of miRNAs.
Full complementarity between a miRNA and its target mRNA (full miRNA:mRNA) results in targeted mRNA cleavage; seed-site complementarity (seed-site miRNA:mRNA) leads to translation inhibition; and partial complementarity (partial miRNA:mRNA) gives rise to both targeted mRNA degradation and protein translation repression.
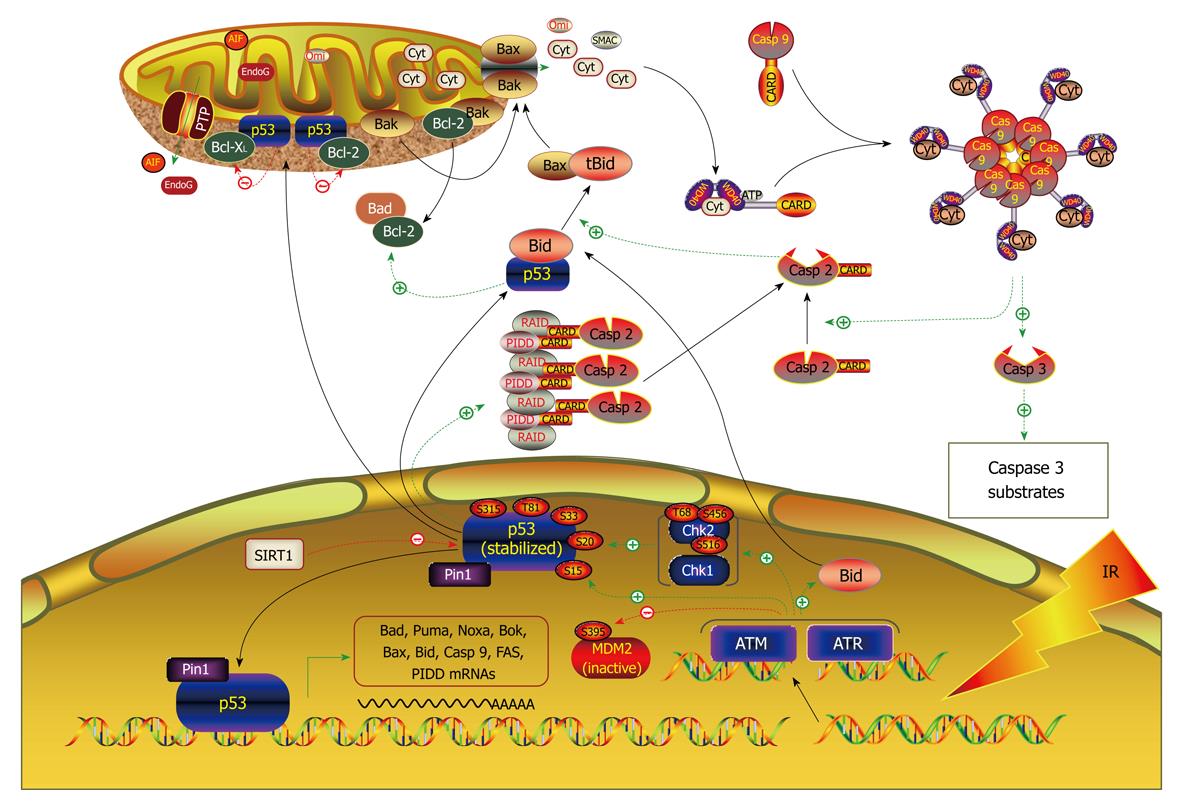
Figure 3 DNA damage and cellular stress-induced apoptosis.
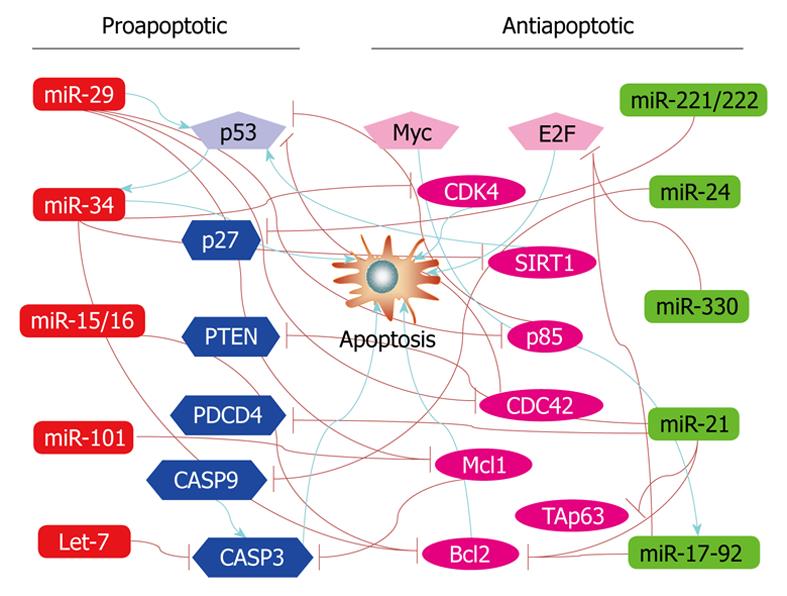
Figure 4 miRNA gene regulatory networks involved in the control of apoptosis of cancer cells.
miRNAs shown in red and green boxes are in general pro-apoptotic and anti-apoptotic, respectively. The activation of genes/miRNAs is indicated by arrows while the targeting of mRNA by miRNA is shown by lines with blocked ends. Oncogenes are indicated in pink and tumor suppressor genes are shown in blue.
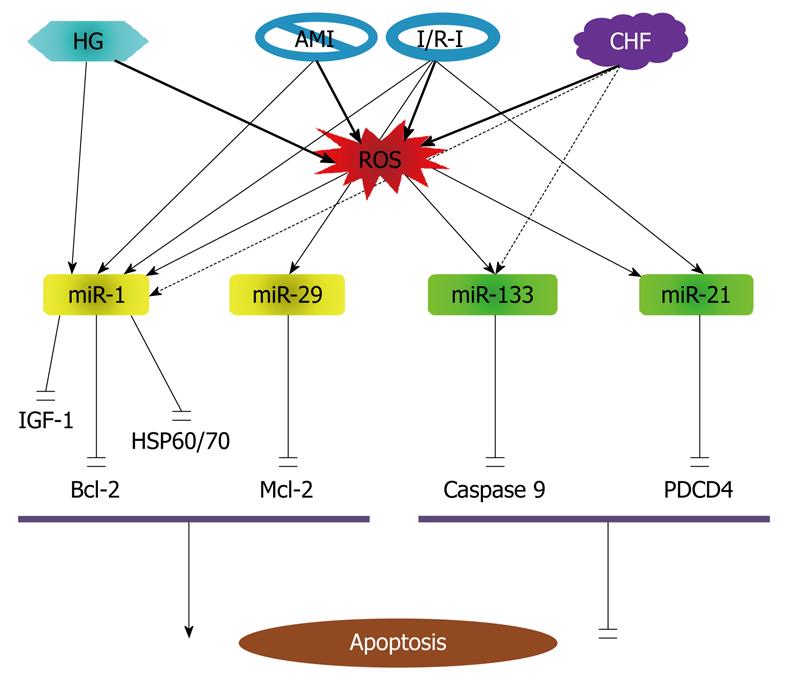
Figure 5 Diagram illustrating the role and signaling mechanisms of miRNAs in apoptosis of cardiac cells.
Solid arrow indicates induction; dashed line indicates inhibition; and pause sign indicates repression. HG: High glucose; AMI: Acute myocardial infarction; I/R-I: Ischemia/reperfusion injury; ROS: Reactive oxygen species.
- Citation: Wang Z. MicroRNA: A matter of life or death. World J Biol Chem 2010; 1(4): 41-54
- URL: https://www.wjgnet.com/1949-8454/full/v1/i4/41.htm
- DOI: https://dx.doi.org/10.4331/wjbc.v1.i4.41


