Published online Apr 27, 2025. doi: 10.4240/wjgs.v17.i4.103696
Revised: January 25, 2025
Accepted: February 18, 2025
Published online: April 27, 2025
Processing time: 91 Days and 23.3 Hours
Preoperative risk assessments are vital for identifying patients at high risk of postoperative mortality. However, traditional scoring systems can be time con
To assess the potential of machine learning algorithms to develop predictive models of mortality risk after abdominal surgery.
This retrospective study included 230 individuals who underwent abdominal surgery at the Seventh People’s Hospital of Shanghai University of Traditional Chinese Medicine between January 2023 and December 2023. Demographic and surgery-related data were collected and used to develop nomogram, decision-tree, random-forest, gradient-boosting, support vector machine, and naïve Bayesian models to predict 30-day mortality risk after abdominal surgery. Models were assessed using receiver operating characteristic curves and compared using the DeLong test.
Of the 230 included patients, 52 died and 178 survived. Models were developed using the training cohort (n = 161) and assessed using the validation cohort (n = 68). The areas under the receiver operating characteristic curves for the nomogram, decision-tree, random-forest, gradient-boosting tree, support vector machine, and naïve Bayesian models were 0.908 [95% confidence interval (CI): 0.824-0.992], 0.874 (95%CI: 0.785-0.963), 0.928 (95%CI: 0.869-0.987), 0.907 (95%CI: 0.837-0.976), 0.983 (95%CI: 0.959-1.000), and 0.807 (95%CI: 0.702-0.911), respectively.
Nomogram, random-forest, gradient-boosting tree, and support vector machine models all demonstrate strong performances for the prediction of postoperative mortality and can be selected based on the clinical circumstances.
Core Tip: Individuals vary in terms of surgical risk, and assessments must be performed to evaluate this risk in order to provide all patients with the most appropriate perioperative care. Current risk assessments can be time consuming; we therefore aimed to use artificial intelligence to develop a model to predict the risk of 30-day mortality in patients undergoing abdominal surgery. Data from patients that underwent abdominal surgery in our hospital were used to construct six separate models with different machine learning algorithms. Four of the models demonstrated strong predictive performance, suggesting their potential clinical application.
- Citation: Yuan JH, Jin YM, Xiang JY, Li SS, Zhong YX, Zhang SL, Zhao B. Machine learning-based prediction of postoperative mortality risk after abdominal surgery. World J Gastrointest Surg 2025; 17(4): 103696
- URL: https://www.wjgnet.com/1948-9366/full/v17/i4/103696.htm
- DOI: https://dx.doi.org/10.4240/wjgs.v17.i4.103696
The rapid progress in modern medicine has increased the use of surgical interventions in the treatment of diseases. Currently, over 60 million people are admitted to Chinese healthcare facilities as inpatients each year, and this figure is rising. Optimal perioperative care is dependent on the use of accurate preoperative risk assessments to quickly identify high-risk patients and provide timely interventions. Consideration of risk factors allows the formulation of personalized patient management plans, enabling the efficient allocation of healthcare resources. This strategy significantly reduces the likelihood of postoperative complications and mortality[1,2]. Traditional preoperative risk assessments rely heavily on statistical scoring systems, which can be time consuming. There is therefore a pressing need for a rapid and objective method to assess and predict surgical risk. Over the past few years, remarkable progress has been made in the use of artificial intelligence (AI) in numerous fields, especially healthcare. Innovations in wearable technology, intelligent healthcare systems, medical imaging analysis, genetic data mining, biotechnological applications, health management, and risk prediction have changed conventional medical models and spurred advancements in contemporary medicine[3,4]. Machine learning, a key component of AI, has the potential to analyze vast medical datasets[5,6]. In the context of mortality risk prediction, machine learning is primarily concerned with enhancing model accuracy[7]. The present study utilized an extensive hospital data research platform to identify patients who died following abdominal surgery performed under general anesthesia. Comparing the data of patients who died and those who survived using logistic regression analyses identified significant risk factors. The primary objective of this study was to construct a predictive model of 30-day mortality risk in patients undergoing abdominal surgery using six of the most prevalent ensemble learning algorithms. This study aimed to offer innovative insights into the early detection of high-risk patients to facilitate targeted interventions.
Individuals who underwent initial abdominal surgery under general anesthesia at the Seventh People’s Hospital of Shanghai University of Traditional Chinese Medicine between January 2023 and December 2023 were considered for inclusion in this study. The inclusion criteria were as follows: (1) Various types of abdominal surgeries, including liver, gallbladder, pancreas, spleen, gastrointestinal, and colorectal surgeries, performed under general anesthesia; and (2) Death, if it occurred, occurred in hospital after surgery. The exclusion criteria were as follows: (1) Non-abdominal sur
Data on the time of death of the included patients were collected, as were data on factors at admission that could impact patient prognosis, including sex; age; body mass index; whether emergency surgery was performed; previous abdominal surgeries; smoking history; drinking history; presence of hypertension or diabetes; surgical approach; American Society of Anesthesiologists (ASA) classification; abnormal electrocardiogram findings; preoperative complications; systolic blood pressure; diastolic blood pressure; prothrombin time; activated partial thromboplastin time (APTT); albumin/globulin ratio; levels of D-dimer, fibrinogen, aspartate aminotransferase (AST), blood urea nitrogen, total bile acid, albumin, blood creatinine, total bilirubin (TBIL), blood calcium, blood sodium, blood potassium, and hemoglobin; counts of blood neutrophils, lymphocytes, white blood cells (WBC), and platelets; operation type; and operation duration.
R software (The R Foundation for Statistical Computing, Vienna, Austria) was used to construct the predictive models. The patients were randomly allocated to training (n = 161) or validation (n = 69) cohorts at a ratio of 7:3. Data from the training cohort were used to develop a model, and data from the validation cohort were used to assess its predictive capabilities. The dependent variable of the model was mortality within 30 days of the surgical intervention. The predictive ability of the model was evaluated by determining its accuracy, sensitivity, specificity, recall, precision, and area under the receiver operating characteristic (ROC) curve (AUC). The R packages “rms”, “rpart”, “randomForest”, “gbm”, and “e1071” were used to create nomogram (rms), decision-tree (rpart), random-forest (randomForest), gradient-boosting tree (gbm), support vector machine (e1071) and naive Bayes (e1071) models, respectively.
Statistical analyses were performed using statistical product and service solutions software version 23.0 (IBM Corporation, Armonk, NY, United States). Normally distributed measurement data are expressed as the mean ± SD, and a t-test was used to compare the groups. Categorical data are expressed as percentages, with group comparisons made using the χ2 test. The closer the AUC value was to 1, the higher the accuracy of the diagnostic test; the AUC for each model was compared using the DeLong test. Statistical significance was defined as P < 0.05.
Of the 230 patients included in the study, 52 (22.61%) died within 30 days after surgery (death group) and 178 (77.39%) survived this period (survival group). The two groups differed significantly in terms of age, surgical approach, ASA classification, preoperative complications, APTT, AST level, TBIL level, and WBC count (P < 0.05). The remaining factors analyzed did not significantly differ between the two groups (P > 0.05), as presented in Table 1.
| Index | Death (n = 52) | Survival (n = 178) | t/χ2 | P value |
| Sex | 0.025 | 0.875 | ||
| Male | 27 (51.92) | 95 (53.37) | ||
| Female | 25 (48.08) | 83 (46.63) | ||
| Age, years | 59.21 ± 5.26 | 57.34 ± 6.14 | 1.990 | 0.048 |
| BMI, kg/m2 | 23.50 ± 2.73 | 23.89 ± 2.95 | -0.839 | 0.403 |
| Emergency surgery | 1.525 | 0.217 | ||
| Yes | 19 (36.54) | 48 (26.97) | ||
| No | 33 (63.46) | 130 (73.03) | ||
| Previous abdominal surgery | 0.073 | 0.787 | ||
| Yes | 14 (26.92) | 45 (25.28) | ||
| No | 38 (73.08) | 133 (74.72) | ||
| Smoking | 0.303 | 0.582 | ||
| Yes | 10 (19.23) | 40 (22.47) | ||
| No | 42 (80.77) | 138 (77.53) | ||
| Drinking | 0.014 | 0.904 | ||
| Yes | 24 (46.15) | 81 (45.51) | ||
| No | 28 (53.85) | 97 (54.49) | ||
| Hypertension | 0.115 | 0.735 | ||
| Yes | 5 (9.62) | 19 (10.67) | ||
| No | 47 (90.38) | 159 (89.33) | ||
| Diabetes | 0.031 | 0.861 | ||
| Yes | 18 (34.62) | 59 (33.15) | ||
| No | 34 (65.38) | 119 (66.85) | ||
| Surgical approach | 7.209 | 0.007 | ||
| Laparoscopic | 23 (44.23) | 111 (62.36) | ||
| Laparotomy/conversion | 29 (55.77) | 67 (37.64) | ||
| ASA classification | 10.011 | 0.040 | ||
| I | 3 (5.77) | 9 (5.06) | ||
| II | 27 (51.92) | 130 (73.03) | ||
| III | 12 (23.08) | 26 (14.61) | ||
| IV | 9 (17.31) | 8 (4.49) | ||
| V | 1 (1.92) | 5 (2.81) | ||
| Abnormal ECG | 1.792 | 0.181 | ||
| Yes | 27 (51.92) | 73 (41.01) | ||
| No | 25 (48.08) | 105 (58.99) | ||
| Preoperative complications | 8.136 | 0.004 | ||
| Yes | 16 (30.77) | 26 (14.61) | ||
| No | 36 (69.23) | 152 (85.39) | ||
| SBP, mmHg | 127.94 ± 7.53 | 128.59 ± 6.04 | -0.642 | 0.522 |
| DBP, mmHg | 74.44 ± 5.27 | 75.20 ± 6.15 | -0.809 | 0.420 |
| D-dimer, mg/L | 1.18 ± 0.35 | 1.13 ± 0.20 | 1.120 | 0.264 |
| PT, second | 12.29 ± 3.15 | 11.90 ± 2.38 | 0.948 | 0.344 |
| APTT, second | 32.33 ± 2.83 | 27.04 ± 3.46 | 10.077 | < 0.001 |
| FBG, g/L | 3.31 ± 0.74 | 3.38 ± 0.89 | -0.503 | 0.616 |
| AST, IU/L | 43.50 ± 14.51 | 37.46 ± 9.72 | 3.489 | 0.001 |
| BUN, mmol/L | 5.63 ± 0.63 | 5.53 ± 0.69 | 0.993 | 0.322 |
| TBA, μmol/L | 10.55 ± 2.32 | 10.12 ± 1.96 | 1.323 | 0.187 |
| ALB, g/L | 34.99 ± 5.94 | 35.81 ± 5.45 | -0.934 | 0.351 |
| A/G ratio | 1.24 ± 0.29 | 1.32 ± 0.27 | -1.800 | 0.073 |
| Cre, μmol/L | 69.61 ± 9.07 | 68.25 ± 8.09 | 1.036 | 0.301 |
| TBIL, μmol/L | 26.07 ± 3.82 | 20.38 ± 4.42 | 8.400 | < 0.001 |
| Blood calcium, mmol/L | 2.17 ± 0.14 | 2.16 ± 0.17 | 0.447 | 0.655 |
| Blood sodium, mmol/L | 140.13 ± 3.35 | 140.98 ± 3.29 | -1.654 | 0.099 |
| Blood potassium, mmol/L | 3.82 ± 0.38 | 3.81 ± 0.40 | 0.103 | 0.918 |
| NEUT, × 109/L | 5.13 ± 0.79 | 4.98 ± 0.56 | 1.486 | 0.139 |
| LYMPH, × 109/L | 1.21 ± 0.25 | 1.28 ± 0.33 | -1.393 | 0.165 |
| WBC, × 109/L | 11.84 ± 3.94 | 9.72 ± 3.44 | 3.774 | < 0.001 |
| PLT, × 109/L | 191.35 ± 63.09 | 194.91 ± 50.82 | -0.420 | 0.675 |
| Hb, g/L | 116.75 ± 5.89 | 116.40 ± 5.78 | 0.384 | 0.701 |
| Operation type | ||||
| Emergency | 2 (3.85) | 1 (0.56) | 3.104 | 0.541 |
| Urgent | 9 (17.31) | 36 (20.22) | ||
| Semi-urgent | 12 (23.08) | 45 (25.28) | ||
| Non-urgent | 11 (21.15) | 28 (15.73) | ||
| Elective | 18 (34.62) | 68 (38.20) | ||
| Operation time, hour | 2.52 ± 1.09 | 2.54 ± 1.03 | -0.103 | 0.918 |
Multivariate logistic regression analysis was performed using the binary outcome of survival for 30 days post-surgery as the dependent variable, where 1 signified death and 0 signified survival. Variables that demonstrated statistical significance in the univariate analysis were incorporated into the multivariate logistic regression model. Categorical variables were coded as follows: Surgical approach (laparoscopic surgery = 1, laparotomy/conversion to laparotomy = 2), ASA classification (I = 1, II = 2, III = 3, IV = 4, and V = 5), and preoperative complications (yes = 1, no = 0). The actual numerical values were entered for continuous variables, including age, APTT, AST level, TBIL level, and WBC count. Age, APTT, AST level, TBIL level, and WBC count were identified as significant predictors of postoperative mortality in patients who underwent abdominal surgery (P < 0.05), as shown in Table 2. The predictive model was formulated, based on the results of the multivariate regression analysis, as Y = 4.880 - 0.609 (age) + 0.533 (APTT) + 0.172 (AST level) + 0.174 (TBIL level) + 0.183 (WBC count). For example, for every unit increase in the patient’s APTT value, the log odds ratio (OR) of postoperative death increases by 0.533 (β = 0.533), and the risk of death increases by 1.705 times [OR = 1.705; 95% confidence interval (CI): 1.379-2.107].
| Index | B | SE | Wald | P value | OR | 95%CI |
| Age | -0.609 | 0.146 | 17.291 | < 0.001 | 0.544 | 0.408-0.725 |
| Surgical approach | 0.305 | 0.495 | 0.380 | 0.538 | 1.357 | 0.514-3.582 |
| Preoperative complications | -0.172 | 0.605 | 0.081 | 0.776 | 0.842 | 0.257-2.753 |
| APTT | 0.533 | 0.108 | 24.360 | < 0.001 | 1.705 | 1.379-2.107 |
| AST | 0.172 | 0.062 | 7.681 | 0.006 | 1.188 | 1.052-1.341 |
| TBIL | 0.174 | 0.078 | 4.962 | 0.026 | 1.190 | 1.021-1.387 |
| ASA classification | 0.119 | 0.300 | 0.158 | 0.691 | 1.127 | 0.626-2.030 |
| WBC | 0.183 | 0.074 | 6.154 | 0.013 | 1.201 | 1.039-1.388 |
| Constant | 4.880 | 5.475 | 0.794 | 0.373 | 131.566 |
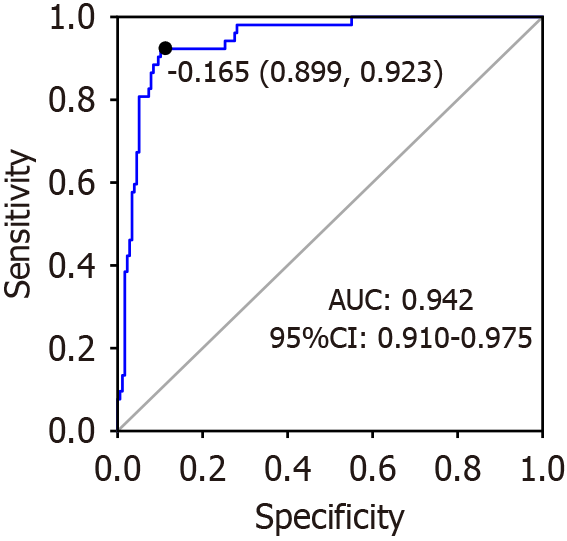
The ROC curve of the ability of the constructed model to predict the risk of postoperative mortality in patients who underwent abdominal surgery is presented in Figure 1. The AUC was 0.942, with a 95%CI ranging from 0.910 to 0.975. On the ROC curve, the comprehensive performance of the model can reach a relatively optimal threshold point. The optimal threshold was identified as -0.165, which was associated with a sensitivity (the proportion of those correctly diagnosed as ill) of 0.923 and a specificity (the proportion of individuals correctly diagnosed as healthy) of 0.899.
Comparison of the training and validation cohorts showed no significant differences between the groups in terms of the identified predictors of postoperative mortality (P < 0.05) (Table 3).
| Index | Training cohort (n = 161) | Validation cohort (n = 69) | t | P value |
| Age | 57.67 ± 5.80 | 57.99 ± 6.46 | -0.364 | 0.716 |
| APTT | 28.16 ± 4.00 | 28.41 ± 3.99 | -0.424 | 0.672 |
| AST | 38.41 ± 10.75 | 39.80 ± 12.33 | -0.860 | 0.391 |
| TBIL | 21.44 ± 4.75 | 22.20 ± 5.24 | -1.081 | 0.281 |
| WBC | 10.33 ± 3.59 | 9.88 ± 3.84 | 0.856 | 0.393 |
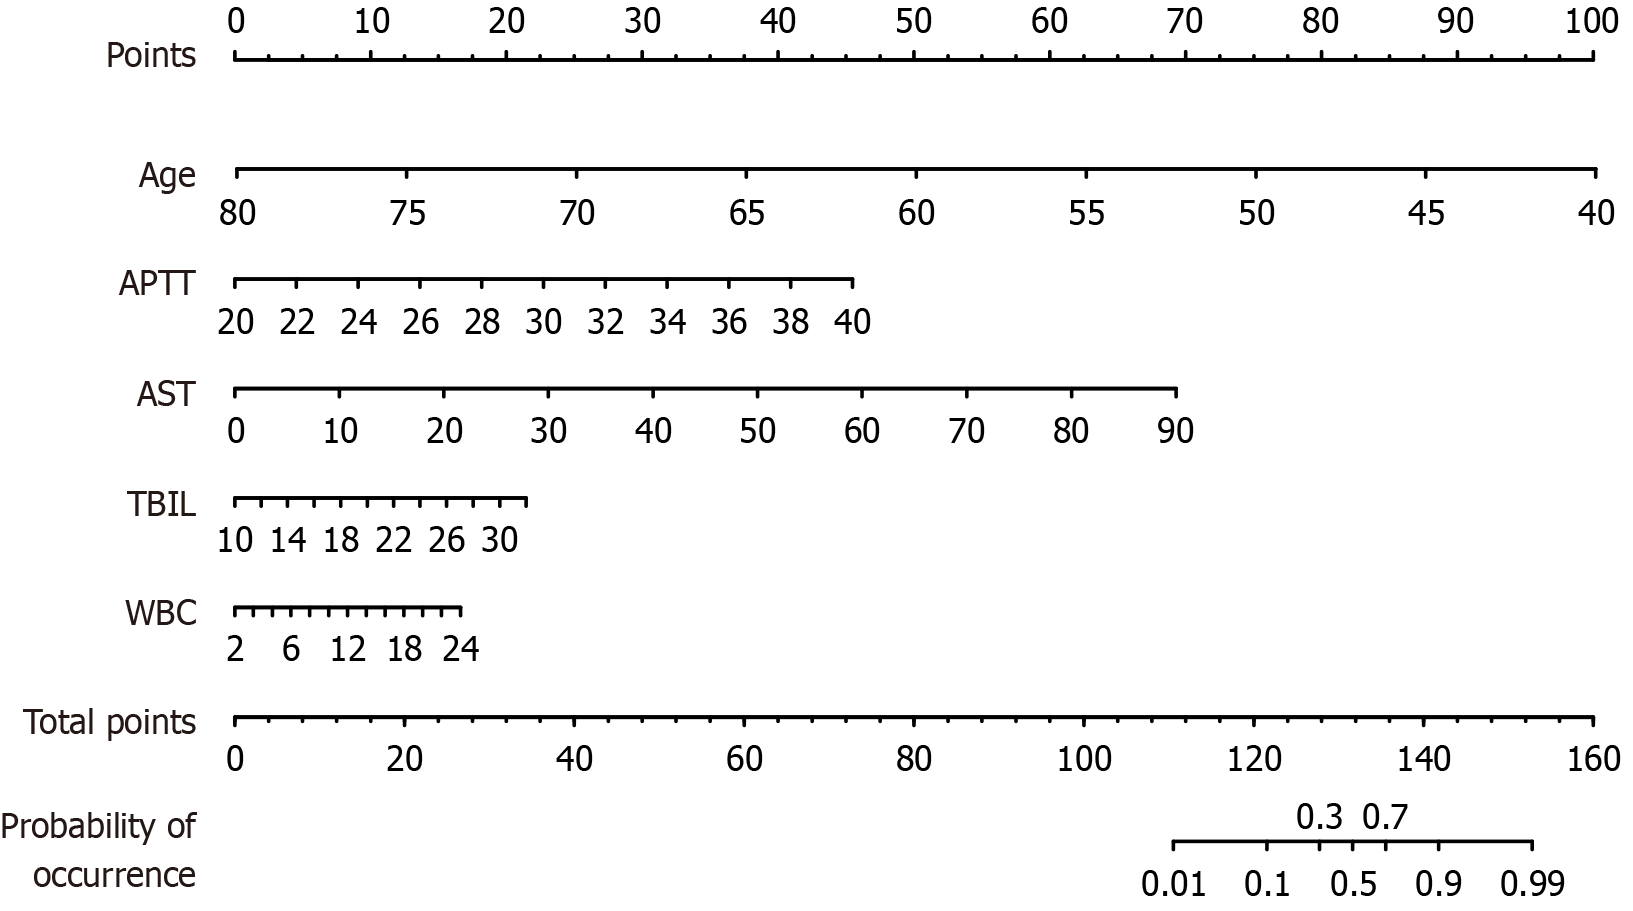
Using the five significant predictors identified by multivariate logistic regression, a nomogram for postoperative mortality after abdominal surgery was developed using training cohort data (Figure 2). As an example, a patient aged 65 years, with an APTT of 32 seconds, an AST level of 60.23 IU/L, a TBIL level of 18.42 μmol/L, and a WBC count of 12 ×
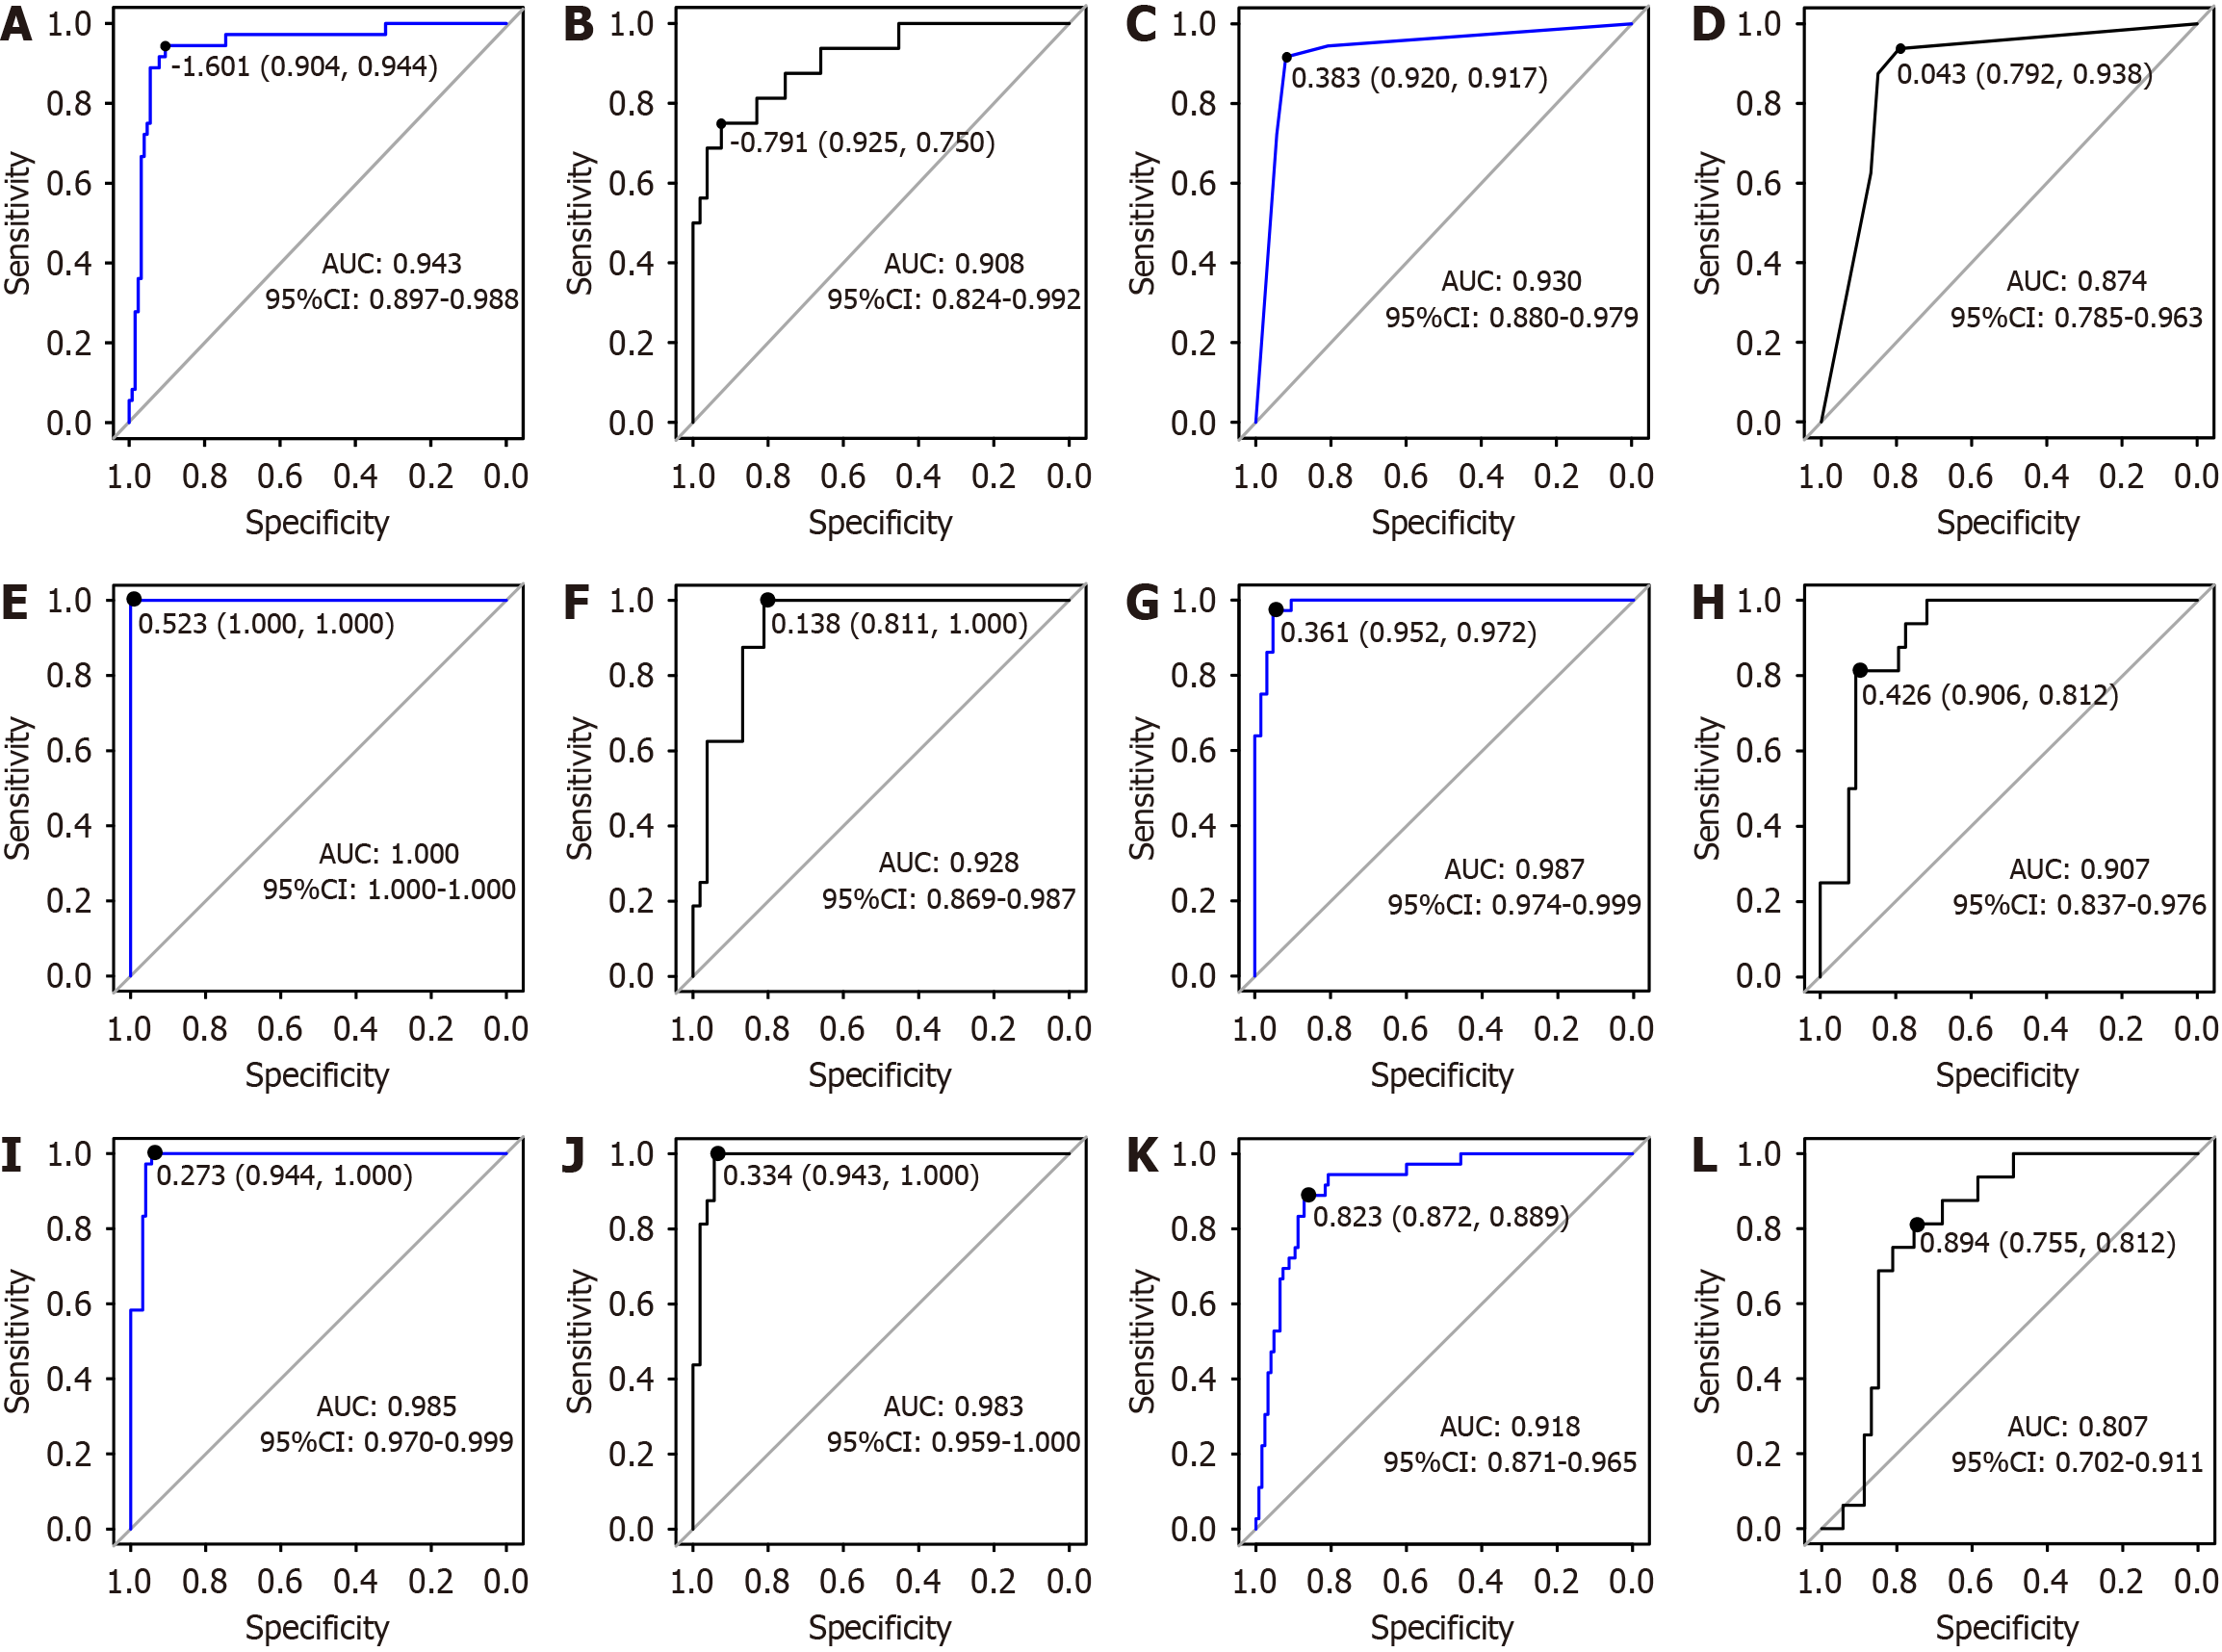
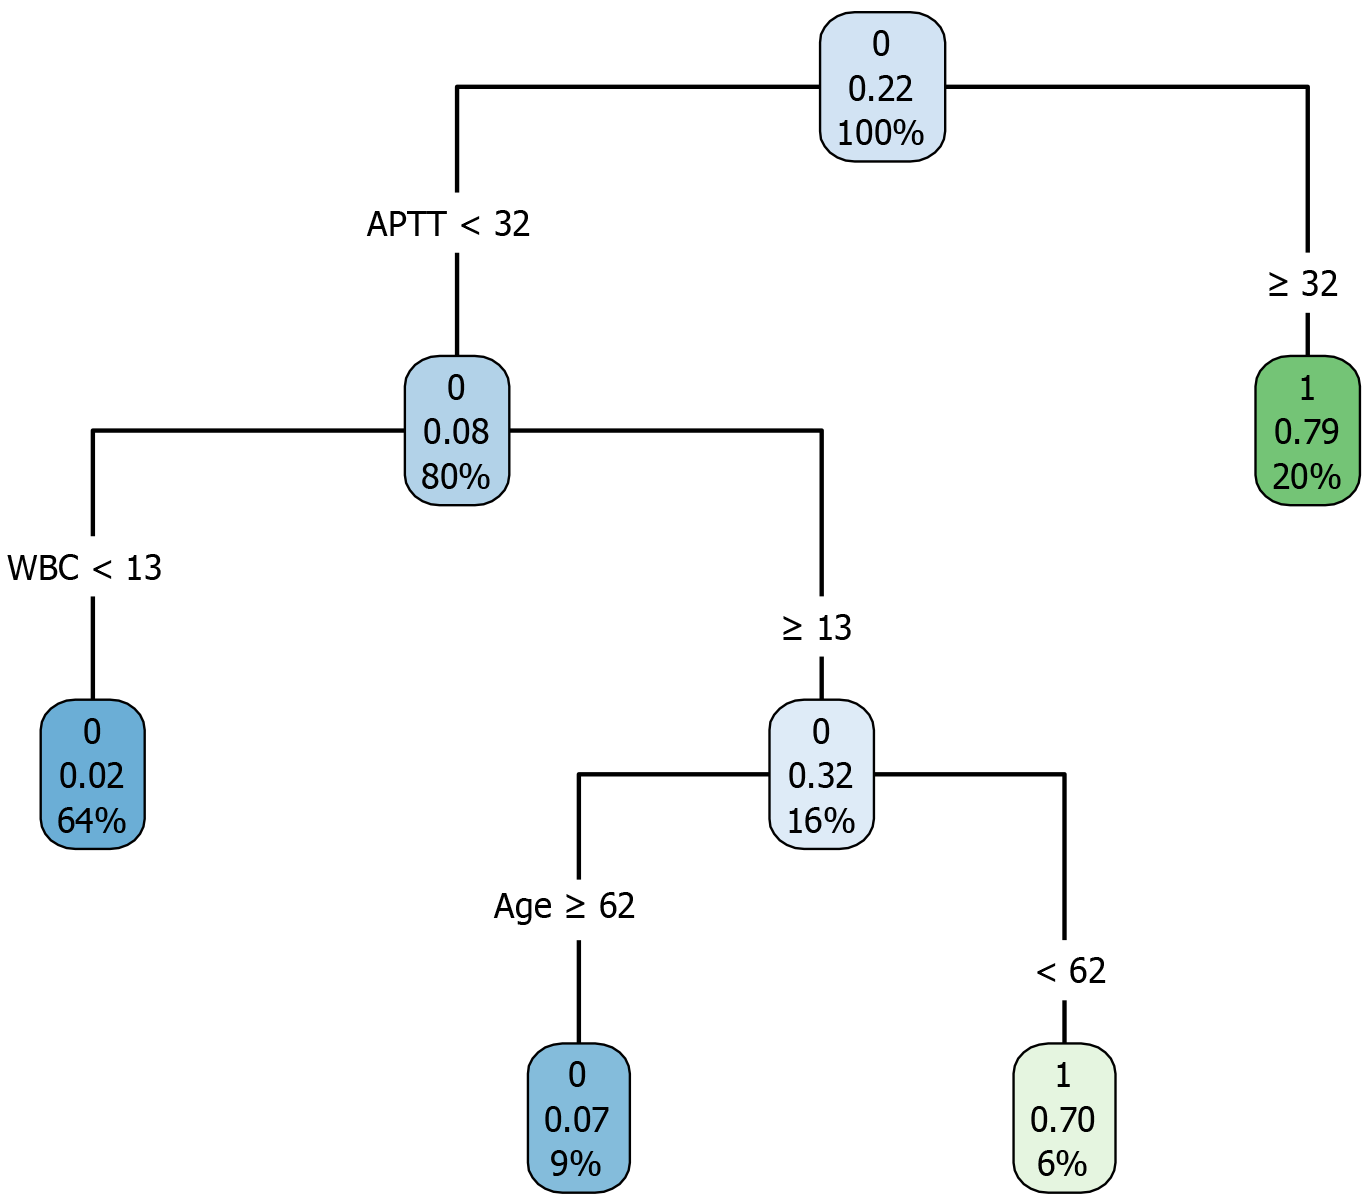
A decision-tree model was established using the training cohort, as illustrated in Figure 4. As an example, a patient aged 58 years presenting with an APTT of 29 seconds and a WBC count of 14 × 109/L would have an estimated probability of postoperative mortality of 6%. ROC curve analysis indicated that the AUC for the decision-tree model was 0.930 (95%CI: 0.880-0.979), with a specificity of 0.920 and a sensitivity of 0.917. In the validation cohort, the AUC was 0.874 (95%CI: 0.785-0.963), with a specificity of 0.792 and a sensitivity of 0.938, as demonstrated in Figure 3C and D.
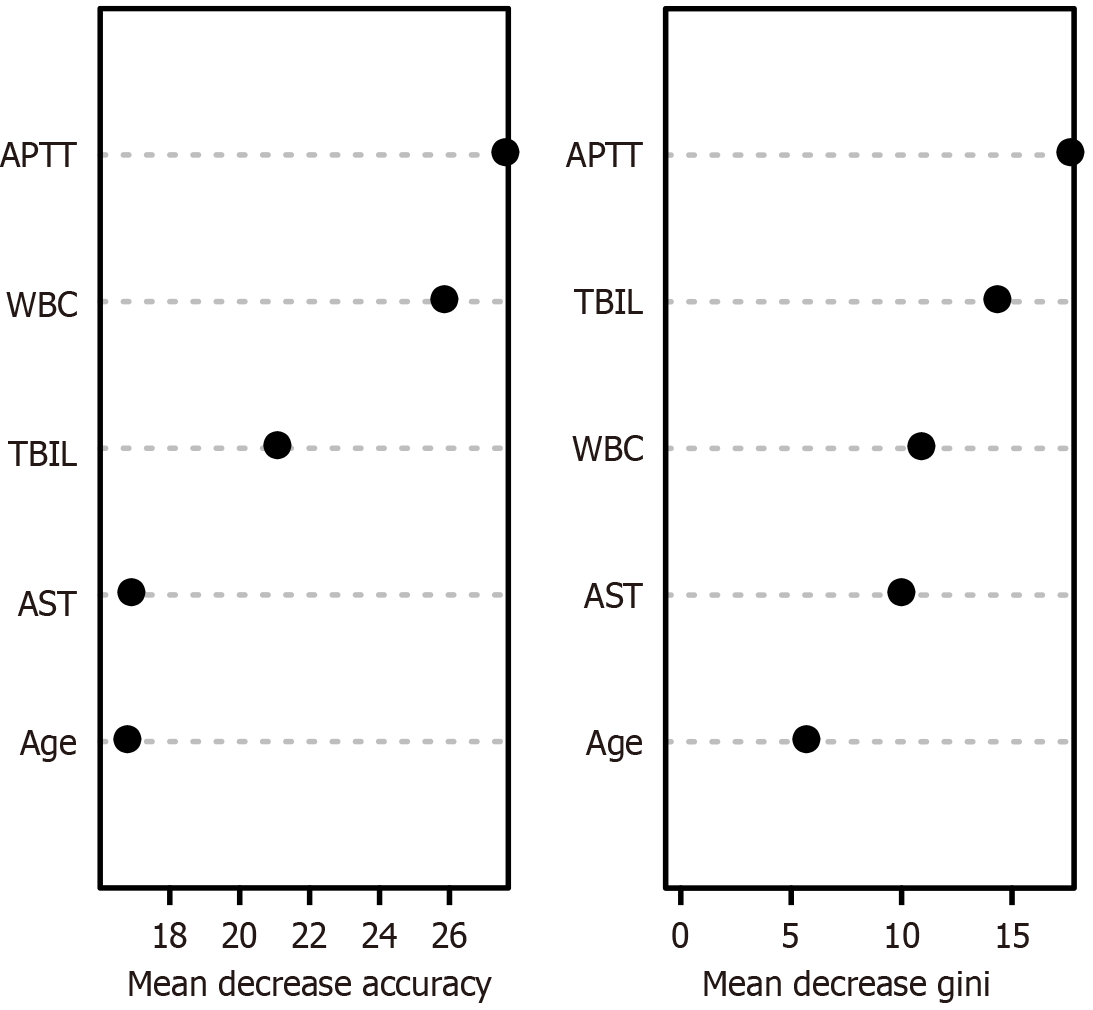
A random-forest model was developed using the training cohort to rank the variables influencing the risk of postoperative death in patients who underwent abdominal surgery, with the order of significance being the APTT, WBC count, TBIL level, AST level, and age (Figure 5). The higher the score, the greater the variable’s influence on the predictive ability of the model. ROC curve analysis revealed that the AUC for the random-forest model was 1 (95%CI: 1-1), achieving a specificity of 1 and a sensitivity of 1. In the validation cohort, the AUC was 0.928 (95%CI: 0.869-0.987), with a specificity of 0.811 and a sensitivity of 1.000, as depicted in Figure 3E and F.
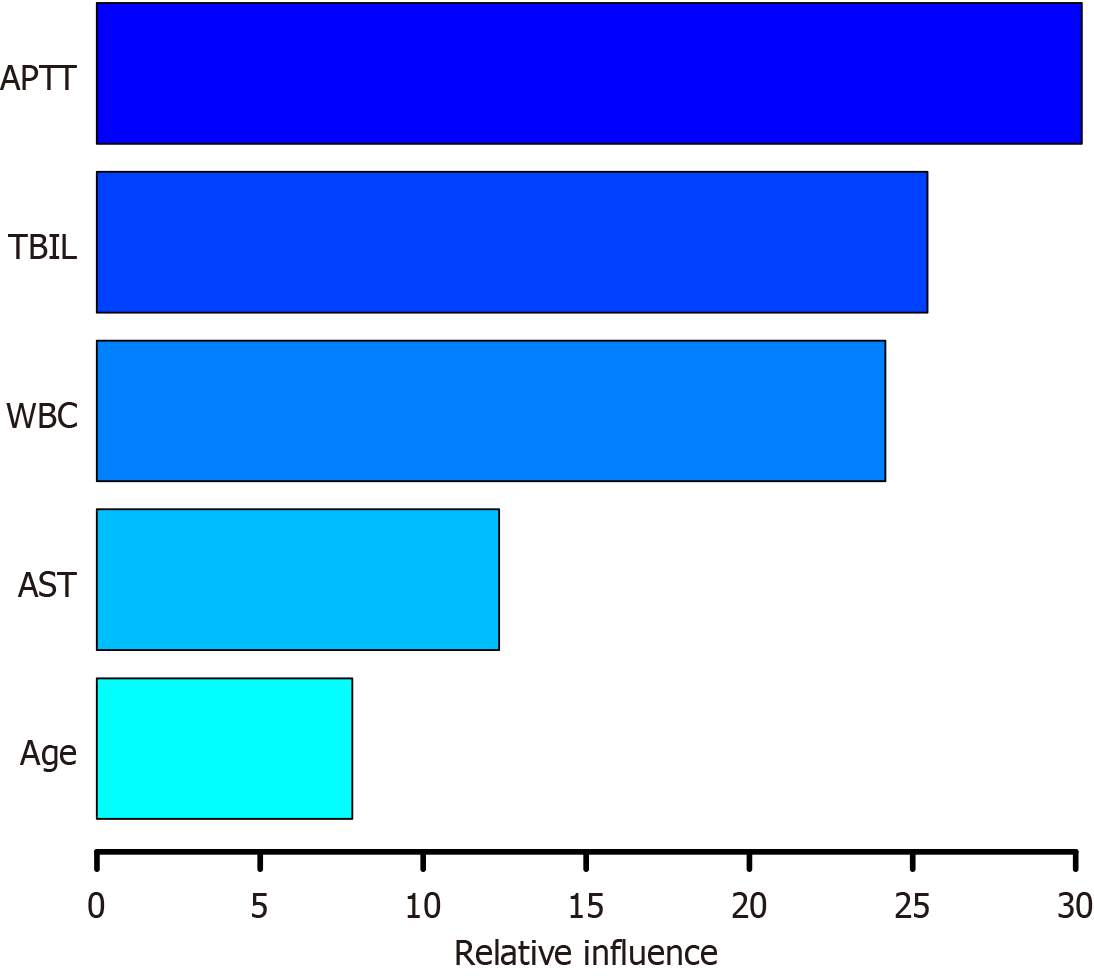
A gradient-boosting tree model was established using the training dataset to determine the relative significance of the five indicators ranked by the following importance scores: APTT (30.190), TBIL level (25.466), WBC count (24.170), AST level (12.340), and age (7.834), as illustrated in Figure 6. The higher the score, the greater the variable’s influence on the predictive ability of the model. ROC curve analysis indicated that the AUC for the gradient-boosting tree model was 0.987 (95%CI: 0.974-0.999), with a specificity of 0.952 and a sensitivity of 0.972. In the validation cohort, the AUC was 0.907 (95%CI: 0.837-0.976), with a specificity of 0.906 and a sensitivity of 0.812, as presented in Figure 3G and H.
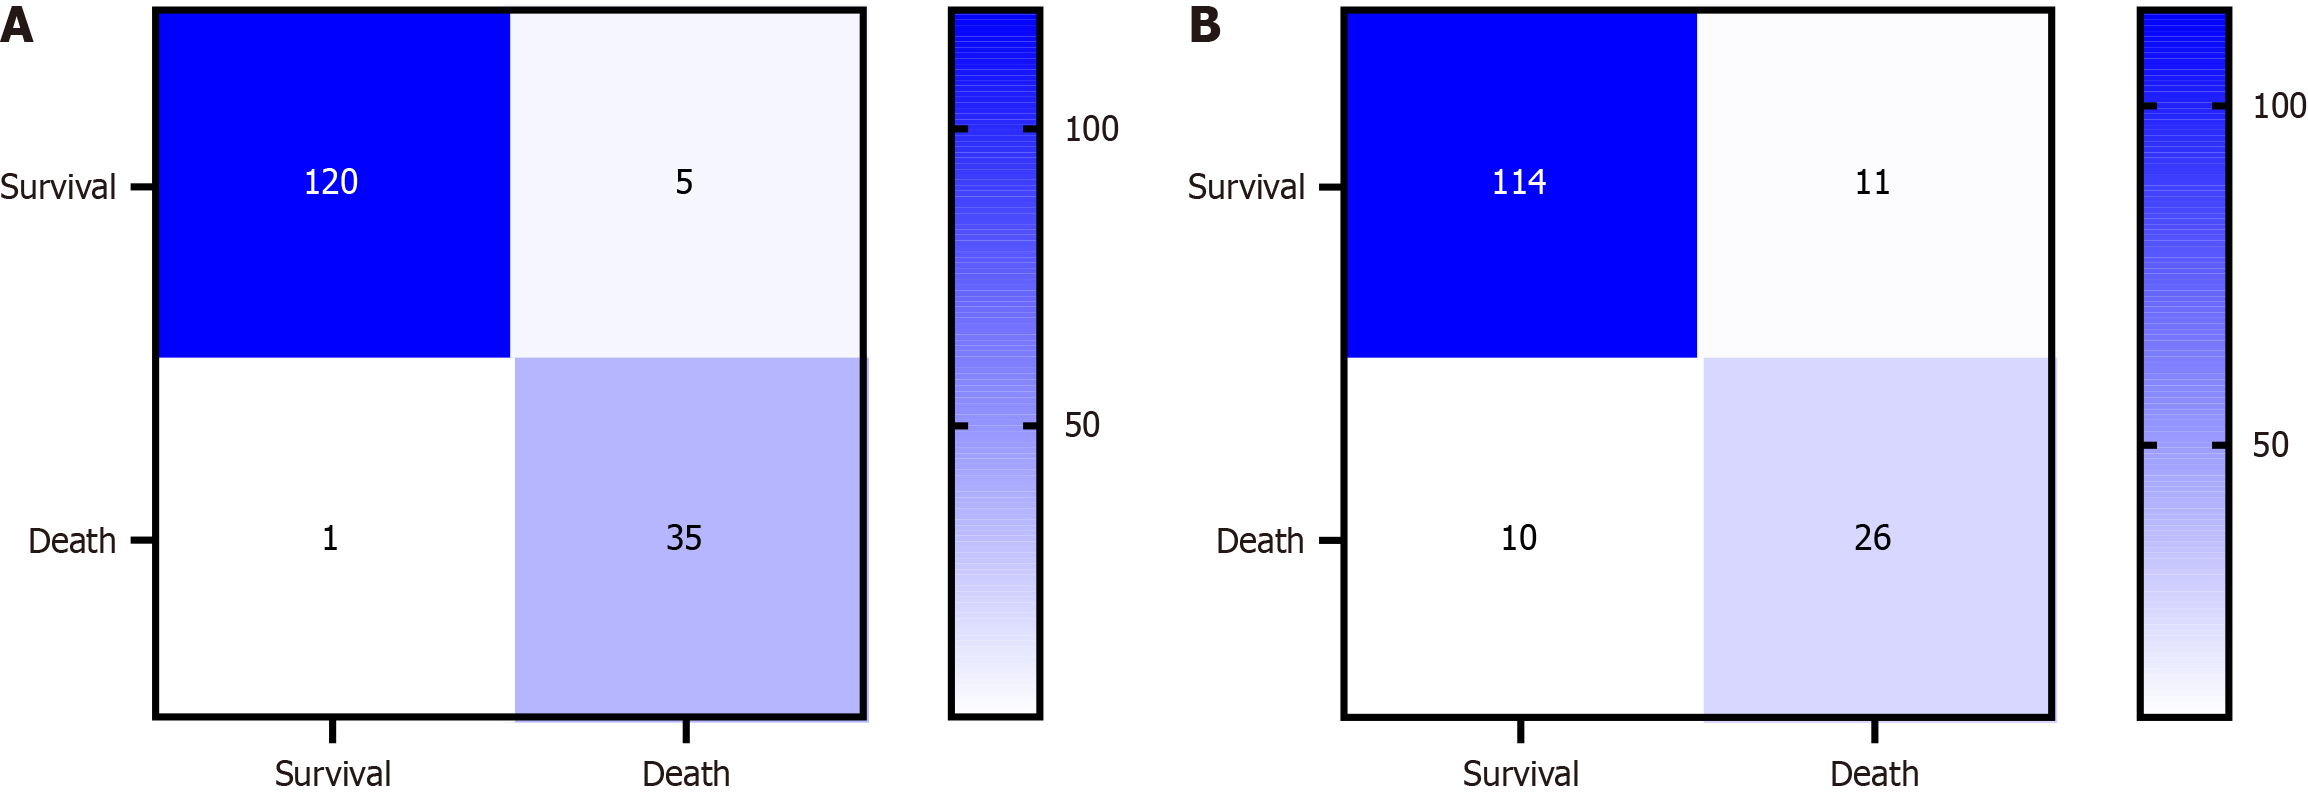
A support vector machine model was constructed using the training dataset. The confusion matrix of the model is shown in Figure 7A. ROC curve analysis showed that the support vector machine model, when applied to the training cohort, demonstrated an AUC of 0.985 (95%CI: 0.970-0.999), with a specificity of 0.944 and a perfect sensitivity of 1.000. In the validation cohort, the AUC was 0.983 (95%CI: 0.959-1.000), with a specificity of 0.943 and a sensitivity that remained 1.000, as shown in Figure 3I and J.
A naive Bayesian model was developed using the training cohort. The confusion matrix for this model is shown in Figure 7B. ROC curve analysis indicated that the AUC for the naive Bayesian model was 0.918 (95%CI: 0.871-0.965), with a specificity of 0.872 and a sensitivity of 0.889. In the validation cohort, the AUC was 0.807 (95%CI: 0.702-0.911), with a specificity of 0.755 and a sensitivity of 0.812, as depicted in Figure 3K and L.
The performances of the six models built with the training cohort were assessed using the validation cohort. The DeLong test revealed that the support vector machine model, with an AUC of 0.983 (95%CI: 0.959-1.000), outperformed the decision-tree model (P = 0.023), with an AUC of 0.874 (95%CI: 0.785-0.963), and the gradient-boosting tree model (P = 0.031), with an AUC of 0.907 (95%CI: 0.837-0.976). The naive Bayesian model, with an AUC of 0.807 (95%CI: 0.702-0.911), underperformed compared to the nomogram model (P = 0.021), with an AUC of 0.908 (95%CI: 0.824-0.992), the random-forest model (P = 0.049), with an AUC of 0.928 (95%CI: 0.869-0.987), the gradient-boosting tree model (P = 0.006), and the support vector machine model (P = 0.001); all these differences were statistically significant (P < 0.05). No significant differences were observed between the AUC pairs of the other models (P < 0.05). The accuracy (the proportion of the number of samples with correct predictions to the total number of samples), sensitivity, specificity, recall (true positive rate), and precision (if the proportion of samples predicted as positive by the model is actually the proportion of positive cases) metrics of the six models are listed in Table 4.
| Model | AUC (95%CI) | Accuracy | Sensitivity | Specificity | Recall | Precision |
| Nomogram | 0.908 (0.824-0.992) | 0.899 | 0.962 | 0.688 | 0.962 | 0.911 |
| Decision-tree | 0.874 (0.785-0.963) | 0.855 | 0.849 | 0.875 | 0.849 | 0.957 |
| Random-forest | 0.928 (0.869-0.987) | 0.841 | 0.906 | 0.625 | 0.906 | 0.889 |
| Gradient-boosting tree | 0.907 (0.837-0.976) | 0.870 | 0.906 | 0.750 | 0.906 | 0.923 |
| Support vector machine | 0.983a,2,4 (0.959-1.000) | 0.884 | 0.925 | 0.750 | 0.925 | 0.925 |
| Naive Bayes | 0.807a,1,3,4,5 (0.702-0.911) | 0.797 | 0.811 | 0.750 | 0.811 | 0.915 |
Machine learning can learn from extensive datasets without explicit programming instructions. This technology enables the enhancement of performance over time[8-10]. In contrast, traditional medical electronic information systems aggregate patient data and process information based on predefined rules[11]. The use of machine learning in medicine allows for more in-depth data analysis than is possible with traditional analytical techniques, and therefore holds great promise for clinical use[12]. In this study, the ability of machine learning models to predict 30-day postoperative mortality following abdominal surgery was studied using six prominent algorithms.
The findings of this study indicate that age, APTT, TBIL level, AST level, and WBC count are predictive of postoperative mortality risk after abdominal surgery. The APTT is an indicator of coagulation status, and a longer APTT should be considered, especially when administering preoperative anticoagulants, which could lead to increased bleeding during and after surgery[13,14]. Postoperative bleeding is a significant contributor to mortality. Our findings support the notion that an extended APTT is associated with a heightened risk of postoperative death. Elevated TBIL levels are indicative of liver dysfunction in terms of its metabolic and excretory capabilities, and thus affects patient outcomes[15]. The present study revealed significantly higher TBIL levels in the death group than in the survival group, suggesting that the TBIL level is a significant risk factor for death after abdominal surgery. AST is predominantly found in the myocardium, liver, skeletal muscle, kidneys, and pancreas. In the context of abdominal surgery, and in particular liver procedures, AST may be released into the bloodstream due to liver damage, increasing serum AST levels[16,17]. This increase not only signifies liver injury and potential dysfunction, but may also be linked to postoperative complications, inflammation, and infections, all of which could increase the mortality risk. The WBC count is a crucial predictor of postoperative death in patients undergoing abdominal surgery, as it reflects the body’s response to infection and inflammation[18,19]. An elevated WBC count typically signifies the presence of inflammation or infection, which, if left untreated, can lead to severe complications and potentially death after abdominal surgery[20]. Consequently, vigilant postoperative monitoring of the WBC count and prompt intervention are essential to minimize the mortality risk.
Medical data, which are characterized by heterogeneity, high dimensionality, intricate causality, imbalances, and gaps, present challenges for single machine learning algorithms in capturing complex relationships[21]. The integration of various machine learning algorithms has emerged as a novel approach in medical research. A 2020 study by Agius et al[22] combined 28 machine learning algorithms, including those used in the present study, to develop a new predictive algorithm for the risk of infection in patients undergoing standard treatment for chronic lymphoblastic leukemia, achieving a recall rate and accuracy exceeding 70%, an improvement over single models.
In the present study, six prevalent machine learning algorithms were selected for analysis. The findings indicated that nomogram, random-forest, gradient-boosting tree, and support vector machine models have strong predictive capabilities, with AUCs above 0.9, whereas the naive Bayes model did not show significant benefits. Liu et al[23] employed a support vector machine model to predict mucosal activity and surgical risk in patients with Crohn’s disease. The obtained AUC was ideal and comparable to the results of the present study. However, the number of models utilized in their research was relatively limited, making it challenging to identify an accurate model with certainty. In contrast, Yan et al[24] utilized a variety of models to predict the risk of mortality following abdominal surgery. Nevertheless, their study relied on data from the American College of Surgeons National Surgical Quality Improvement Program, which may have limited applicability to local Chinese cases. In the early days of information technology, the costs associated with data collection, storage, and analysis were prohibitive, leading to the development of simple and streamlined models[25]. However, with economic growth and technological advancements, the costs of data collection and storage have diminished, and data analysis techniques have become more sophisticated[26]. Clinical prediction models can now access larger and more diverse datasets, and by leveraging increasingly complex technologies, such as machine learning and AI, they can provide more precise outcomes to serve the needs of physicians, patients, medical decision makers, government agencies, and health administrators[27].
In the context of perioperative care, precise risk assessments are crucial for clinical staff to promptly identify high-risk patients and initiate early interventions. Tailored nursing management strategies can be devised to address the identified risk factors, thereby potentially reducing the incidence of postoperative complications and mortality. This strategy also allows a more effective allocation of healthcare resources. The cases analyzed in the current study were exclusively Chinese; therefore, they more accurately reflect the actual clinical situation in China compared to cases evaluated in other studies. However, our study was limited to a single center, and the sample size was relatively small; this restricts its ability to represent the broader population of patients undergoing abdominal surgery across different regions, hospital levels, and medical teams. Although some models appear to perfectly differentiate between death and survival, their validity requires further scrutiny. In the future, we plan to conduct prospective studies with larger sample sizes to systematically collect data and mitigate issues associated with missing data or inaccurate records that are common in retrospective studies. Furthermore, we aim to gather extensive data from multi-regional and multi-level hospitals, covering a diverse range of patients undergoing abdominal surgery with varying ages, sexes, disease types, and severity levels. These improvements are designed to enhance the generalizability of our models, ensure that our research findings are more universally applicable, and ultimately provide more robust guidance for clinical practice.
| 1. | Dobson GR, Chau A. Special announcement: Guidelines to the Practice of Anesthesia-Revised Edition 2024. Can J Anaesth. 2024;71:1-7. [RCA] [PubMed] [DOI] [Full Text] [Reference Citation Analysis (0)] |
| 2. | Khambaty M, Devalapalli AP, Silbert RE, Kashiwagi DT, Regan DW, Sundsted KK, Mauck KF. Practice Changing Updates in Perioperative Medicine Literature 2022. A Systematic Review. Am J Med. 2023;136:753-762.e1. [RCA] [PubMed] [DOI] [Full Text] [Reference Citation Analysis (0)] |
| 3. | Topol EJ. High-performance medicine: the convergence of human and artificial intelligence. Nat Med. 2019;25:44-56. [RCA] [PubMed] [DOI] [Full Text] [Cited by in Crossref: 2376] [Cited by in RCA: 2811] [Article Influence: 468.5] [Reference Citation Analysis (0)] |
| 4. | Graeßner M, Jungwirth B, Frank E, Schaller SJ, Kochs E, Ulm K, Blobner M, Ulm B, Podtschaske AH, Kagerbauer SM. Enabling personalized perioperative risk prediction by using a machine-learning model based on preoperative data. Sci Rep. 2023;13:7128. [RCA] [PubMed] [DOI] [Full Text] [Cited by in Crossref: 7] [Cited by in RCA: 11] [Article Influence: 5.5] [Reference Citation Analysis (0)] |
| 5. | Bates DW, Levine D, Syrowatka A, Kuznetsova M, Craig KJT, Rui A, Jackson GP, Rhee K. The potential of artificial intelligence to improve patient safety: a scoping review. NPJ Digit Med. 2021;4:54. [RCA] [PubMed] [DOI] [Full Text] [Full Text (PDF)] [Cited by in Crossref: 121] [Cited by in RCA: 110] [Article Influence: 27.5] [Reference Citation Analysis (0)] |
| 6. | Chen H, Yu D, Zhang J, Li J. Machine Learning for Prediction of Postoperative Delirium in Adult Patients: A Systematic Review and Meta-analysis. Clin Ther. 2024;46:1069-1081. [RCA] [PubMed] [DOI] [Full Text] [Reference Citation Analysis (0)] |
| 7. | Mesinovic M, Wong XC, Rajahram GS, Citarella BW, Peariasamy KM, van Someren Greve F, Olliaro P, Merson L, Clifton L, Kartsonaki C; ISARIC Characterisation Group. At-admission prediction of mortality and pulmonary embolism in an international cohort of hospitalised patients with COVID-19 using statistical and machine learning methods. Sci Rep. 2024;14:16387. [RCA] [PubMed] [DOI] [Full Text] [Full Text (PDF)] [Reference Citation Analysis (0)] |
| 8. | Lee S, Mohr NM, Street WN, Nadkarni P. Machine Learning in Relation to Emergency Medicine Clinical and Operational Scenarios: An Overview. West J Emerg Med. 2019;20:219-227. [RCA] [PubMed] [DOI] [Full Text] [Full Text (PDF)] [Cited by in Crossref: 24] [Cited by in RCA: 23] [Article Influence: 3.8] [Reference Citation Analysis (0)] |
| 9. | Cai Z, Poulos RC, Liu J, Zhong Q. Machine learning for multi-omics data integration in cancer. iScience. 2022;25:103798. [RCA] [PubMed] [DOI] [Full Text] [Full Text (PDF)] [Cited by in Crossref: 102] [Cited by in RCA: 116] [Article Influence: 38.7] [Reference Citation Analysis (0)] |
| 10. | Metsker O, Kopanitsa G, Malushko A, Komlichenko E, Bolgova K, Paskoshev D. Gynecological Surgery and Machine Learning: Complications and Length of Stay Prediction. Stud Health Technol Inform. 2021;281:575-579. [RCA] [PubMed] [DOI] [Full Text] [Reference Citation Analysis (0)] |
| 11. | Lacasse ML, Hendel ET, Farhat N, Kelly DJ, Mah EM, Campbell A, Ansell DR, Bourdon CA, Christie TS, Volpini S, Liu LJW, Cragg JJ, Crispo JAG. Electronic medical information systems and timeliness of care in the emergency department: a scoping review. Discov Health Systems. 2024;3:23. [DOI] [Full Text] |
| 12. | Lima DL, Kasakewitch J, Nguyen DQ, Nogueira R, Cavazzola LT, Heniford BT, Malcher F. Machine learning, deep learning and hernia surgery. Are we pushing the limits of abdominal core health? A qualitative systematic review. Hernia. 2024;28:1405-1412. [RCA] [PubMed] [DOI] [Full Text] [Reference Citation Analysis (0)] |
| 13. | Moster M, Bolliger D. Perioperative Guidelines on Antiplatelet and Anticoagulant Agents: 2022 Update. Curr Anesthesiol Rep. 2022;12:286-296. [RCA] [DOI] [Full Text] [Cited by in Crossref: 1] [Cited by in RCA: 36] [Article Influence: 12.0] [Reference Citation Analysis (0)] |
| 14. | Barbosa ACN, Montalvão SAL, Barbosa KGN, Colella MP, Annichino-Bizzacchi JM, Ozelo MC, De Paula EV. Prolonged APTT of unknown etiology: A systematic evaluation of causes and laboratory resource use in an outpatient hemostasis academic unit. Res Pract Thromb Haemost. 2019;3:749-757. [RCA] [PubMed] [DOI] [Full Text] [Full Text (PDF)] [Cited by in Crossref: 17] [Cited by in RCA: 24] [Article Influence: 4.0] [Reference Citation Analysis (0)] |
| 15. | Klimczak-Tomaniak D, Andrzejczyk K, Abou Kamar S, Baart S, van Boven N, Akkerhuis KM, Constantinescu A, Caliskan K, Simsek S, Germanse T, van Ramshorst J, Brugts J, Kuch M, Umans V, Boersma E, Kardys I. Temporal evolution of liver function parameters predicts clinical outcome in chronic heart failure patients (Bio-SHiFT study). Cardiol J. 2024;31:409-417. [RCA] [PubMed] [DOI] [Full Text] [Reference Citation Analysis (0)] |
| 16. | Vassanasiri W, Rungsakulkij N, Suragul W, Tangtawee P, Muangkaew P, Mingphruedhi S, Aeesoa S. Early postoperative serum aspartate aminotransferase for prediction of post-hepatectomy liver failure. Perioper Med (Lond). 2022;11:51. [RCA] [PubMed] [DOI] [Full Text] [Full Text (PDF)] [Cited by in RCA: 2] [Reference Citation Analysis (0)] |
| 17. | de Klein GW, Brohet RM, Liem MSL, Klaase JM. Post-operative Day 1 Serum Transaminase Levels in Relation to Morbidity After Liver Resection. World J Surg. 2022;46:433-440. [RCA] [PubMed] [DOI] [Full Text] [Reference Citation Analysis (0)] |
| 18. | Wang B, Wang Y, Huang J, Wang P, Yao D, Huang Y, Zhou Z, Zhen L, Yu C, Xie T, Li Y. Impact of enhanced recovery after surgery (ERAS) on surgical site infection and postoperative recovery outcomes: a retrospective study of 1276 cases. Sci Rep. 2024;14:24055. [RCA] [PubMed] [DOI] [Full Text] [Full Text (PDF)] [Reference Citation Analysis (0)] |
| 19. | Chiarelli M, Achilli P, Tagliabue F, Brivio A, Airoldi A, Guttadauro A, Porro F, Fumagalli L. Perioperative lymphocytopenia predicts mortality and severe complications after intestinal surgery. Ann Transl Med. 2019;7:311. [RCA] [PubMed] [DOI] [Full Text] [Cited by in Crossref: 8] [Cited by in RCA: 17] [Article Influence: 2.8] [Reference Citation Analysis (0)] |
| 20. | Tfaily MA, Ghanem P, Farran SH, Dabdoub F, Kanafani ZA. The role of preoperative albumin and white blood cell count in surgical site infections following whipple surgery. Sci Rep. 2022;12:19184. [RCA] [PubMed] [DOI] [Full Text] [Cited by in RCA: 4] [Reference Citation Analysis (0)] |
| 21. | Zhang A, Xing L, Zou J, Wu JC. Shifting machine learning for healthcare from development to deployment and from models to data. Nat Biomed Eng. 2022;6:1330-1345. [RCA] [PubMed] [DOI] [Full Text] [Cited by in Crossref: 232] [Cited by in RCA: 138] [Article Influence: 46.0] [Reference Citation Analysis (0)] |
| 22. | Agius R, Brieghel C, Andersen MA, Pearson AT, Ledergerber B, Cozzi-Lepri A, Louzoun Y, Andersen CL, Bergstedt J, von Stemann JH, Jørgensen M, Tang ME, Fontes M, Bahlo J, Herling CD, Hallek M, Lundgren J, MacPherson CR, Larsen J, Niemann CU. Machine learning can identify newly diagnosed patients with CLL at high risk of infection. Nat Commun. 2020;11:363. [RCA] [PubMed] [DOI] [Full Text] [Full Text (PDF)] [Cited by in Crossref: 46] [Cited by in RCA: 76] [Article Influence: 15.2] [Reference Citation Analysis (0)] |
| 23. | Liu R, Yang J, Liu S, Ke J, Wang Z, Zhu H, Ren K, Zhou X, Wang Z, Zhu W, Niu T, Lu Y. A Novel Radiomics Model Integrating Luminal and Mesenteric Features to Predict Mucosal Activity and Surgery Risk in Crohn’s Disease Patients: A Multicenter Study. Acad Radiol. 2023;30 Suppl 1:S207-S219. [RCA] [PubMed] [DOI] [Full Text] [Cited by in Crossref: 1] [Cited by in RCA: 17] [Article Influence: 8.5] [Reference Citation Analysis (0)] |
| 24. | Yan X, Goldsmith J, Mohan S, Turnbull ZA, Freundlich RE, Billings FT 4th, Kiran RP, Li G, Kim M. Impact of Intraoperative Data on Risk Prediction for Mortality After Intra-Abdominal Surgery. Anesth Analg. 2022;134:102-113. [RCA] [PubMed] [DOI] [Full Text] [Cited by in Crossref: 13] [Cited by in RCA: 14] [Article Influence: 4.7] [Reference Citation Analysis (0)] |
| 25. | Sharma A, Lysenko A, Jia S, Boroevich KA, Tsunoda T. Advances in AI and machine learning for predictive medicine. J Hum Genet. 2024;69:487-497. [RCA] [PubMed] [DOI] [Full Text] [Cited by in Crossref: 7] [Cited by in RCA: 33] [Article Influence: 33.0] [Reference Citation Analysis (0)] |
| 26. | Ajibade SM, Alhassan GN, Zaidi A, Oki OA, Awotunde JB, Ogbuju E, Akintoye KA. Evolution of machine learning applications in medical and healthcare analytics research: A bibliometric analysis. ISWA. 2024;24:200441. [DOI] [Full Text] |
| 27. | Haug CJ, Drazen JM. Artificial Intelligence and Machine Learning in Clinical Medicine, 2023. N Engl J Med. 2023;388:1201-1208. [RCA] [PubMed] [DOI] [Full Text] [Cited by in Crossref: 685] [Cited by in RCA: 495] [Article Influence: 247.5] [Reference Citation Analysis (1)] |


